SOM cluster: 783
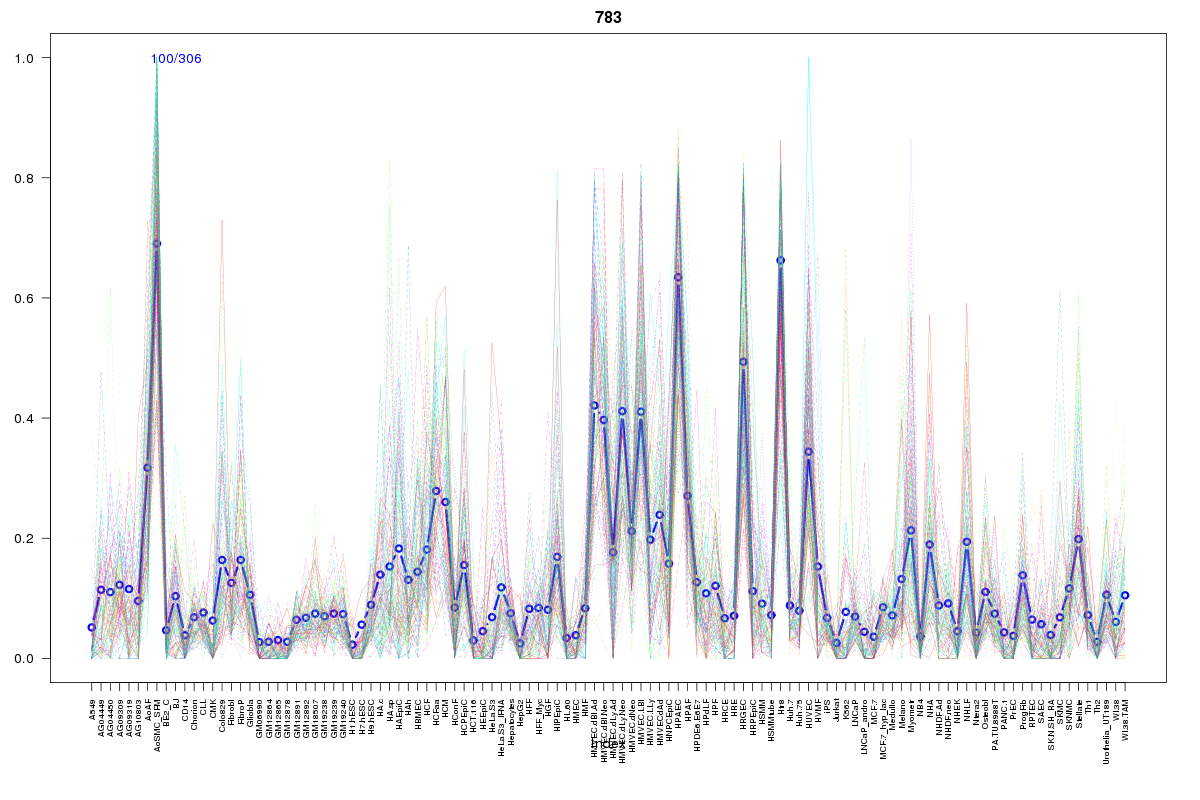
Cluster Hypersensitivity Profile

Genomic Location Trend
These plots show the distribution of the DHS sites surrounding the Transcript Start Site of the nearest gene.
Stats
Number of sites: 306Promoter: 1%
CpG-Island: 0%
Conserved: 43%
Enriched Motifs & Matches
Match Detail: [Jaspar]
|
| ||
|---|---|---|
| Sites: 56/100 | e-val: 0.0013 | ||
| Factor | e-val(match) | DB |
| Lhx3 | 0.0000012511 | JASPAR |
| Foxd3 | 0.00025487 | JASPAR |
| HNF1A | 0.00054778 | JASPAR |
| Pax4 | 0.0052645 | JASPAR |
| HNF1B | 0.0098681 | JASPAR |
|
| ||
| Sites: 27/100 | e-val: 0.32 | ||
| Factor | e-val(match) | DB |
| Foxd3 | 0.00055838 | JASPAR |
| FOXA1 | 0.00080254 | JASPAR |
| Foxa2 | 0.0041826 | JASPAR |
| FOXF2 | 0.0044576 | JASPAR |
| FOXI1 | 0.0058014 | JASPAR |
|
| ||
| Sites: 12/100 | e-val: 1.6 | ||
| Factor | e-val(match) | DB |
| RELA | 0.00016313 | JASPAR |
| NF-kappaB | 0.00047664 | JASPAR |
| znf143 | 0.0011262 | JASPAR |
| REL | 0.0047368 | JASPAR |
| Lhx3 | 0.0091724 | JASPAR |
BED file downloads
Top 10 Example Regions
| Location | Gene Link | Dist. |
|---|---|---|
| chr8: 118744080-118744230 | EXT1 | 31.6 |
| chr4: 86683460-86683610 | ARHGAP24 | 57.13 |
| chr3: 193698200-193698350 | DPPA2P3 | 60.16 |
| chr5: 157254560-157254710 | THG1L | 61.06 |
| chr8: 89190280-89190430 | MMP16 | 61.81 |
| chr1: 117466140-117466290 | PTGFRN | 63.95 |
| chr5: 72936720-72936870 | ARHGEF28 | 64.07 |
| chr5: 58945000-58945150 | PDE4D | 65.63 |
| chr17: 1026240-1026390 | ABR | 65.79 |
| chr1: 101174140-101174290 | VCAM1 | 65.97 |