SOM cluster: 808
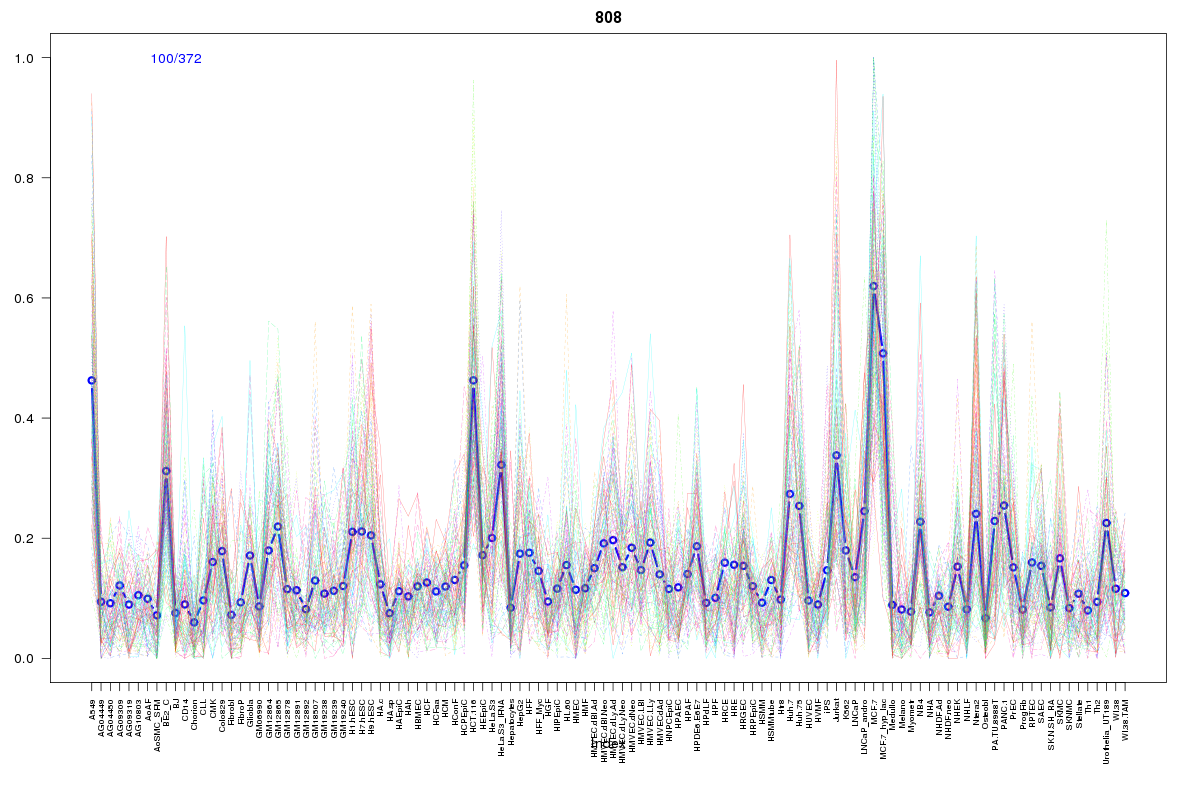
Cluster Hypersensitivity Profile

Genomic Location Trend
These plots show the distribution of the DHS sites surrounding the Transcript Start Site of the nearest gene.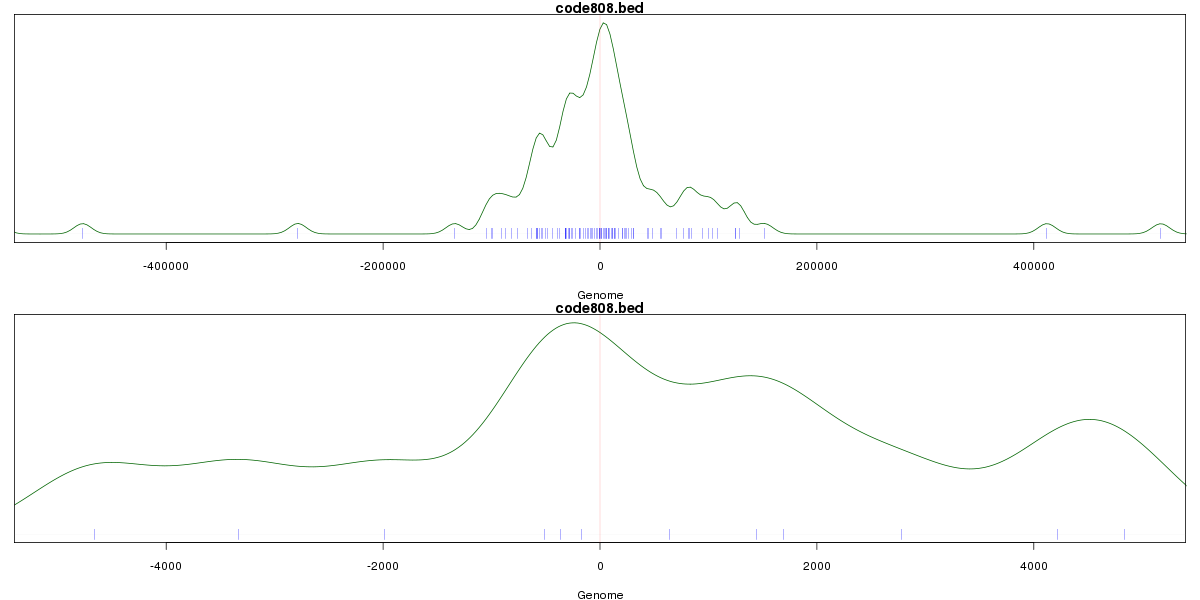
Stats
Number of sites: 372Promoter: 4%
CpG-Island: 0%
Conserved: 37%
Enriched Motifs & Matches
Match Detail: [Jaspar]
|
| ||
|---|---|---|
| Sites: 44/100 | e-val: 1.6e-31 | ||
| Factor | e-val(match) | DB |
| CTCF | 0 | JASPAR |
| MYC::MAX | 0.000026567 | JASPAR |
| Zfp423 | 0.000057007 | JASPAR |
| T | 0.00038393 | JASPAR |
| TAL1::TCF3 | 0.00050747 | JASPAR |
BED file downloads
Top 10 Example Regions
| Location | Gene Link | Dist. |
|---|---|---|
| chr1: 150402380-150402530 | PRPF3 | 18.34 |
| chr1: 150402380-150402530 | TARS2 | 18.34 |
| chr1: 150402380-150402530 | RPRD2 | 18.34 |
| chr3: 128222045-128222195 | DNAJB8 | 29.79 |
| chr9: 130650200-130650350 | DPM2 | 45.3 |
| chr9: 130650200-130650350 | RP11-203J24.8 | 45.3 |
| chr9: 130650200-130650350 | CDK9 | 45.3 |
| chr9: 130650200-130650350 | FPGS | 45.3 |
| chr8: 110651960-110652110 | EBAG9 | 47.32 |
| chr8: 110651960-110652110 | SYBU | 47.32 |