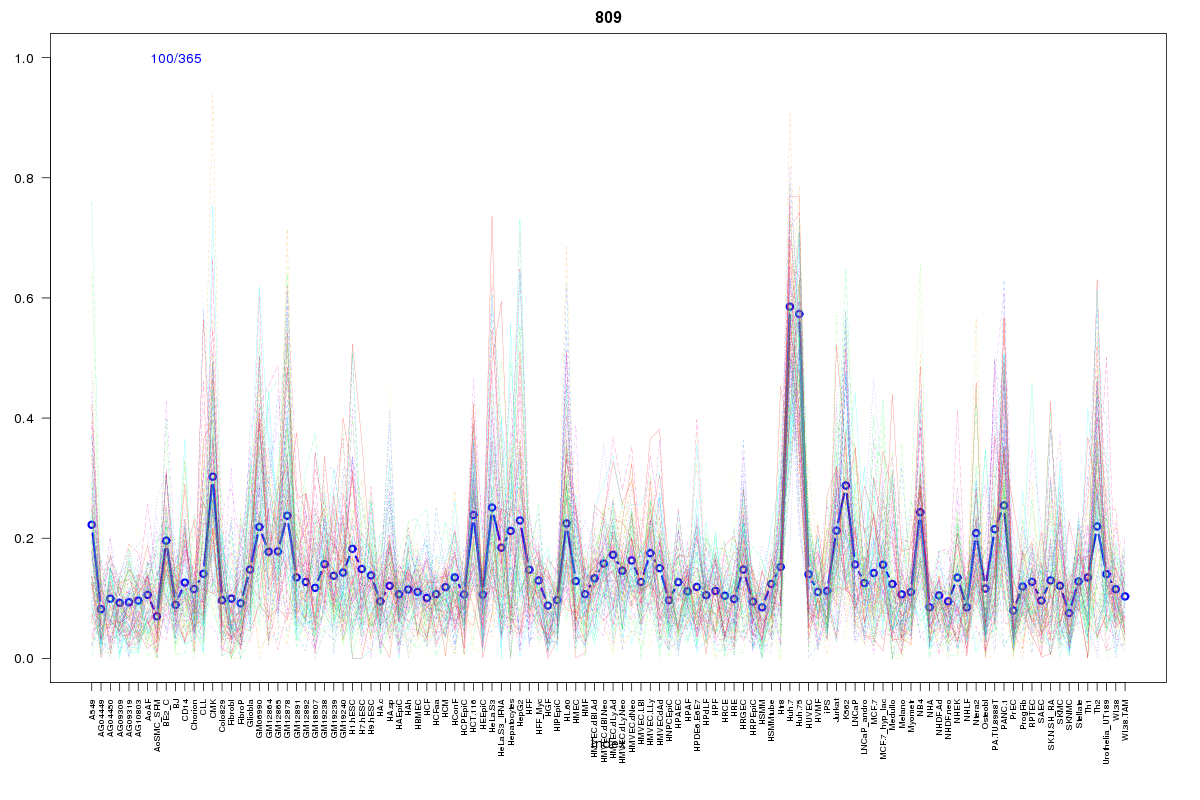
SOM cluster: 809
Cluster Hypersensitivity Profile

Genomic Location Trend
These plots show the distribution of the DHS sites surrounding the Transcript Start Site of the nearest gene.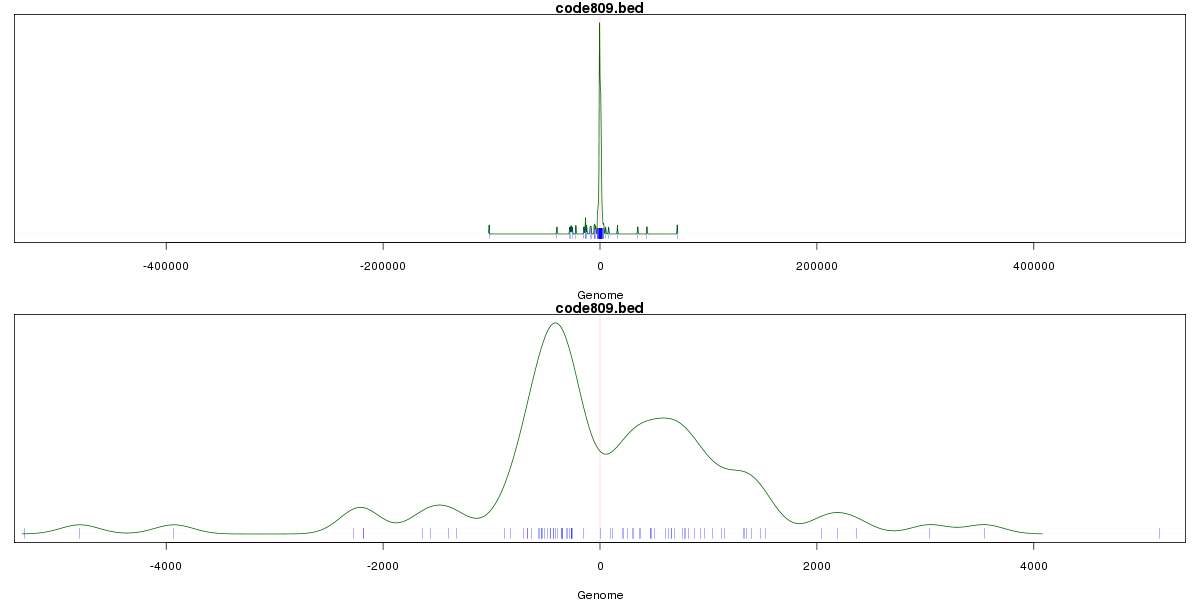
Stats
Number of sites: 365Promoter: 45%
CpG-Island: 6%
Conserved: 28%
Enriched Motifs & Matches
Match Detail: [Jaspar]
|
| ||
|---|---|---|
| Sites: 15/100 | e-val: 0.0033 | ||
| Factor | e-val(match) | DB |
| SP1 | 0.000000000027127 | JASPAR |
| Pax4 | 0.0000078265 | JASPAR |
| EWSR1-FLI1 | 0.00032971 | JASPAR |
| MZF1_5-13 | 0.00070559 | JASPAR |
| INSM1 | 0.00094877 | JASPAR |
BED file downloads
Top 10 Example Regions
| Location | Gene Link | Dist. |
|---|---|---|
| chr3: 27764005-27764155 | EOMES | 39.01 |
| chr3: 27764005-27764155 | AC098973.2 | 39.01 |
| chr6: 10424305-10424455 | RP1-290I10.3 | 42.81 |
| chr6: 10424305-10424455 | MRPL48P1 | 42.81 |
| chr11: 66095625-66095775 | RP11-867G23.12 | 44.55 |
| chr11: 66095625-66095775 | B3GNT1 | 44.55 |
| chr11: 66095625-66095775 | PACS1 | 44.55 |
| chr11: 57530020-57530170 | CTNND1 | 48.05 |
| chr11: 57430440-57430590 | ZDHHC5 | 48.07 |
| chr11: 57430440-57430590 | C11orf31 | 48.07 |