SOM cluster: 810
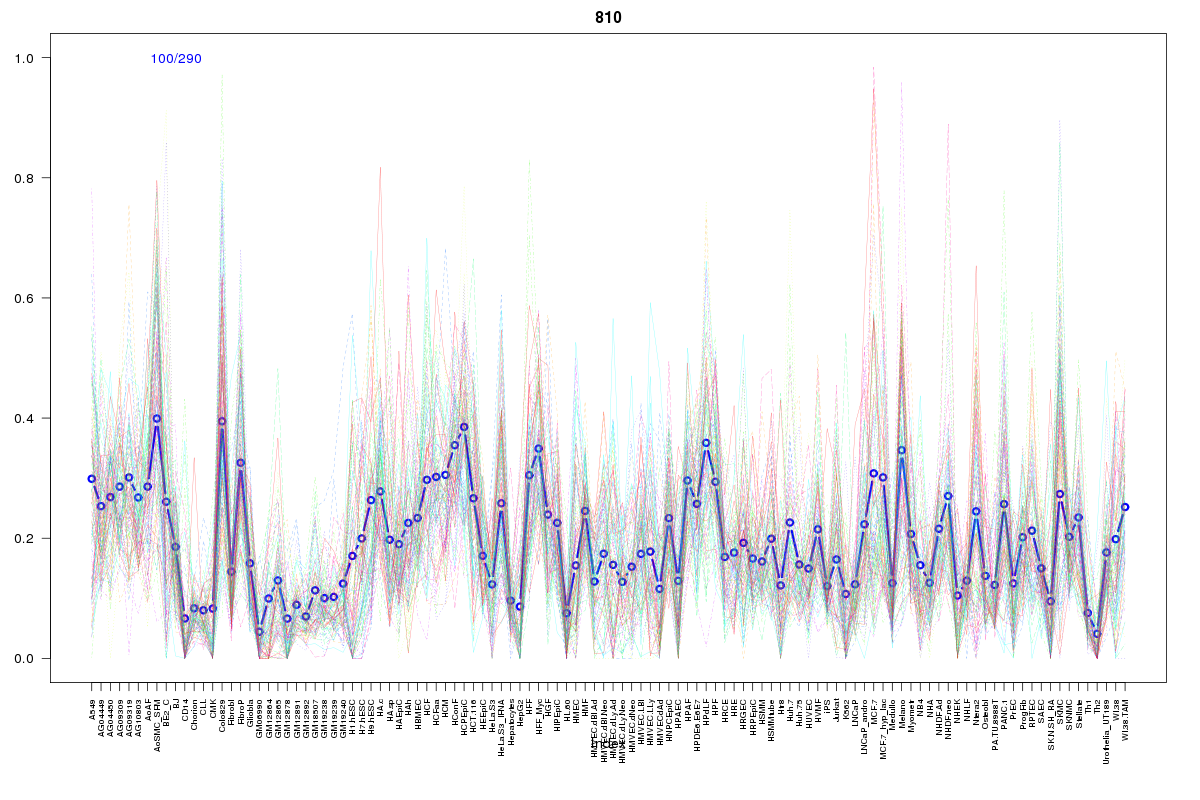
Cluster Hypersensitivity Profile

Genomic Location Trend
These plots show the distribution of the DHS sites surrounding the Transcript Start Site of the nearest gene.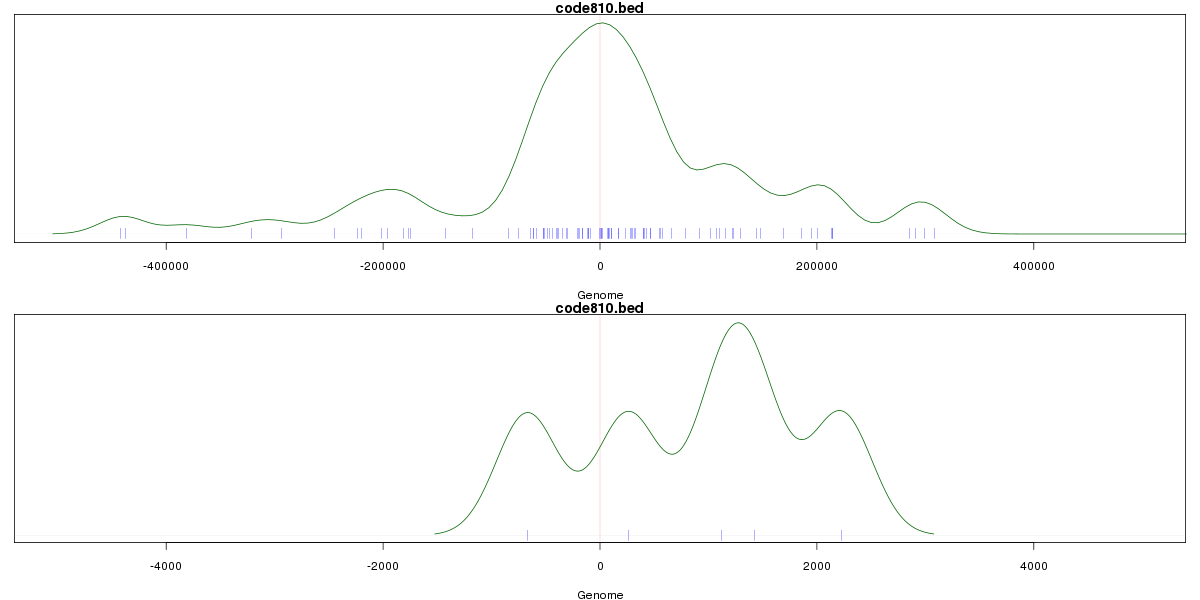
Stats
Number of sites: 290Promoter: 1%
CpG-Island: 0%
Conserved: 69%
Enriched Motifs & Matches
Match Detail: [Jaspar]
|
| ||
|---|---|---|
| Sites: 66/100 | e-val: 0 | ||
| Factor | e-val(match) | DB |
| CTCF | 0.0000000000024389 | JASPAR |
| INSM1 | 0.0029634 | JASPAR |
| TAL1::TCF3 | 0.011111 | JASPAR |
| MYC::MAX | 0.050996 | JASPAR |
| Myf | 0.060029 | JASPAR |
|
| ||
| Sites: 56/100 | e-val: 0.000000000000017 | ||
| Factor | e-val(match) | DB |
| Foxd3 | 0.0000044197 | JASPAR |
| Foxq1 | 0.00002504 | JASPAR |
| FOXI1 | 0.0034036 | JASPAR |
| Lhx3 | 0.0037764 | JASPAR |
| HNF1A | 0.0060338 | JASPAR |
BED file downloads
Top 10 Example Regions
| Location | Gene Link | Dist. |
|---|---|---|
| chr7: 55338880-55339030 | EGFR-AS1 | 36.88 |
| chr7: 55338880-55339030 | RP11-775L16.1 | 36.88 |
| chr7: 55338880-55339030 | EGFR | 36.88 |
| chr13: 98797385-98797535 | FARP1 | 39.43 |
| chr7: 134576560-134576710 | CALD1 | 46.12 |
| chr1: 86350400-86350550 | RNA5SP51 | 50.48 |
| chr7: 38491560-38491710 | TRGV3 | 54.25 |
| chr7: 38491560-38491710 | TRGV2 | 54.25 |
| chr7: 38491560-38491710 | AMPH | 54.25 |
| chr7: 38491560-38491710 | TRGV4 | 54.25 |