SOM cluster: 815
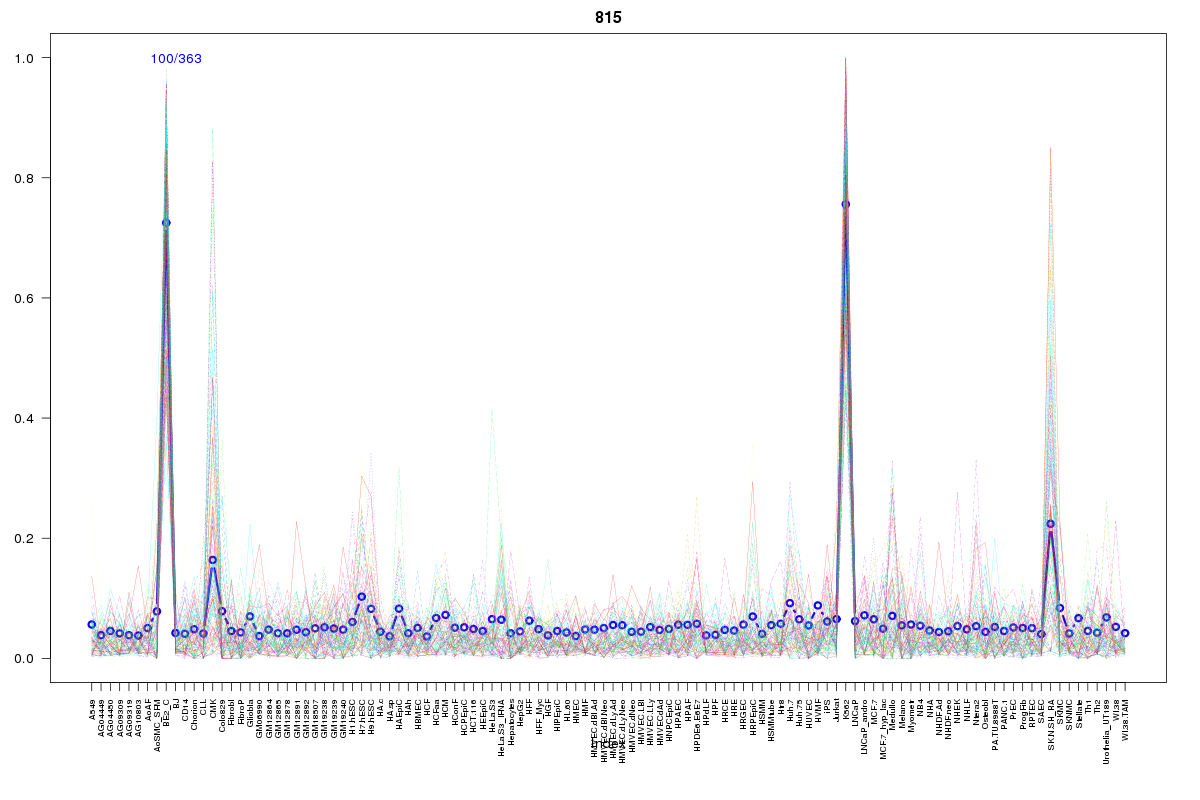
Cluster Hypersensitivity Profile

Genomic Location Trend
These plots show the distribution of the DHS sites surrounding the Transcript Start Site of the nearest gene.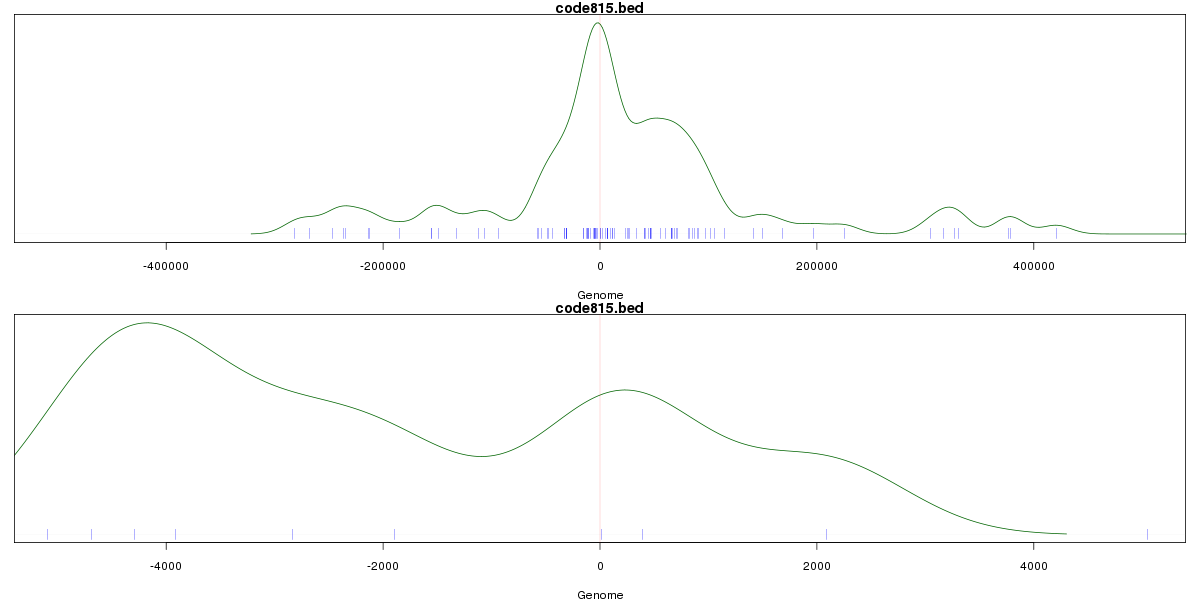
Stats
Number of sites: 363Promoter: 1%
CpG-Island: 0%
Conserved: 29%
Enriched Motifs & Matches
Match Detail: [Jaspar]
|
| ||
|---|---|---|
| Sites: 26/100 | e-val: 0.0000000072 | ||
| Factor | e-val(match) | DB |
| Tal1::Gata1 | 0.00000013323 | JASPAR |
| Gata1 | 0.00042725 | JASPAR |
| Evi1 | 0.0031352 | JASPAR |
| GATA2 | 0.027069 | JASPAR |
| GATA3 | 0.088125 | JASPAR |
BED file downloads
Top 10 Example Regions
| Location | Gene Link | Dist. |
|---|---|---|
| chr1: 168130820-168130970 | TIPRL | 37.99 |
| chr8: 10507420-10507570 | SOX7 | 38.23 |
| chr8: 10507420-10507570 | SOX7 | 38.23 |
| chrX: 53506320-53506470 | HUWE1 | 45.49 |
| chrX: 53506320-53506470 | SMC1A | 45.49 |
| chr4: 151492140-151492290 | RP11-1336O20.2 | 45.9 |
| chr1: 192946580-192946730 | TROVE2 | 48.52 |
| chr19: 10567885-10568035 | KRI1 | 50.14 |
| chr19: 10567885-10568035 | ATG4D | 50.14 |
| chr7: 150659120-150659270 | KCNH2 | 57.45 |