SOM cluster: 821
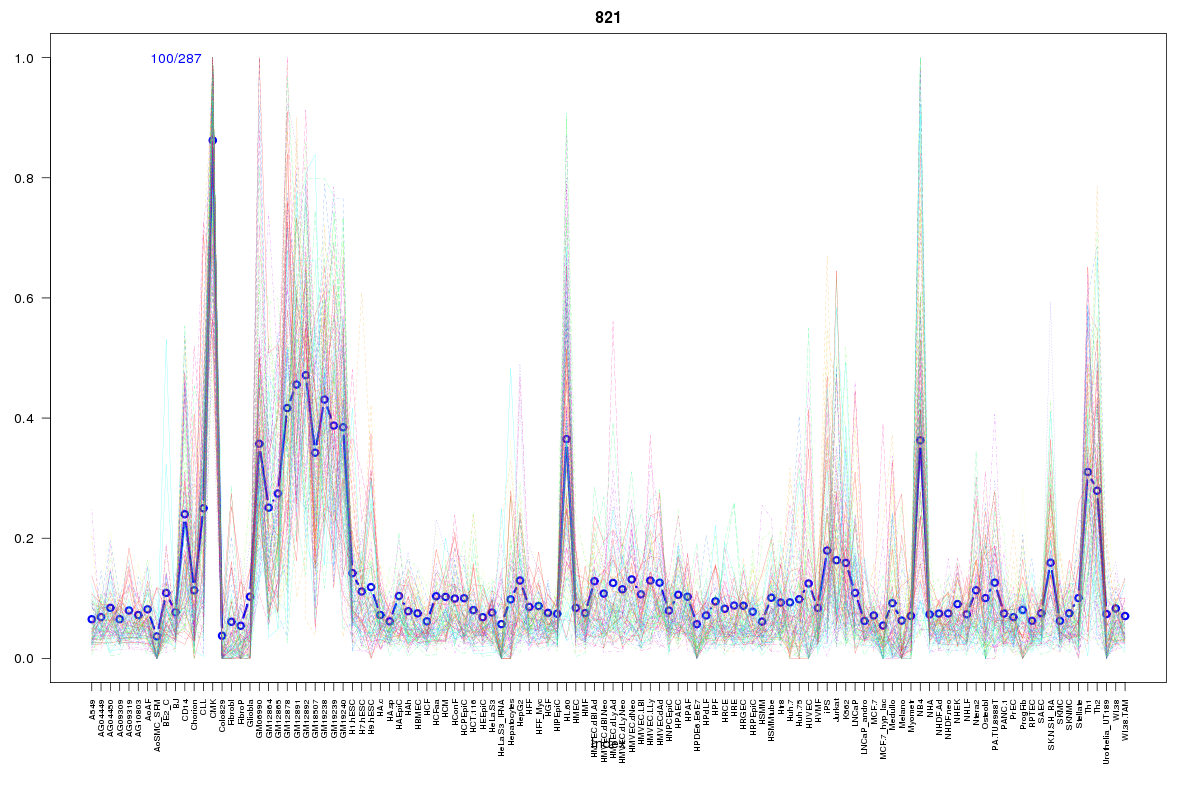
Cluster Hypersensitivity Profile

Genomic Location Trend
These plots show the distribution of the DHS sites surrounding the Transcript Start Site of the nearest gene.
Stats
Number of sites: 287Promoter: 11%
CpG-Island: 13%
Conserved: 44%
Enriched Motifs & Matches
Match Detail: [Jaspar]
|
| ||
|---|---|---|
| Sites: 82/100 | e-val: 0 | ||
| Factor | e-val(match) | DB |
| SP1 | 0.00000000097897 | JASPAR |
| Pax4 | 0.00020002 | JASPAR |
| Klf4 | 0.00020315 | JASPAR |
| TFAP2A | 0.0010128 | JASPAR |
| PLAG1 | 0.0021182 | JASPAR |
|
| ||
| Sites: 38/100 | e-val: 0.0013 | ||
| Factor | e-val(match) | DB |
| PLAG1 | 0.0000027623 | JASPAR |
| SP1 | 0.0007438 | JASPAR |
| INSM1 | 0.0021983 | JASPAR |
| Klf4 | 0.002863 | JASPAR |
| TFAP2A | 0.0033596 | JASPAR |
|
| ||
| Sites: 55/100 | e-val: 0.00000018 | ||
| Factor | e-val(match) | DB |
| SP1 | 0.000042169 | JASPAR |
| RXR::RAR_DR5 | 0.00015705 | JASPAR |
| PPARG::RXRA | 0.00022617 | JASPAR |
| SPIB | 0.00029903 | JASPAR |
| SPI1 | 0.0038752 | JASPAR |
BED file downloads
Top 10 Example Regions
| Location | Gene Link | Dist. |
|---|---|---|
| chr12: 120663700-120663850 | RPLP0 | 44.67 |
| chr1: 212856900-212857050 | BATF3 | 48.75 |
| chr11: 1890105-1890255 | LSP1 | 51.55 |
| chr17: 4835420-4835570 | GP1BA | 53.37 |
| chr17: 4835420-4835570 | C17orf107 | 53.37 |
| chr1: 161275585-161275735 | C1orf192 | 53.95 |
| chr1: 161275585-161275735 | RP11-122G18.5 | 53.95 |
| chr19: 50995560-50995710 | EMC10 | 57.96 |
| chr19: 50995560-50995710 | JOSD2 | 57.96 |
| chr19: 50995560-50995710 | ASPDH | 57.96 |