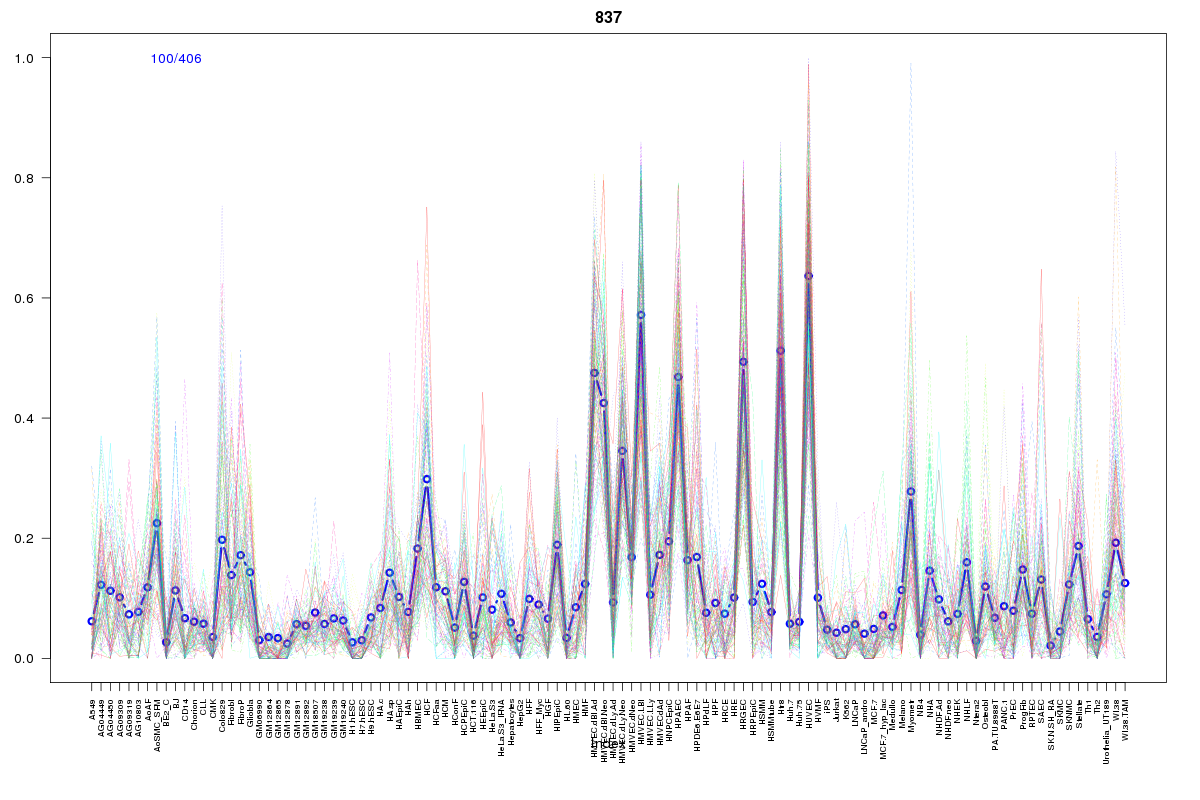
SOM cluster: 837
Cluster Hypersensitivity Profile

Genomic Location Trend
These plots show the distribution of the DHS sites surrounding the Transcript Start Site of the nearest gene.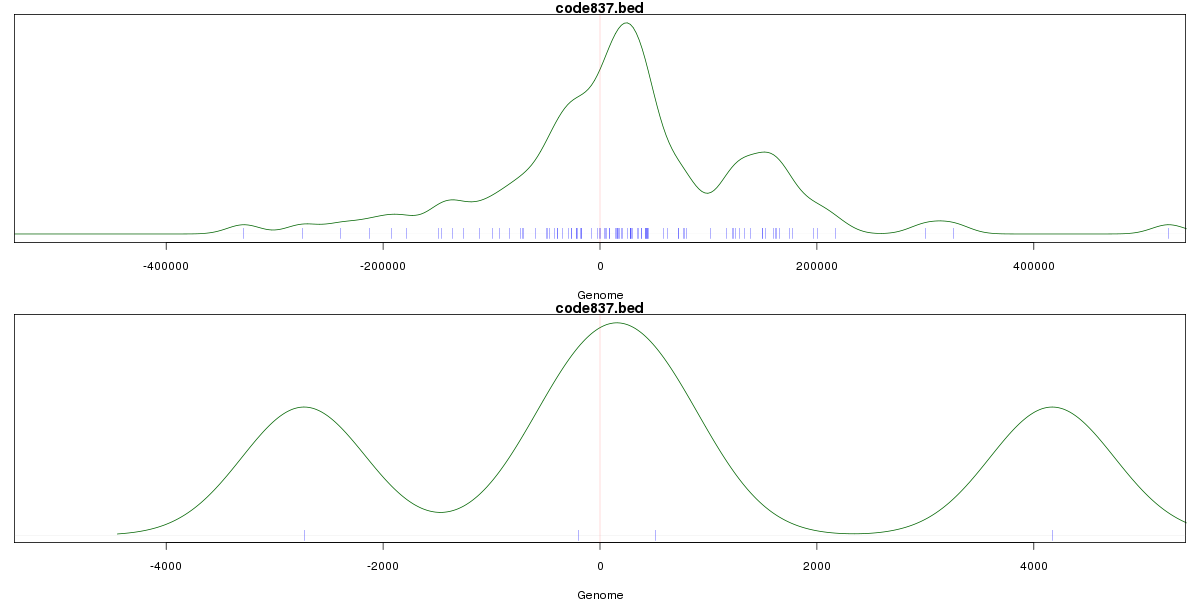
Stats
Number of sites: 406Promoter: 1%
CpG-Island: 0%
Conserved: 33%
Enriched Motifs & Matches
Match Detail: [Jaspar]
|
| ||
|---|---|---|
| Sites: 64/100 | e-val: 9.4e-19 | ||
| Factor | e-val(match) | DB |
| FEV | 0.00000016625 | JASPAR |
| SPI1 | 0.0000022227 | JASPAR |
| ELF5 | 0.000009939 | JASPAR |
| RELA | 0.0018881 | JASPAR |
| EWSR1-FLI1 | 0.0019895 | JASPAR |