SOM cluster: 867
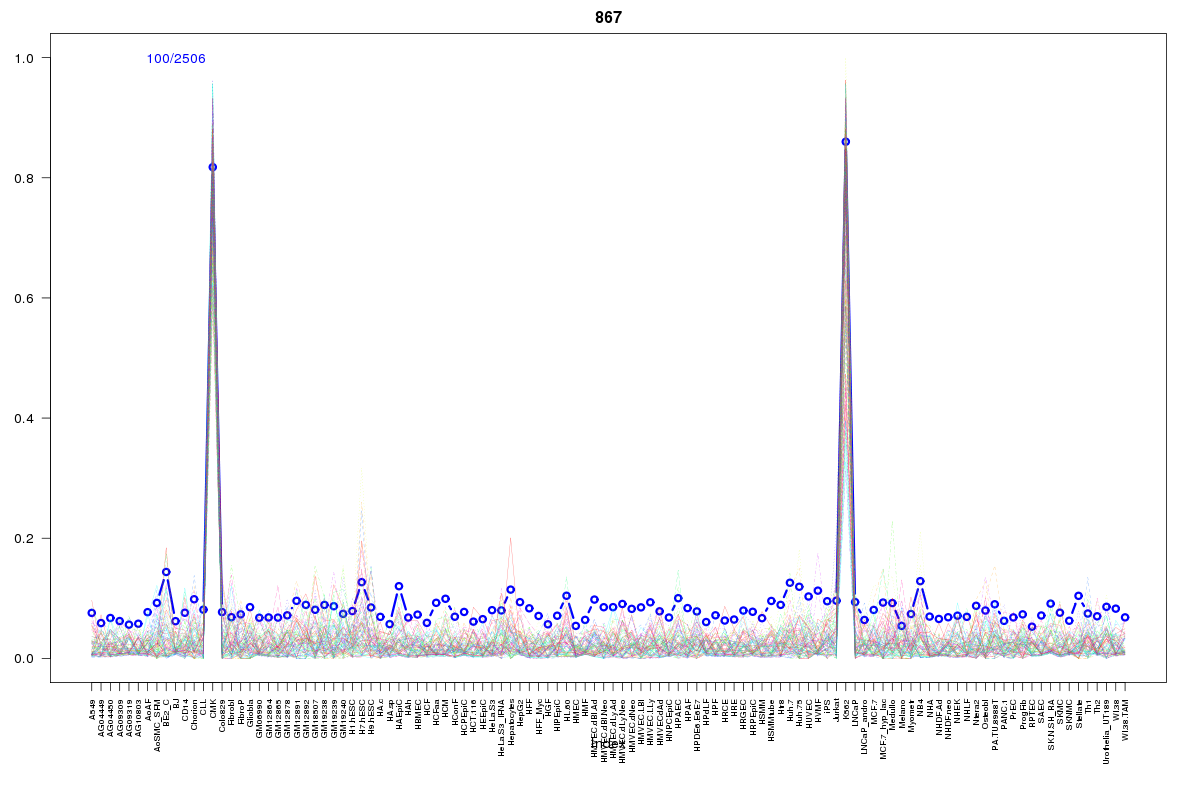
Cluster Hypersensitivity Profile

Genomic Location Trend
These plots show the distribution of the DHS sites surrounding the Transcript Start Site of the nearest gene.
Stats
Number of sites: 2506Promoter: 3%
CpG-Island: 0%
Conserved: 21%
Enriched Motifs & Matches
Match Detail: [Jaspar]
|
| ||
|---|---|---|
| Sites: 30/100 | e-val: 0.01 | ||
| Factor | e-val(match) | DB |
| Evi1 | 0.0000015214 | JASPAR |
| Tal1::Gata1 | 0.000005057 | JASPAR |
| Gata1 | 0.000011354 | JASPAR |
| GATA2 | 0.0092009 | JASPAR |
| NR3C1 | 0.013526 | JASPAR |
|
| ||
| Sites: 17/100 | e-val: 0.00045 | ||
| Factor | e-val(match) | DB |
| Pax4 | 0.0000022689 | JASPAR |
| EWSR1-FLI1 | 0.00012061 | JASPAR |
| SP1 | 0.00016517 | JASPAR |
| MZF1_5-13 | 0.00018345 | JASPAR |
| RREB1 | 0.00065307 | JASPAR |