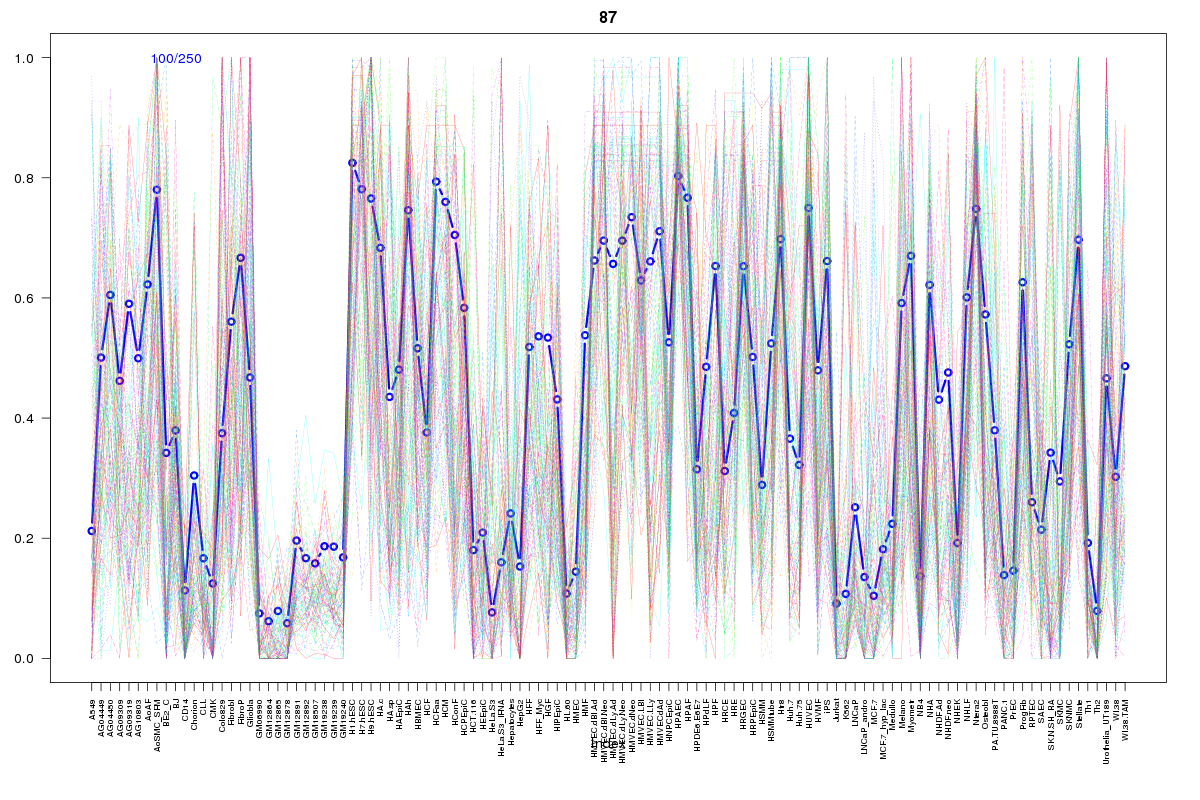
SOM cluster: 87
Cluster Hypersensitivity Profile

Genomic Location Trend
These plots show the distribution of the DHS sites surrounding the Transcript Start Site of the nearest gene.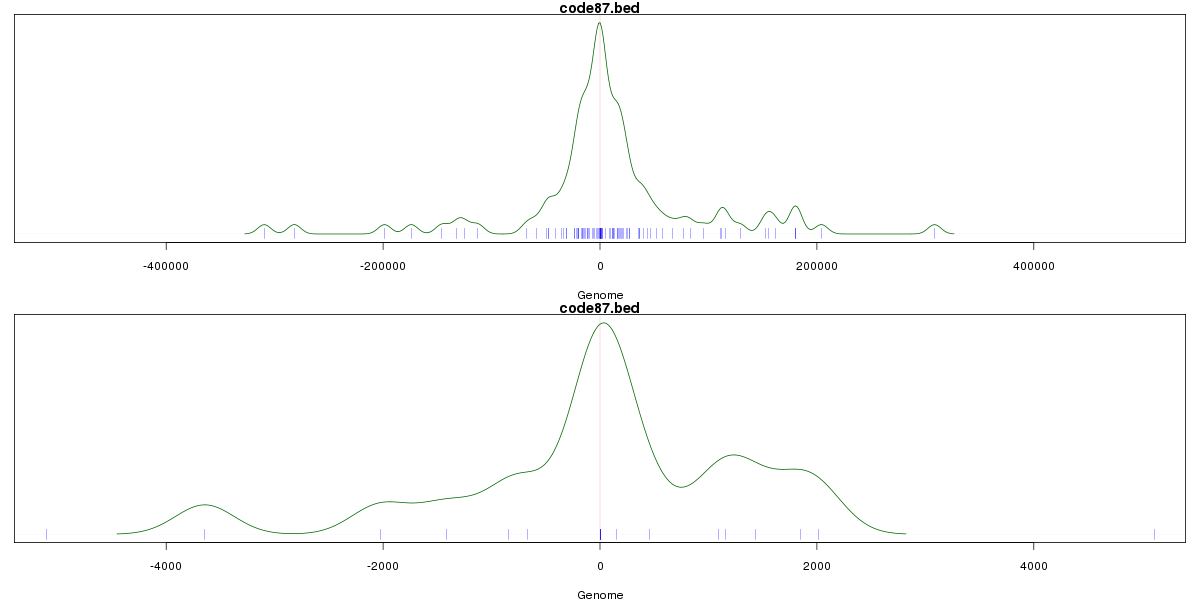
Stats
Number of sites: 250Promoter: 9%
CpG-Island: 5%
Conserved: 74%
Enriched Motifs & Matches
Match Detail: [Jaspar]
|
| ||
|---|---|---|
| Sites: 47/100 | e-val: 7e-25 | ||
| Factor | e-val(match) | DB |
| EWSR1-FLI1 | 0.0000000069172 | JASPAR |
| SP1 | 0.0000042563 | JASPAR |
| Pax4 | 0.00022332 | JASPAR |
| SPI1 | 0.0023941 | JASPAR |
| SPIB | 0.025023 | JASPAR |
|
| ||
| Sites: 37/100 | e-val: 0.00000055 | ||
| Factor | e-val(match) | DB |
| FEV | 0.000012397 | JASPAR |
| Stat3 | 0.00016478 | JASPAR |
| SPIB | 0.00019883 | JASPAR |
| TEAD1 | 0.00023912 | JASPAR |
| SPI1 | 0.00050286 | JASPAR |
|
| ||
| Sites: 23/100 | e-val: 0.26 | ||
| Factor | e-val(match) | DB |
| Tal1::Gata1 | 0.00000012318 | JASPAR |
| SP1 | 0.000024121 | JASPAR |
| Klf4 | 0.00040037 | JASPAR |
| Pax4 | 0.0086149 | JASPAR |
| MZF1_5-13 | 0.012453 | JASPAR |
BED file downloads
Top 10 Example Regions
| Location | Gene Link | Dist. |
|---|---|---|
| chr1: 148931140-148931290 | RP11-14N7.2 | 17.18 |
| chr1: 148931140-148931290 | DRD5P2 | 17.18 |
| chr12: 89743780-89743930 | DUSP6 | 32.74 |
| chr15: 96897220-96897370 | NR2F2-AS1 | 34.95 |
| chr15: 96897220-96897370 | RP11-522B15.3 | 34.95 |
| chr15: 96897220-96897370 | NR2F2 | 34.95 |
| chr1: 85810060-85810210 | BCL10 | 41.82 |
| chr1: 85810060-85810210 | DDAH1 | 41.82 |
| chr2: 75788080-75788230 | EVA1A | 48.79 |
| chr2: 75788080-75788230 | U3 | 48.79 |