SOM cluster: 871
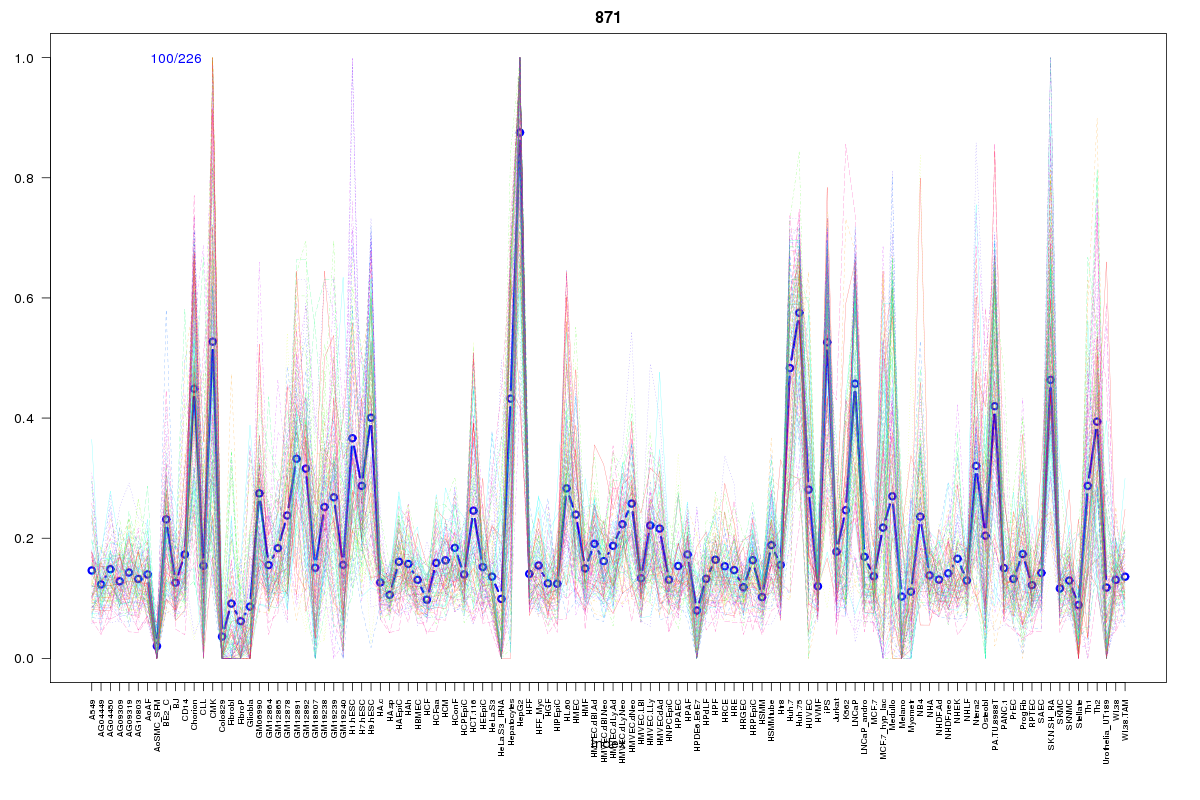
Cluster Hypersensitivity Profile

Genomic Location Trend
These plots show the distribution of the DHS sites surrounding the Transcript Start Site of the nearest gene.
Stats
Number of sites: 226Promoter: 37%
CpG-Island: 84%
Conserved: 76%
Enriched Motifs & Matches
Match Detail: [Jaspar]
|
| ||
|---|---|---|
| Sites: 94/100 | e-val: 0 | ||
| Factor | e-val(match) | DB |
| SP1 | 0.000000040179 | JASPAR |
| TFAP2A | 0.000052701 | JASPAR |
| PLAG1 | 0.00093388 | JASPAR |
| Klf4 | 0.0014824 | JASPAR |
| Egr1 | 0.001671 | JASPAR |
|
| ||
| Sites: 70/100 | e-val: 6.4e-28 | ||
| Factor | e-val(match) | DB |
| TFAP2A | 0.0000096341 | JASPAR |
| SP1 | 0.00011109 | JASPAR |
| MZF1_1-4 | 0.0050727 | JASPAR |
| RREB1 | 0.015896 | JASPAR |
| Klf4 | 0.024932 | JASPAR |
BED file downloads
Top 10 Example Regions
| Location | Gene Link | Dist. |
|---|---|---|
| chr1: 169075185-169075335 | RP5-1018K9.1 | 27.6 |
| chr17: 79791580-79791730 | P4HB | 40.45 |
| chr8: 121824440-121824590 | SNTB1 | 45.75 |
| chr6: 36098345-36098495 | MAPK13 | 49.45 |
| chr1: 1368885-1369035 | ATAD3C | 53.56 |
| chr17: 40827485-40827635 | EZH1 | 54.01 |
| chr8: 37699505-37699655 | RAB11FIP1 | 54.15 |
| chr3: 50298205-50298355 | TUSC2 | 54.36 |
| chr17: 14212485-14212635 | HS3ST3B1 | 57.49 |
| chr11: 72301165-72301315 | AP005019.4 | 58.79 |