SOM cluster: 872
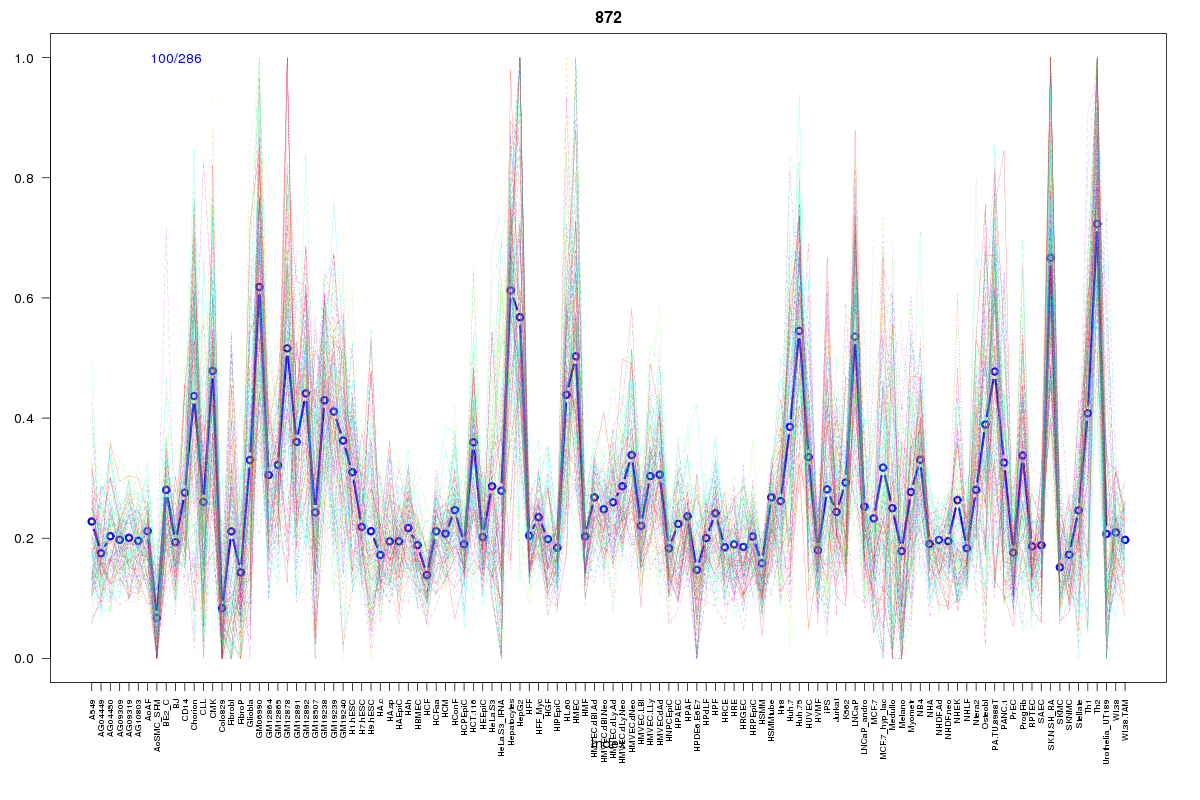
Cluster Hypersensitivity Profile

Genomic Location Trend
These plots show the distribution of the DHS sites surrounding the Transcript Start Site of the nearest gene.
Stats
Number of sites: 286Promoter: 49%
CpG-Island: 84%
Conserved: 48%
Enriched Motifs & Matches
Match Detail: [Jaspar]
|
| ||
|---|---|---|
| Sites: 92/100 | e-val: 0 | ||
| Factor | e-val(match) | DB |
| SP1 | 0.000010237 | JASPAR |
| TFAP2A | 0.00070286 | JASPAR |
| PLAG1 | 0.0070068 | JASPAR |
| Egr1 | 0.017922 | JASPAR |
| Klf4 | 0.051147 | JASPAR |
|
| ||
| Sites: 81/100 | e-val: 0.00000000000054 | ||
| Factor | e-val(match) | DB |
| SP1 | 0.00076669 | JASPAR |
| TFAP2A | 0.0056909 | JASPAR |
| Zfx | 0.066267 | JASPAR |
| CTCF | 0.075971 | JASPAR |
| PLAG1 | 0.087744 | JASPAR |
BED file downloads
Top 10 Example Regions
| Location | Gene Link | Dist. |
|---|---|---|
| chr11: 1784725-1784875 | AP006285.1 | 44.33 |
| chr11: 1784725-1784875 | LSP1 | 44.33 |
| chr11: 1784725-1784875 | IFITM10 | 44.33 |
| chr22: 20308020-20308170 | PI4KAP1 | 44.93 |
| chr19: 50381425-50381575 | NUP62 | 57.35 |
| chr5: 139090220-139090370 | CXXC5 | 58.91 |
| chr3: 13520920-13521070 | AC027124.2 | 62.46 |
| chr16: 87426580-87426730 | RP11-178L8.4 | 63.11 |
| chr15: 75747840-75747990 | PTPN9 | 63.51 |
| chr2: 128615360-128615510 | AMMECR1L | 64.89 |