SOM cluster: 897
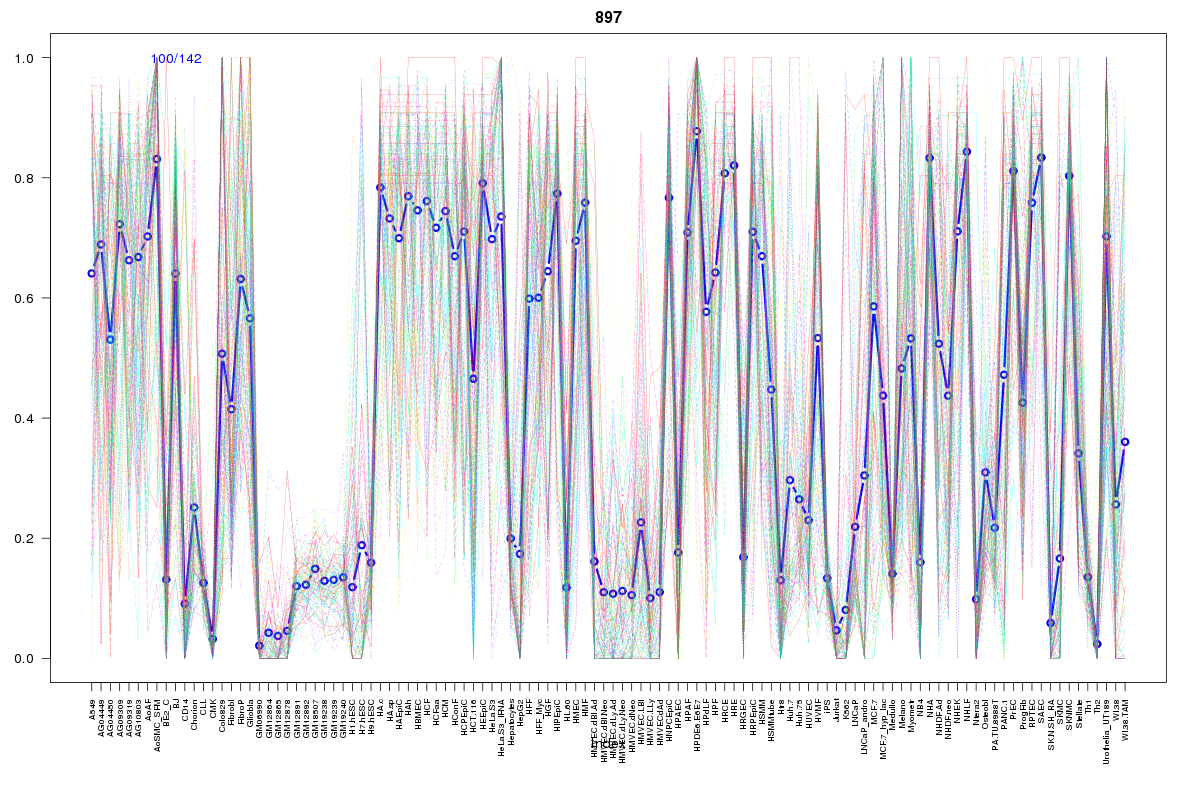
Cluster Hypersensitivity Profile

Genomic Location Trend
These plots show the distribution of the DHS sites surrounding the Transcript Start Site of the nearest gene.
Stats
Number of sites: 142Promoter: 3%
CpG-Island: 0%
Conserved: 47%
Enriched Motifs & Matches
Match Detail: [Jaspar]
|
| ||
|---|---|---|
| Sites: 47/100 | e-val: 3.9e-17 | ||
| Factor | e-val(match) | DB |
| AP1 | 0.00000000064859 | JASPAR |
| NFE2L2 | 0.0000010141 | JASPAR |
| PBX1 | 0.0072882 | JASPAR |
| NFE2L1::MafG | 0.013447 | JASPAR |
| Pax6 | 0.023415 | JASPAR |
BED file downloads
Top 10 Example Regions
| Location | Gene Link | Dist. |
|---|---|---|
| chr8: 126537680-126537830 | RP11-136O12.2 | 39.09 |
| chr14: 27311240-27311390 | RP11-384J4.1 | 48.08 |
| chr6: 1335720-1335870 | FOXF2 | 49.22 |
| chr6: 1335720-1335870 | FOXQ1 | 49.22 |
| chr1: 209572080-209572230 | RP11-372M18.2 | 57.28 |
| chr15: 92411040-92411190 | SLCO3A1 | 60.95 |
| chr11: 112192620-112192770 | PTS | 62.59 |
| chr11: 112192620-112192770 | RPS6P16 | 62.59 |
| chr9: 88742100-88742250 | GOLM1 | 62.83 |
| chr9: 87466940-87467090 | NTRK2 | 63.82 |