SOM cluster: 90
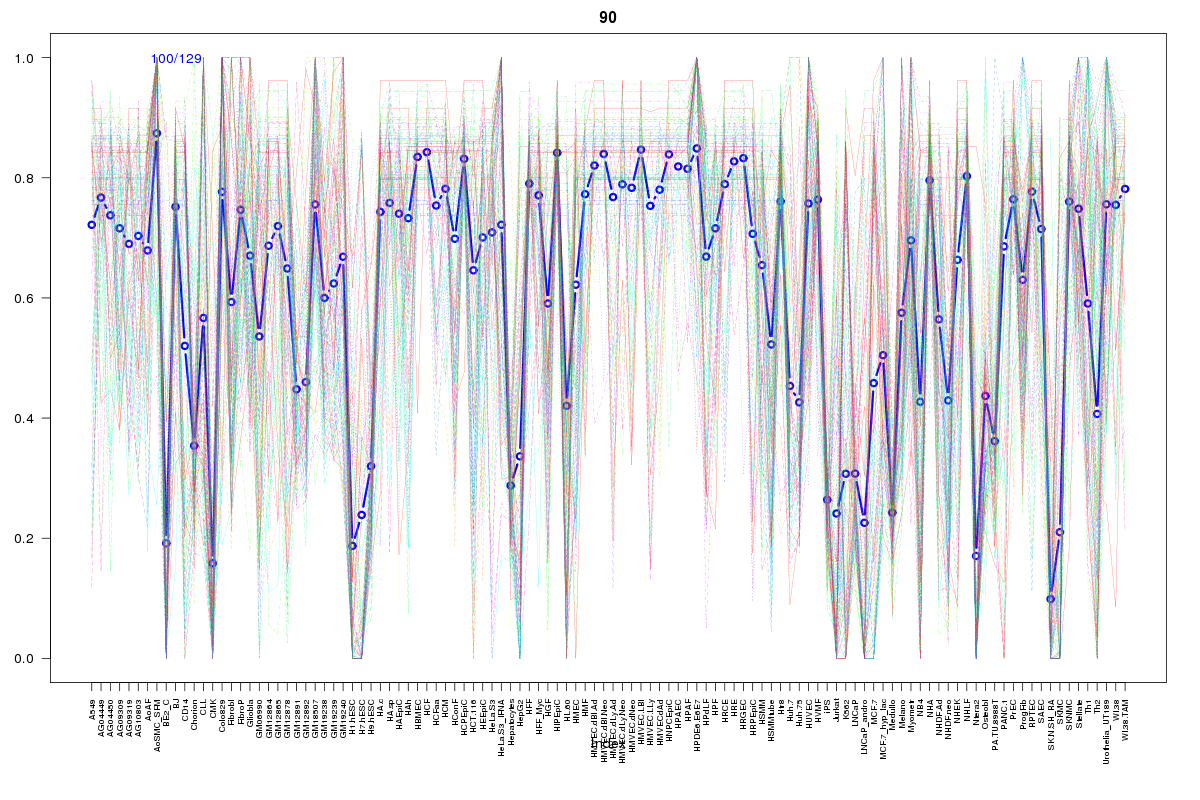
Cluster Hypersensitivity Profile

Genomic Location Trend
These plots show the distribution of the DHS sites surrounding the Transcript Start Site of the nearest gene.
Stats
Number of sites: 129Promoter: 6%
CpG-Island: 2%
Conserved: 61%
Enriched Motifs & Matches
Match Detail: [Jaspar]
|
| ||
|---|---|---|
| Sites: 47/100 | e-val: 4.3e-25 | ||
| Factor | e-val(match) | DB |
| AP1 | 0.0000000001866 | JASPAR |
| NFE2L2 | 0.00000000062981 | JASPAR |
| NFE2L1::MafG | 0.0001212 | JASPAR |
| PBX1 | 0.00083118 | JASPAR |
| Pax6 | 0.011697 | JASPAR |
|
| ||
| Sites: 24/100 | e-val: 0.0000021 | ||
| Factor | e-val(match) | DB |
| Foxd3 | 0.0023951 | JASPAR |
| FOXI1 | 0.0034852 | JASPAR |
| MEF2A | 0.011314 | JASPAR |
| Foxq1 | 0.01191 | JASPAR |
| Prrx2 | 0.012782 | JASPAR |
BED file downloads
Top 10 Example Regions
| Location | Gene Link | Dist. |
|---|---|---|
| chr1: 198904760-198904910 | MIR181B1 | 31.51 |
| chr1: 198904760-198904910 | MIR181A1HG | 31.51 |
| chr1: 198904760-198904910 | MIR181A1 | 31.51 |
| chr10: 17258205-17258355 | RP11-124N14.3 | 32.04 |
| chr10: 17258205-17258355 | VIM | 32.04 |
| chrX: 13687480-13687630 | RAB9A | 43.49 |
| chr18: 57572100-57572250 | RN7SL342P | 47.19 |
| chr12: 10874480-10874630 | YBX3 | 49.46 |
| chr12: 76849620-76849770 | OSBPL8 | 54.98 |
| chr9: 129811460-129811610 | ANGPTL2 | 57.08 |