SOM cluster: 903
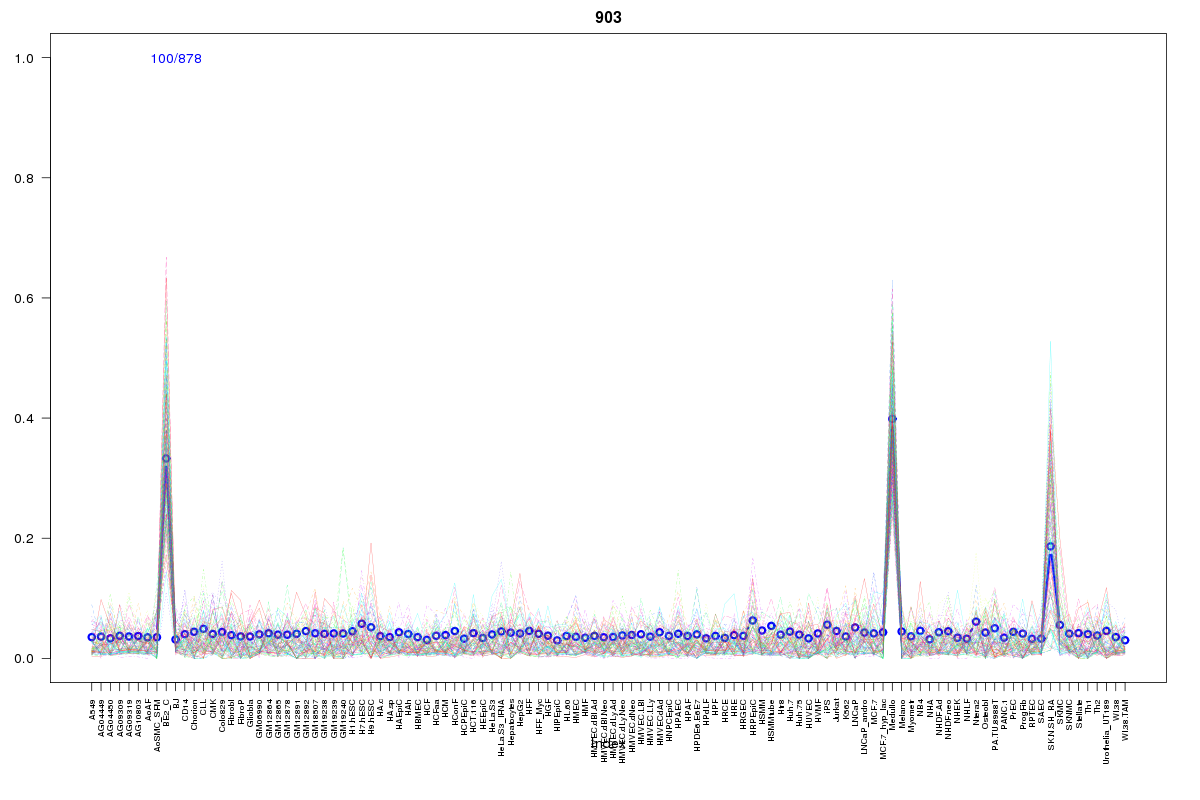
Cluster Hypersensitivity Profile

Genomic Location Trend
These plots show the distribution of the DHS sites surrounding the Transcript Start Site of the nearest gene.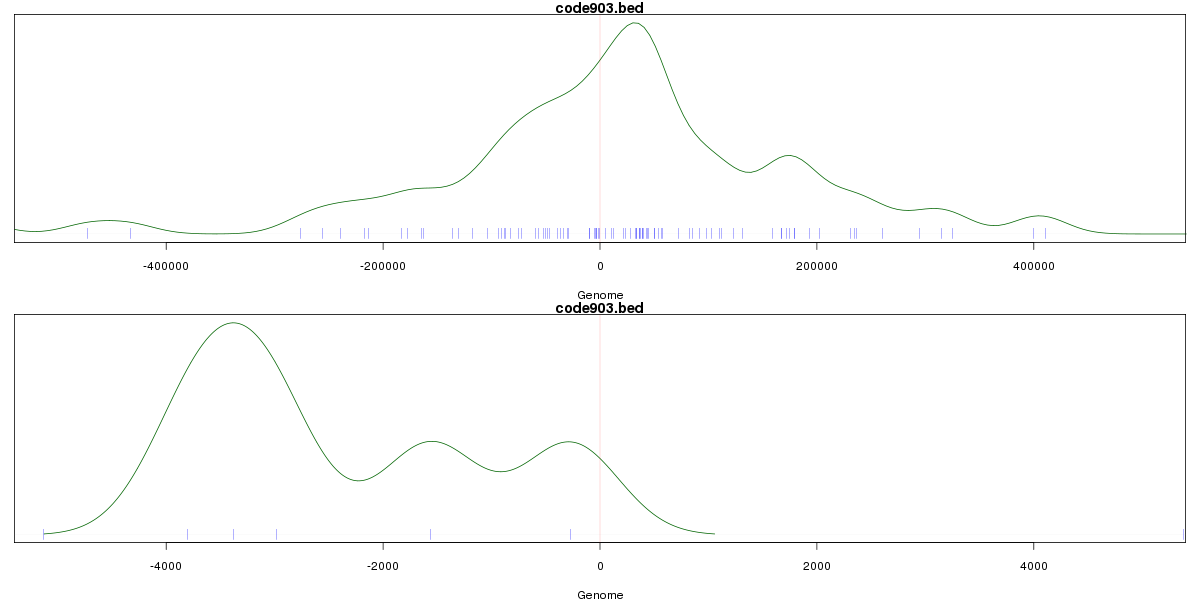
Stats
Number of sites: 878Promoter: 2%
CpG-Island: 0%
Conserved: 51%
Enriched Motifs & Matches
Match Detail: [Jaspar]
|
| ||
|---|---|---|
| Sites: 33/100 | e-val: 0.00031 | ||
| Factor | e-val(match) | DB |
| Nkx2-5 | 0.0016168 | JASPAR |
| Prrx2 | 0.0037587 | JASPAR |
| Lhx3 | 0.011945 | JASPAR |
| Evi1 | 0.015415 | JASPAR |
| ARID3A | 0.022231 | JASPAR |
BED file downloads
Top 10 Example Regions
| Location | Gene Link | Dist. |
|---|---|---|
| chr21: 34121300-34121450 | PAXBP1-AS1 | 45.01 |
| chr1: 179786665-179786815 | FAM163A | 47.25 |
| chr1: 179786665-179786815 | RP11-12M5.4 | 47.25 |
| chr1: 169056080-169056230 | ATP1B1 | 49.03 |
| chr8: 10511460-10511610 | SOX7 | 53.85 |
| chr8: 10511460-10511610 | RP1L1 | 53.85 |
| chr7: 107992720-107992870 | NRCAM | 54.39 |
| chr11: 115516345-115516495 | RP11-136I14.5 | 54.65 |
| chr1: 176737985-176738135 | ASTN1 | 58.53 |
| chr8: 140917360-140917510 | C8orf17 | 58.61 |