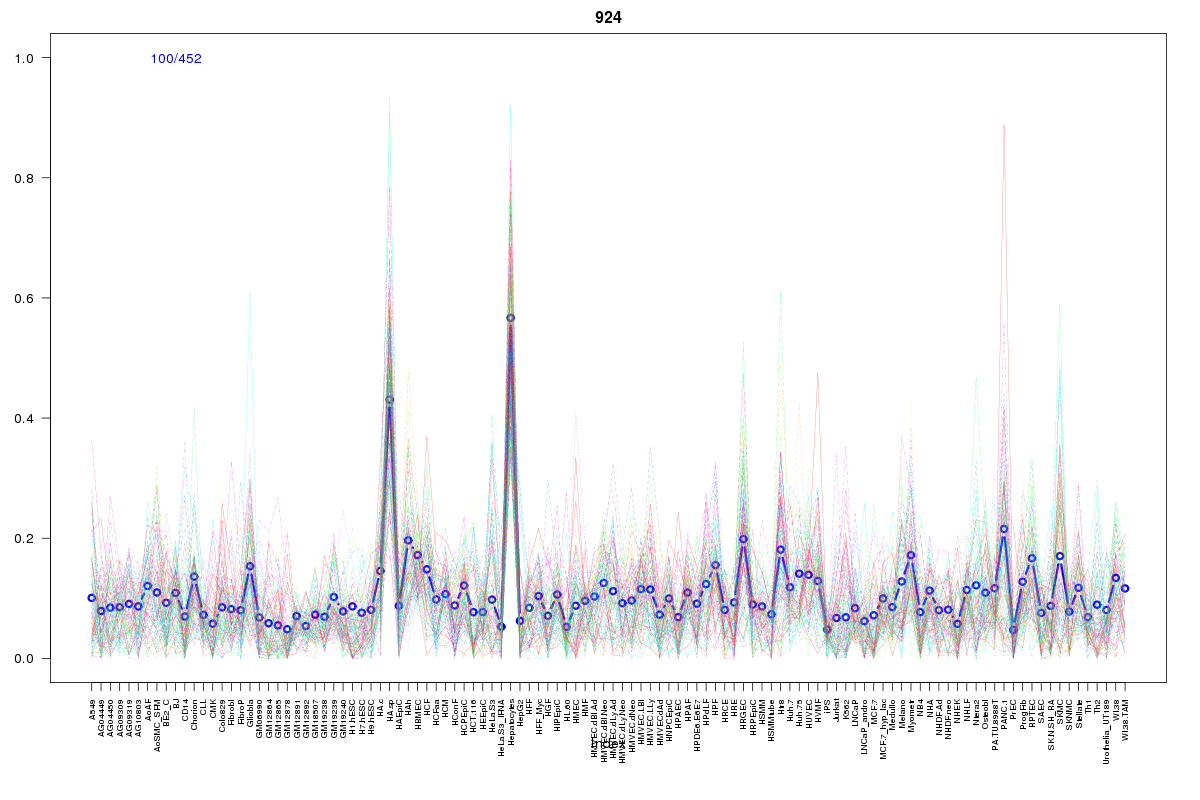
SOM cluster: 924
Cluster Hypersensitivity Profile

Genomic Location Trend
These plots show the distribution of the DHS sites surrounding the Transcript Start Site of the nearest gene.
Stats
Number of sites: 452Promoter: 25%
CpG-Island: 6%
Conserved: 60%
Enriched Motifs & Matches
Match Detail: [Jaspar]
|
| ||
|---|---|---|
| Sites: 71/100 | e-val: 4.2e-23 | ||
| Factor | e-val(match) | DB |
| Foxd3 | 0.0010981 | JASPAR |
| Pax4 | 0.001526 | JASPAR |
| MEF2A | 0.0015554 | JASPAR |
| FOXI1 | 0.012781 | JASPAR |
| NKX3-1 | 0.028213 | JASPAR |
BED file downloads
Top 10 Example Regions
| Location | Gene Link | Dist. |
|---|---|---|
| chr17: 15165125-15165275 | AC005703.3 | 36.07 |
| chr17: 15165125-15165275 | PMP22 | 36.07 |
| chr3: 27764965-27765115 | AC098973.2 | 39.14 |
| chr3: 33259340-33259490 | SUSD5 | 46.78 |
| chr16: 87524165-87524315 | ZCCHC14 | 56.34 |
| chr12: 117318340-117318490 | HRK | 56.53 |
| chr11: 31831205-31831355 | PAX6 | 57.06 |
| chr2: 101437785-101437935 | AC092168.2 | 61.57 |
| chr7: 90227005-90227155 | CDK14 | 61.71 |
| chr13: 108519165-108519315 | FAM155A | 64.21 |