SOM cluster: 925
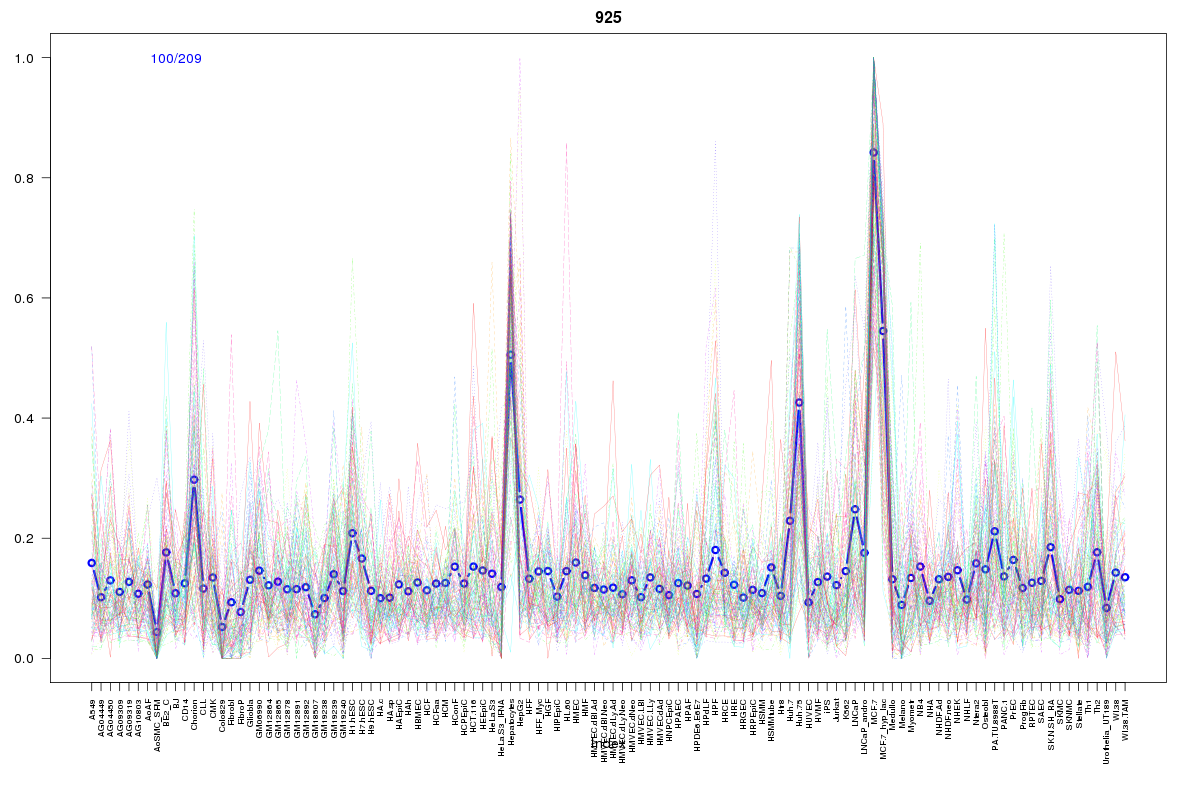
Cluster Hypersensitivity Profile

Genomic Location Trend
These plots show the distribution of the DHS sites surrounding the Transcript Start Site of the nearest gene.
Stats
Number of sites: 209Promoter: 22%
CpG-Island: 21%
Conserved: 37%
Enriched Motifs & Matches
Match Detail: [Jaspar]
|
| ||
|---|---|---|
| Sites: 56/100 | e-val: 7.3e-21 | ||
| Factor | e-val(match) | DB |
| SP1 | 0.00000092536 | JASPAR |
| EWSR1-FLI1 | 0.00028233 | JASPAR |
| Tal1::Gata1 | 0.0013438 | JASPAR |
| Pax4 | 0.0038912 | JASPAR |
| Klf4 | 0.0051285 | JASPAR |
|
| ||
| Sites: 23/100 | e-val: 0.011 | ||
| Factor | e-val(match) | DB |
| Tal1::Gata1 | 0.0019795 | JASPAR |
| SP1 | 0.0090127 | JASPAR |
| ZNF354C | 0.013107 | JASPAR |
| Myf | 0.019724 | JASPAR |
| Pax4 | 0.03274 | JASPAR |
|
| ||
| Sites: 17/100 | e-val: 0.021 | ||
| Factor | e-val(match) | DB |
| TP53 | 0.0017788 | JASPAR |
| Stat3 | 0.0021312 | JASPAR |
| EWSR1-FLI1 | 0.004214 | JASPAR |
| SP1 | 0.0048434 | JASPAR |
| FEV | 0.0058956 | JASPAR |
BED file downloads
Top 10 Example Regions
| Location | Gene Link | Dist. |
|---|---|---|
| chr11: 69294885-69295035 | AP000439.3 | 43.84 |
| chr11: 69294885-69295035 | AP000439.2 | 43.84 |
| chr8: 95654900-95655050 | ESRP1 | 44.52 |
| chr7: 1285205-1285355 | AC091729.9 | 48.79 |
| chr7: 1285205-1285355 | AC073094.4 | 48.79 |
| chr7: 1285205-1285355 | ZFAND2A | 48.79 |
| chr19: 39321685-39321835 | MRPS12 | 68.08 |
| chr19: 46381520-46381670 | FOXA3 | 70.12 |
| chr19: 50420220-50420370 | SIGLEC11 | 71.19 |
| chr19: 50420220-50420370 | U3 | 71.19 |