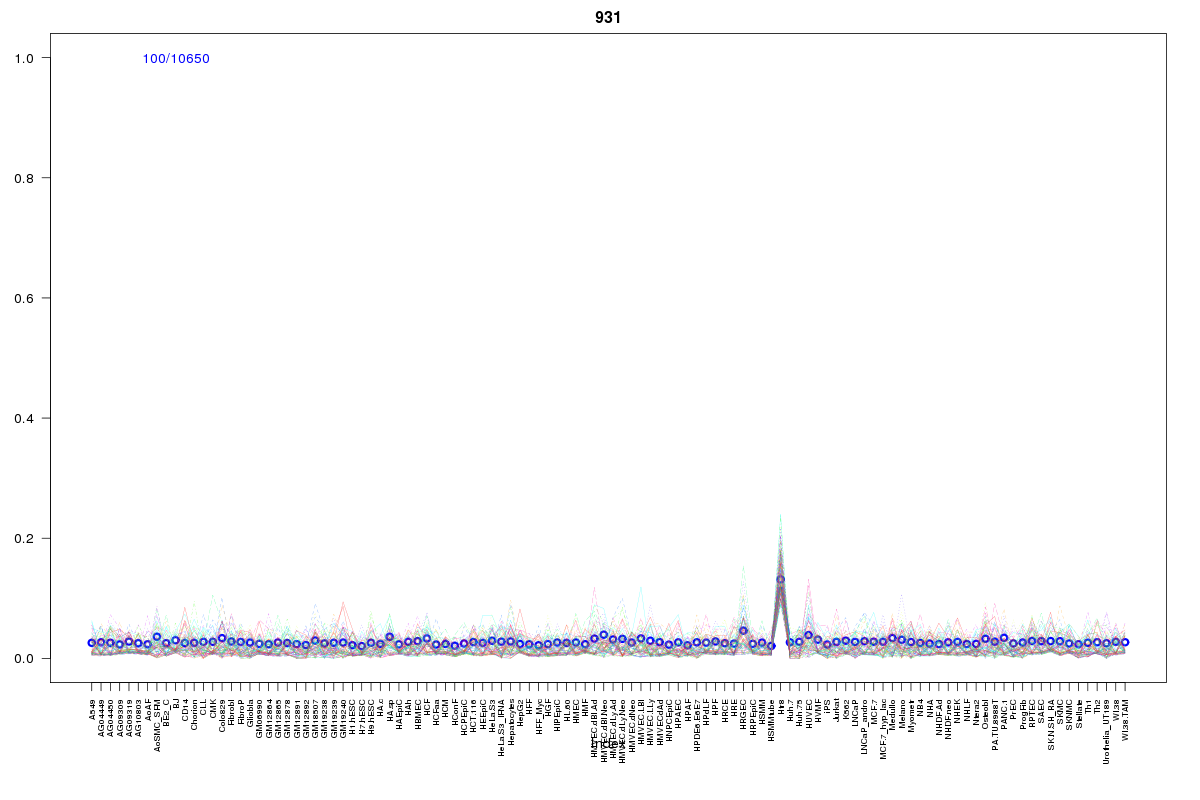
SOM cluster: 931
Cluster Hypersensitivity Profile

Genomic Location Trend
These plots show the distribution of the DHS sites surrounding the Transcript Start Site of the nearest gene.
Stats
Number of sites: 10650Promoter: 1%
CpG-Island: 0%
Conserved: 15%
Enriched Motifs & Matches
Match Detail: [Jaspar]
|
| ||
|---|---|---|
| Sites: 43/100 | e-val: 0.00000000000027 | ||
| Factor | e-val(match) | DB |
| Pax4 | 0.000000098644 | JASPAR |
| Foxd3 | 0.00041953 | JASPAR |
| HNF1A | 0.000906 | JASPAR |
| Pou5f1 | 0.0014678 | JASPAR |
| Lhx3 | 0.0027831 | JASPAR |
BED file downloads
Top 10 Example Regions
| Location | Gene Link | Dist. |
|---|---|---|
| chr5: 43504665-43504815 | CTD-2210P15.2 | 31.58 |
| chr5: 43504665-43504815 | NNT | 31.58 |
| chr3: 49988460-49988610 | MON1A | 37.65 |
| chr10: 32495025-32495175 | EPC1 | 40.92 |
| chr14: 58819825-58819975 | HMGB1P14 | 43.91 |
| chr12: 49299085-49299235 | RP11-386G11.3 | 44.64 |
| chr1: 60331745-60331895 | RP4-782L23.2 | 45.31 |
| chr9: 120056485-120056635 | ASTN2 | 46.1 |
| chr3: 33847680-33847830 | PDCD6IP | 47.03 |
| chr5: 65281485-65281635 | ERBB2IP | 47.24 |