SOM cluster: 941
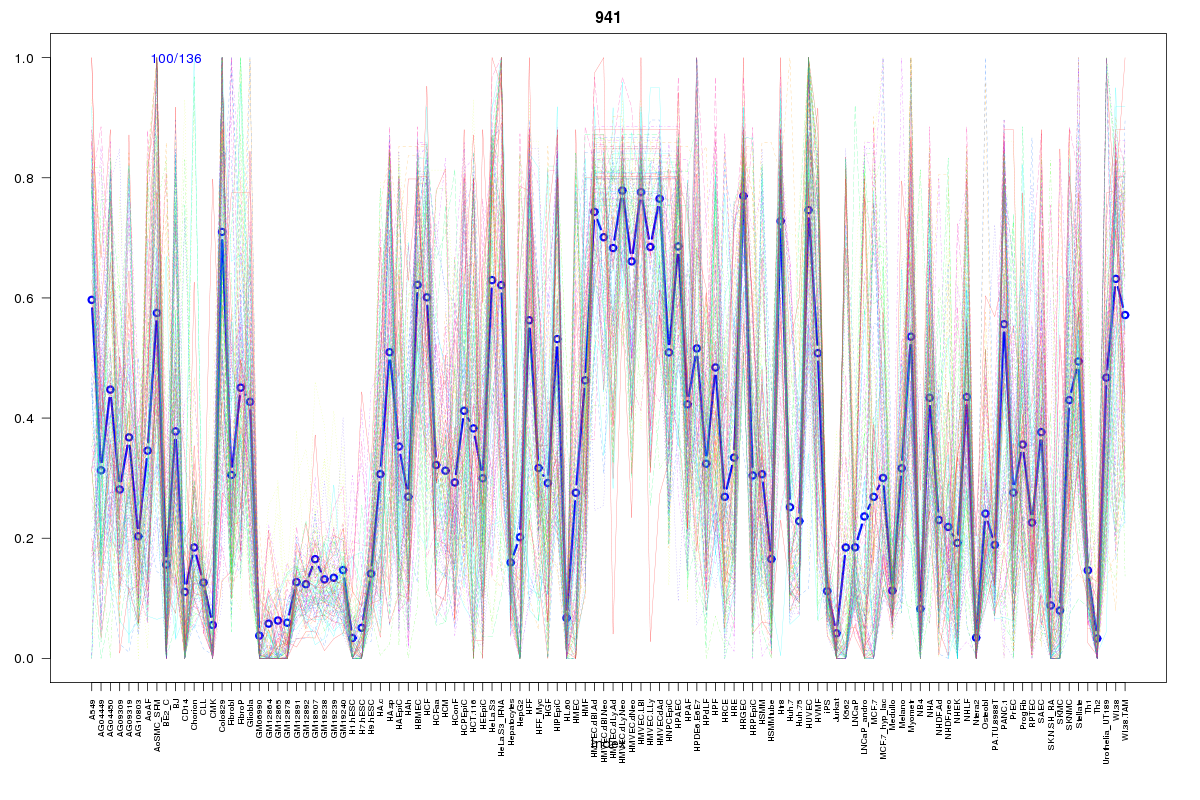
Cluster Hypersensitivity Profile

Genomic Location Trend
These plots show the distribution of the DHS sites surrounding the Transcript Start Site of the nearest gene.
Stats
Number of sites: 136Promoter: 5%
CpG-Island: 0%
Conserved: 60%
Enriched Motifs & Matches
Match Detail: [Jaspar]
|
| ||
|---|---|---|
| Sites: 58/100 | e-val: 2e-30 | ||
| Factor | e-val(match) | DB |
| NFE2L2 | 0.000000000056009 | JASPAR |
| AP1 | 0.000000002581 | JASPAR |
| NFE2L1::MafG | 0.001007 | JASPAR |
| Pax2 | 0.0036496 | JASPAR |
| PPARG | 0.0063706 | JASPAR |
|
| ||
| Sites: 28/100 | e-val: 0.12 | ||
| Factor | e-val(match) | DB |
| Foxd3 | 0.000030053 | JASPAR |
| HNF1B | 0.000054355 | JASPAR |
| SPIB | 0.000070644 | JASPAR |
| MEF2A | 0.00010102 | JASPAR |
| FOXI1 | 0.00022275 | JASPAR |
|
| ||
| Sites: 20/100 | e-val: 0.13 | ||
| Factor | e-val(match) | DB |
| Foxd3 | 0.0000000003029 | JASPAR |
| Foxq1 | 0.0000000032843 | JASPAR |
| FOXF2 | 0.00000031847 | JASPAR |
| FOXA1 | 0.0000058007 | JASPAR |
| FOXI1 | 0.0000065947 | JASPAR |
BED file downloads
Top 10 Example Regions
| Location | Gene Link | Dist. |
|---|---|---|
| chr2: 159395800-159395950 | PKP4 | 55.89 |
| chr17: 64563940-64564090 | PRKCA | 57.75 |
| chr18: 7922400-7922550 | PTPRM | 59.13 |
| chr1: 8772340-8772490 | RERE | 59.14 |
| chr9: 117566960-117567110 | TNFSF8 | 60.24 |
| chr9: 117566960-117567110 | TNFSF15 | 60.24 |
| chr11: 36031180-36031330 | LDLRAD3 | 61.18 |
| chr2: 11816260-11816410 | AC106875.1 | 62.94 |
| chr5: 159890860-159891010 | MIR146A | 63.6 |
| chr11: 110019620-110019770 | ZC3H12C | 64.03 |