SOM cluster: 944
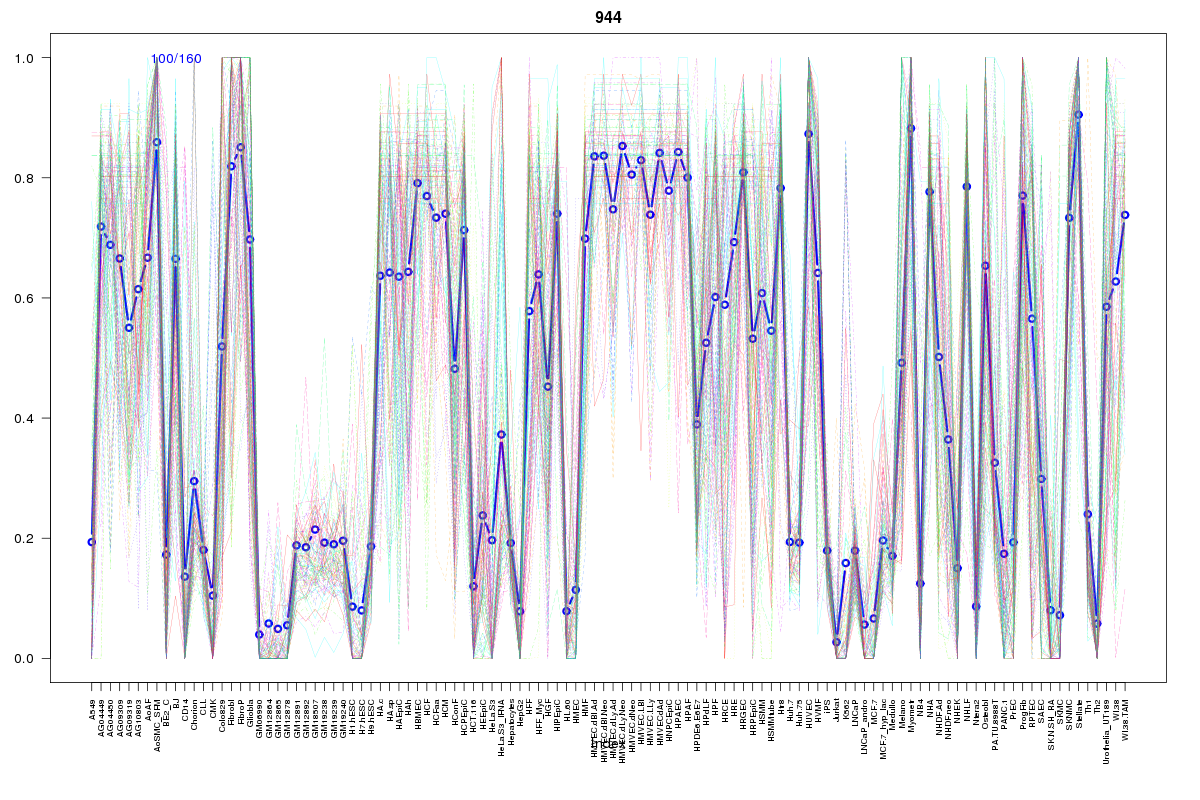
Cluster Hypersensitivity Profile

Genomic Location Trend
These plots show the distribution of the DHS sites surrounding the Transcript Start Site of the nearest gene.
Stats
Number of sites: 160Promoter: 0%
CpG-Island: 0%
Conserved: 58%
Enriched Motifs & Matches
Match Detail: [Jaspar]
|
| ||
|---|---|---|
| Sites: 20/100 | e-val: 0.00000091 | ||
| Factor | e-val(match) | DB |
| SPI1 | 0.0000052213 | JASPAR |
| AP1 | 0.0000098041 | JASPAR |
| FEV | 0.000020607 | JASPAR |
| NFE2L2 | 0.000070894 | JASPAR |
| ELF5 | 0.00037253 | JASPAR |
|
| ||
| Sites: 25/100 | e-val: 0.12 | ||
| Factor | e-val(match) | DB |
| FEV | 0.00000009947 | JASPAR |
| SPI1 | 0.000011104 | JASPAR |
| ELF5 | 0.000040382 | JASPAR |
| EWSR1-FLI1 | 0.000097225 | JASPAR |
| SPIB | 0.00076129 | JASPAR |
|
| ||
| Sites: 25/100 | e-val: 0.33 | ||
| Factor | e-val(match) | DB |
| AP1 | 0.00000000014255 | JASPAR |
| NFE2L2 | 0.0000000099704 | JASPAR |
| PPARG | 0.0037697 | JASPAR |
| NFE2L1::MafG | 0.0047519 | JASPAR |
| PBX1 | 0.0061017 | JASPAR |