SOM cluster: 95
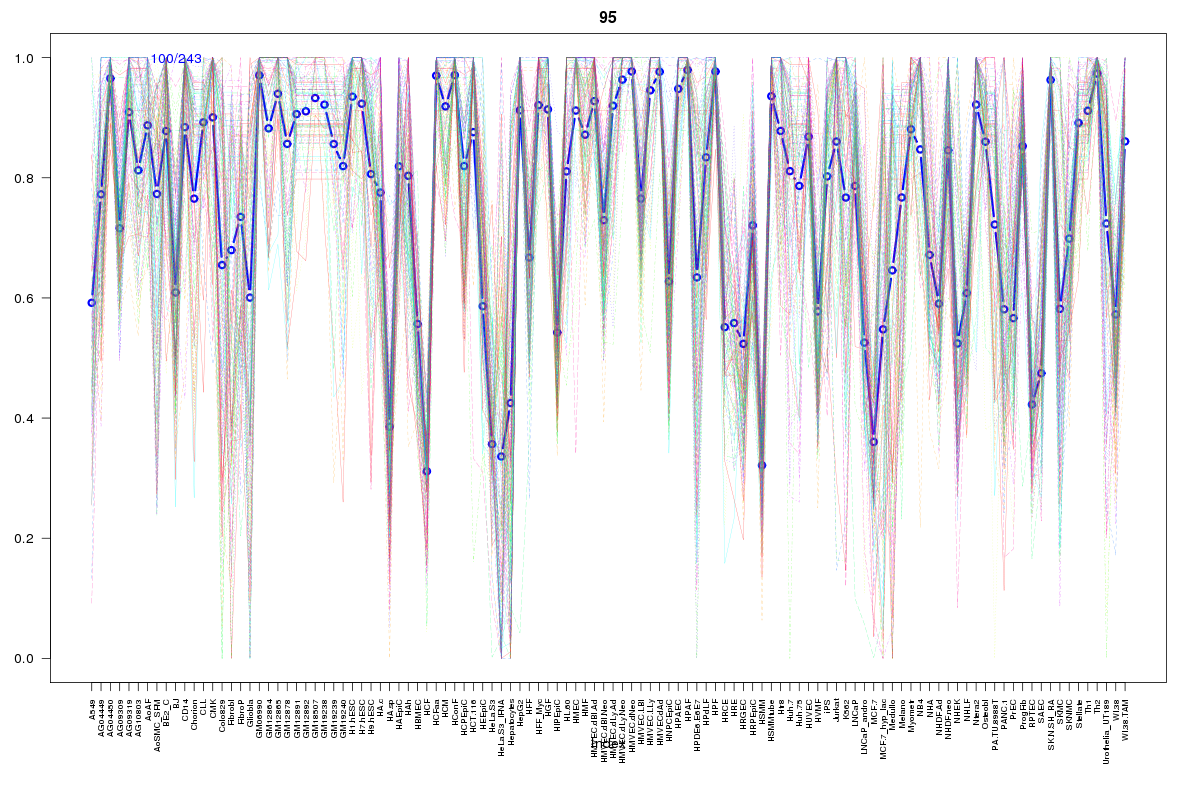
Cluster Hypersensitivity Profile

Genomic Location Trend
These plots show the distribution of the DHS sites surrounding the Transcript Start Site of the nearest gene.
Stats
Number of sites: 243Promoter: 80%
CpG-Island: 93%
Conserved: 87%
Enriched Motifs & Matches
Match Detail: [Jaspar]
|
| ||
|---|---|---|
| Sites: 91/100 | e-val: 0 | ||
| Factor | e-val(match) | DB |
| PLAG1 | 0.000011832 | JASPAR |
| SP1 | 0.000034278 | JASPAR |
| TFAP2A | 0.00098304 | JASPAR |
| Egr1 | 0.0077177 | JASPAR |
| Klf4 | 0.029556 | JASPAR |
|
| ||
| Sites: 77/100 | e-val: 9.99967e-42 | ||
| Factor | e-val(match) | DB |
| SP1 | 0.000000077835 | JASPAR |
| NFKB1 | 0.010822 | JASPAR |
| MZF1_1-4 | 0.012922 | JASPAR |
| Egr1 | 0.014663 | JASPAR |
| Klf4 | 0.017252 | JASPAR |
|
| ||
| Sites: 41/100 | e-val: 0.00000000063 | ||
| Factor | e-val(match) | DB |
| SP1 | 0.0000020321 | JASPAR |
| TFAP2A | 0.000010247 | JASPAR |
| Zfx | 0.041152 | JASPAR |
| TLX1::NFIC | 0.059962 | JASPAR |
| Klf4 | 0.086136 | JASPAR |