SOM cluster: 964
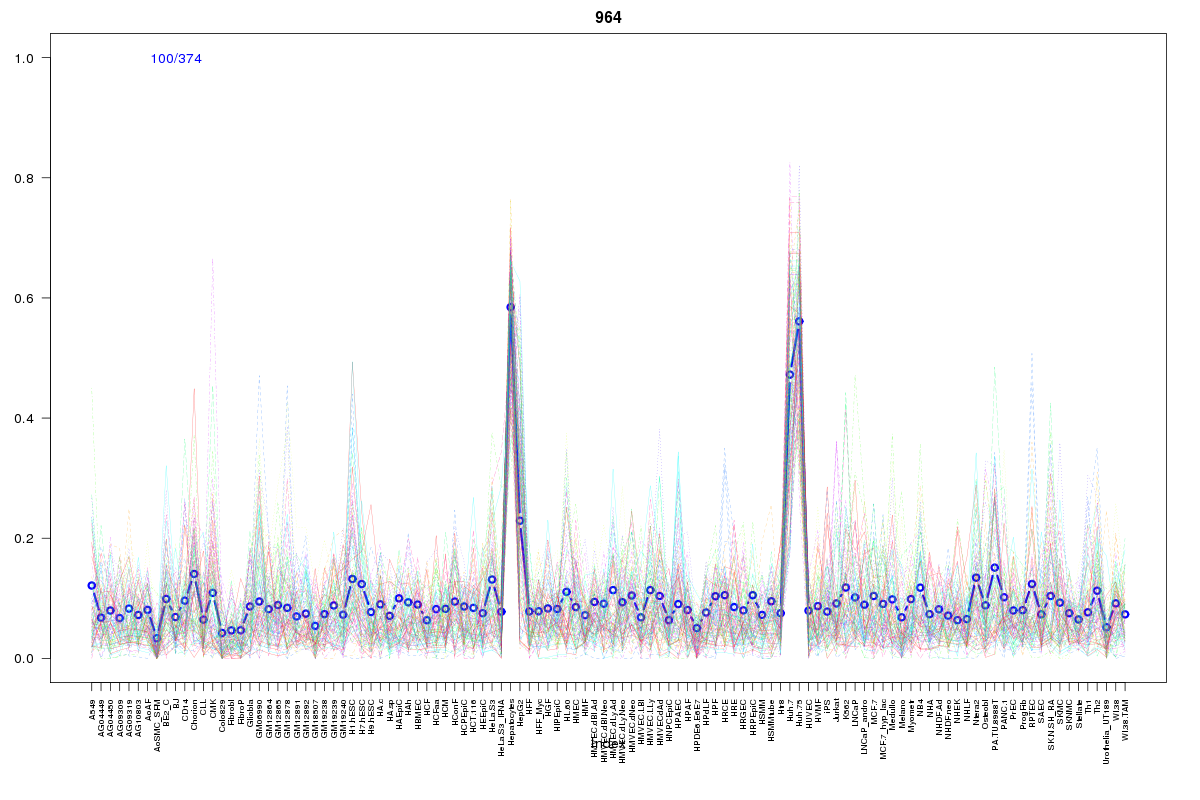
Cluster Hypersensitivity Profile

Genomic Location Trend
These plots show the distribution of the DHS sites surrounding the Transcript Start Site of the nearest gene.
Stats
Number of sites: 374Promoter: 11%
CpG-Island: 4%
Conserved: 25%
Enriched Motifs & Matches
Match Detail: [Jaspar]
|
| ||
|---|---|---|
| Sites: 38/100 | e-val: 0.0000000000015 | ||
| Factor | e-val(match) | DB |
| PPARG::RXRA | 0.0000000042134 | JASPAR |
| HNF4A | 0.0000015851 | JASPAR |
| SP1 | 0.0000034236 | JASPAR |
| NR2F1 | 0.000050654 | JASPAR |
| Pax4 | 0.0010243 | JASPAR |
|
| ||
| Sites: 19/100 | e-val: 0.023 | ||
| Factor | e-val(match) | DB |
| TFAP2A | 0.0033639 | JASPAR |
| REST | 0.0040965 | JASPAR |
| TEAD1 | 0.0090049 | JASPAR |
| TLX1::NFIC | 0.011634 | JASPAR |
| PLAG1 | 0.012539 | JASPAR |
|
| ||
| Sites: 28/100 | e-val: 0.00076 | ||
| Factor | e-val(match) | DB |
| SP1 | 0.00000000000035083 | JASPAR |
| INSM1 | 0.00001614 | JASPAR |
| Pax4 | 0.00081798 | JASPAR |
| Klf4 | 0.0041915 | JASPAR |
| MZF1_1-4 | 0.012826 | JASPAR |
BED file downloads
Top 10 Example Regions
| Location | Gene Link | Dist. |
|---|---|---|
| chr1: 1060065-1060215 | TNFRSF18 | 43.29 |
| chr1: 1060065-1060215 | TTLL10-AS1 | 43.29 |
| chr11: 70863665-70863815 | SHANK2 | 62.16 |
| chr12: 54381385-54381535 | HOXC9 | 63.46 |
| chr12: 54381385-54381535 | HOXC-AS1 | 63.46 |
| chr12: 54381385-54381535 | HOXC10 | 63.46 |
| chr12: 54381385-54381535 | HOXC-AS3 | 63.46 |
| chr12: 54381385-54381535 | HOXC8 | 63.46 |
| chr12: 54381385-54381535 | HOXC6 | 63.46 |
| chr12: 54381385-54381535 | HOXC12 | 63.46 |