SOM cluster: 968
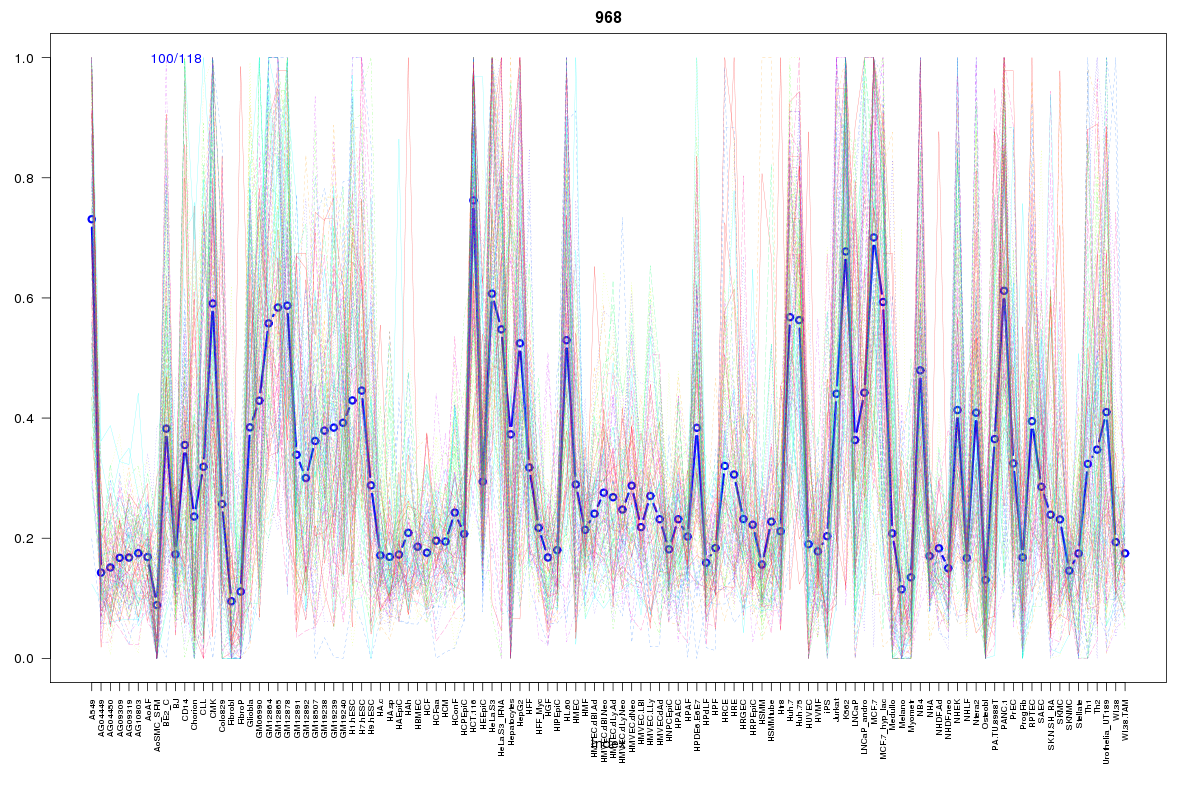
Cluster Hypersensitivity Profile

Genomic Location Trend
These plots show the distribution of the DHS sites surrounding the Transcript Start Site of the nearest gene.
Stats
Number of sites: 118Promoter: 33%
CpG-Island: 8%
Conserved: 33%
Enriched Motifs & Matches
No motifs found.BED file downloads
Top 10 Example Regions
| Location | Gene Link | Dist. |
|---|---|---|
| chr1: 149294240-149294390 | RP11-403I13.9 | 13.02 |
| chr1: 149294240-149294390 | RP11-403I13.8 | 13.02 |
| chr9: 131267585-131267735 | GLE1 | 37.64 |
| chr9: 131267585-131267735 | ODF2 | 37.64 |
| chr19: 55580860-55581010 | TNNT1 | 50.15 |
| chr19: 55580860-55581010 | EPS8L1 | 50.15 |
| chr19: 55580860-55581010 | DNAAF3 | 50.15 |
| chr19: 55580860-55581010 | RDH13 | 50.15 |
| chr20: 48533120-48533270 | SPATA2 | 61.54 |
| chr15: 91475300-91475450 | PRC1-AS1 | 62.54 |