SOM cluster: 975
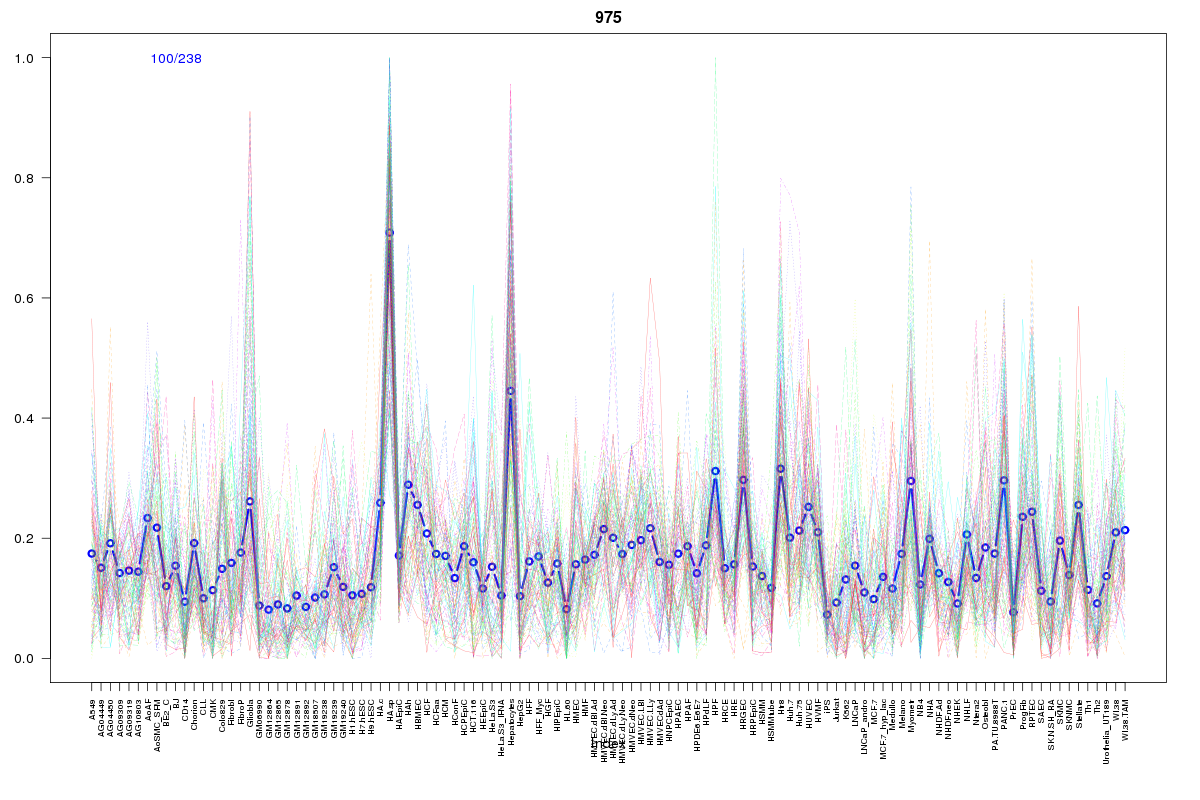
Cluster Hypersensitivity Profile

Genomic Location Trend
These plots show the distribution of the DHS sites surrounding the Transcript Start Site of the nearest gene.
Stats
Number of sites: 238Promoter: 30%
CpG-Island: 16%
Conserved: 67%
Enriched Motifs & Matches
Match Detail: [Jaspar]
|
| ||
|---|---|---|
| Sites: 44/100 | e-val: 0.00000000059 | ||
| Factor | e-val(match) | DB |
| ARID3A | 0.000057725 | JASPAR |
| Pax4 | 0.00057659 | JASPAR |
| Foxq1 | 0.0027549 | JASPAR |
| HNF1B | 0.0048998 | JASPAR |
| Foxd3 | 0.0064527 | JASPAR |
BED file downloads
Top 10 Example Regions
| Location | Gene Link | Dist. |
|---|---|---|
| chr4: 125631560-125631850 | ANKRD50 | 27.52 |
| chr4: 74904880-74905030 | CXCL2 | 39.85 |
| chr8: 32404645-32404795 | NRG1 | 53.17 |
| chr5: 124081660-124081810 | ZNF608 | 54.66 |
| chr11: 59323520-59323670 | PATL1 | 59.77 |
| chr10: 21807140-21807290 | MLLT10 | 61.19 |
| chr10: 21807140-21807290 | SKIDA1 | 61.19 |
| chr6: 13924365-13924515 | RNF182 | 61.91 |
| chr21: 46852825-46852975 | COL18A1 | 62.1 |
| chr11: 110167800-110167950 | RDX | 63.02 |