SOM cluster: 976
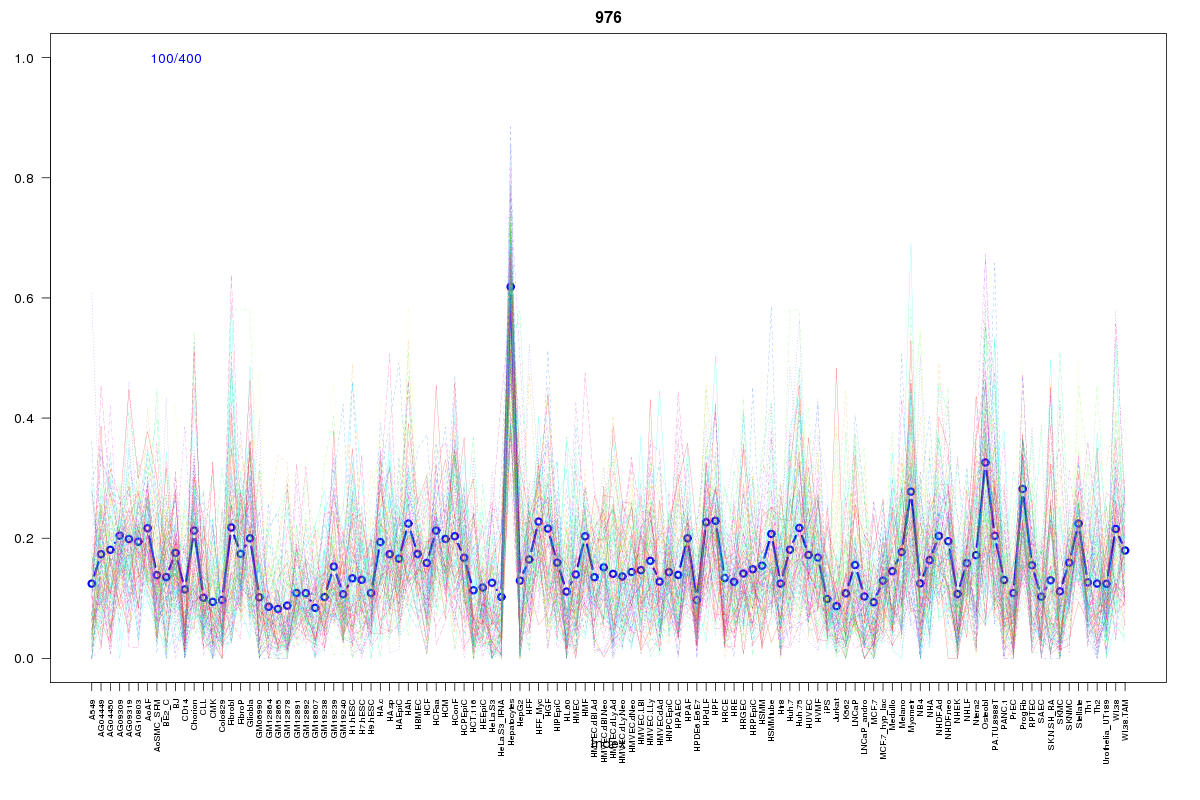
Cluster Hypersensitivity Profile

Genomic Location Trend
These plots show the distribution of the DHS sites surrounding the Transcript Start Site of the nearest gene.
Stats
Number of sites: 400Promoter: 26%
CpG-Island: 16%
Conserved: 38%
Enriched Motifs & Matches
Match Detail: [Jaspar]
|
| ||
|---|---|---|
| Sites: 30/100 | e-val: 0.014 | ||
| Factor | e-val(match) | DB |
| SP1 | 0.00000029175 | JASPAR |
| Klf4 | 0.0042933 | JASPAR |
| Pax4 | 0.0072233 | JASPAR |
| MZF1_5-13 | 0.019173 | JASPAR |
| Egr1 | 0.020461 | JASPAR |
BED file downloads
Top 10 Example Regions
| Location | Gene Link | Dist. |
|---|---|---|
| chr9: 110227745-110227895 | KLF4 | 45.63 |
| chr3: 50651740-50651890 | C3orf18 | 48.39 |
| chr3: 50651740-50651890 | MAPKAPK3 | 48.39 |
| chr19: 12905160-12905310 | DNASE2 | 50.84 |
| chr19: 12905160-12905310 | JUNB | 50.84 |
| chr19: 12905160-12905310 | RNASEH2A | 50.84 |
| chr18: 21243085-21243235 | Y_RNA | 50.84 |
| chr3: 133266765-133266915 | TOPBP1 | 52.55 |
| chr1: 26148265-26148415 | SEPN1 | 52.94 |
| chr1: 26148265-26148415 | RP1-317E23.6 | 52.94 |