SOM cluster: 977
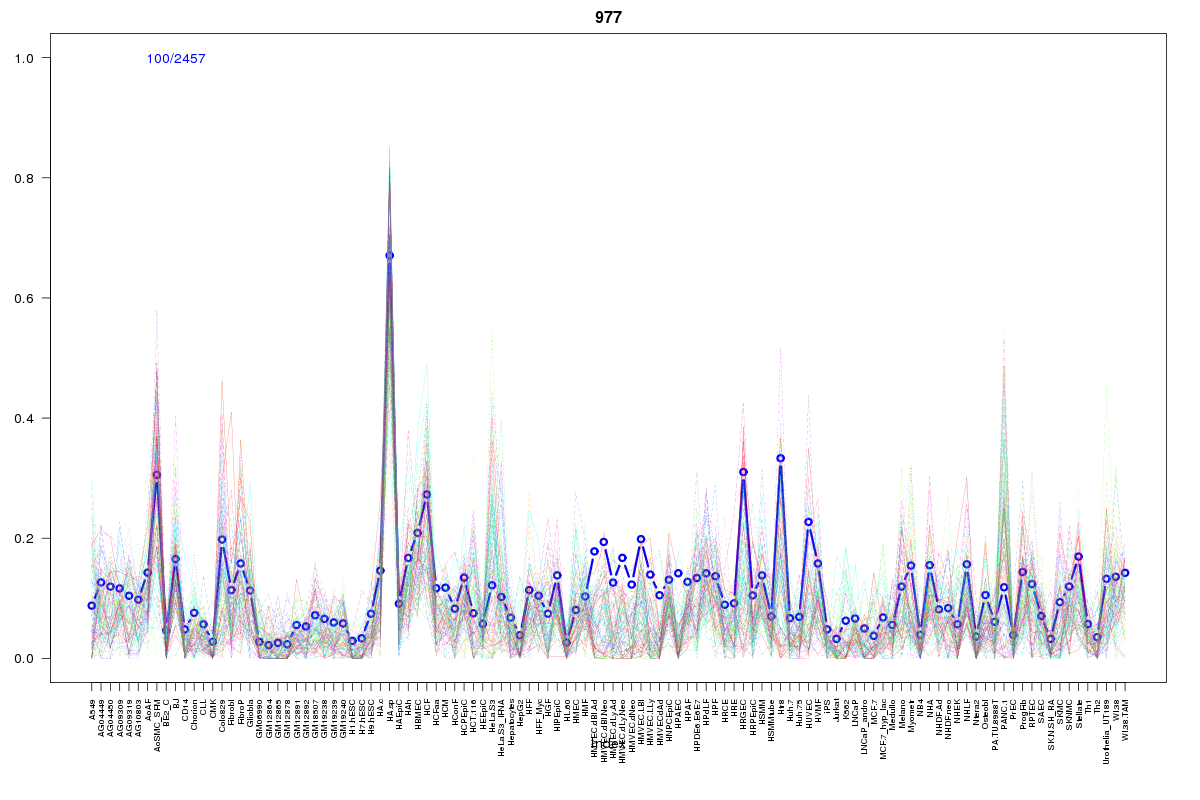
Cluster Hypersensitivity Profile

Genomic Location Trend
These plots show the distribution of the DHS sites surrounding the Transcript Start Site of the nearest gene.
Stats
Number of sites: 2457Promoter: 0%
CpG-Island: 0%
Conserved: 35%
Enriched Motifs & Matches
Match Detail: [Jaspar]
|
| ||
|---|---|---|
| Sites: 70/100 | e-val: 1.6e-34 | ||
| Factor | e-val(match) | DB |
| ARID3A | 0.0055436 | JASPAR |
| Prrx2 | 0.0086077 | JASPAR |
| NFATC2 | 0.011141 | JASPAR |
| MEF2A | 0.013361 | JASPAR |
| Nkx2-5 | 0.018861 | JASPAR |
|
| ||
| Sites: 44/100 | e-val: 0.0000033 | ||
| Factor | e-val(match) | DB |
| IRF1 | 0.00026221 | JASPAR |
| Foxd3 | 0.00042033 | JASPAR |
| MEF2A | 0.0024472 | JASPAR |
| SPIB | 0.0069558 | JASPAR |
| FOXA1 | 0.0069956 | JASPAR |
|
| ||
| Sites: 25/100 | e-val: 0.58 | ||
| Factor | e-val(match) | DB |
| znf143 | 0.0033837 | JASPAR |
| Lhx3 | 0.0054951 | JASPAR |
| HNF1B | 0.022155 | JASPAR |
| Foxd3 | 0.02778 | JASPAR |
| HOXA5 | 0.031287 | JASPAR |
BED file downloads
Top 10 Example Regions
| Location | Gene Link | Dist. |
|---|---|---|
| chr1: 150228600-150228750 | MRPS21 | 21.77 |
| chr1: 150228600-150228750 | PRPF3 | 21.77 |
| chr1: 150228600-150228750 | C1orf54 | 21.77 |
| chr7: 106413440-106413590 | RP5-884M6.1 | 35.24 |
| chr8: 42358540-42358690 | SLC20A2 | 38.93 |
| chr8: 54436780-54436930 | RP11-400K9.4 | 40.79 |
| chr10: 90734560-90734710 | STAMBPL1 | 41.67 |
| chr8: 19980100-19980250 | SLC18A1 | 41.94 |
| chr8: 94850365-94850515 | PDP1 | 42.2 |
| chr10: 16874460-16874610 | RSU1 | 42.36 |