SOM cluster: 984
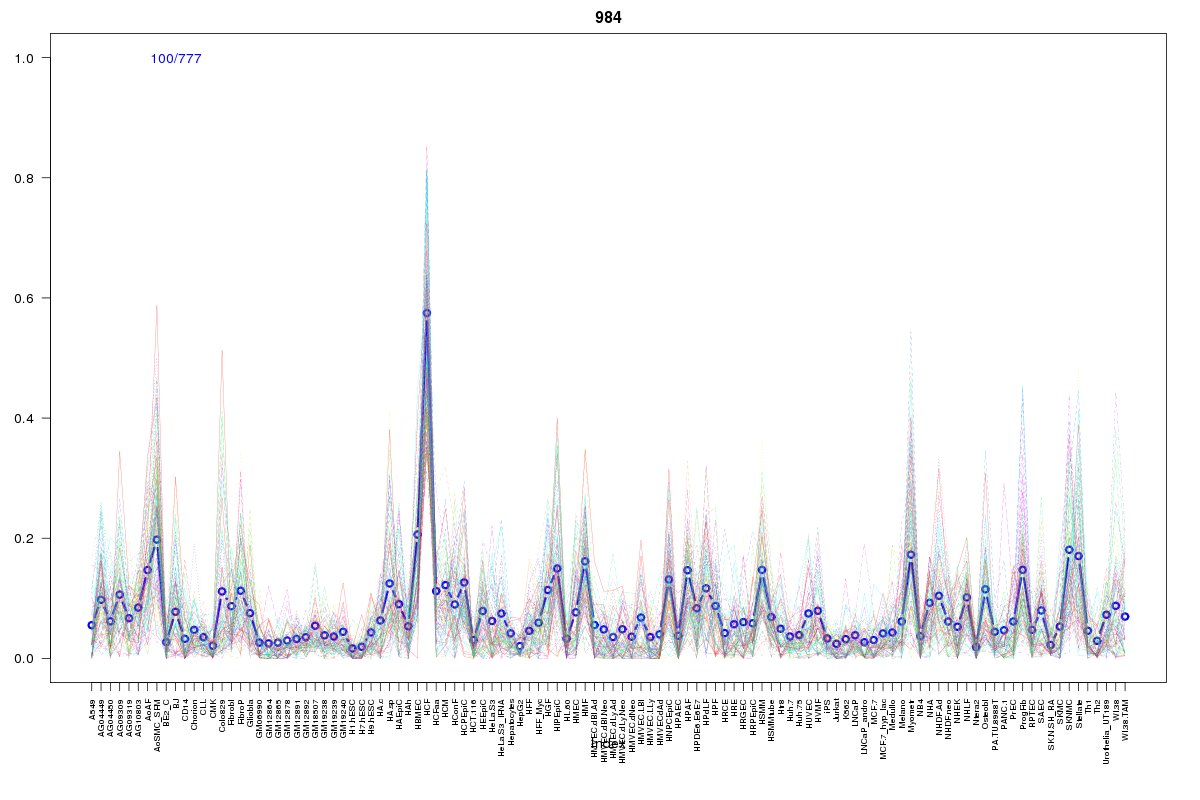
Cluster Hypersensitivity Profile

Genomic Location Trend
These plots show the distribution of the DHS sites surrounding the Transcript Start Site of the nearest gene.
Stats
Number of sites: 777Promoter: 0%
CpG-Island: 0%
Conserved: 21%
Enriched Motifs & Matches
Match Detail: [Jaspar]
|
| ||
|---|---|---|
| Sites: 57/100 | e-val: 3.5e-21 | ||
| Factor | e-val(match) | DB |
| Foxd3 | 0.00066962 | JASPAR |
| Lhx3 | 0.0019219 | JASPAR |
| Foxq1 | 0.0080154 | JASPAR |
| Prrx2 | 0.0084828 | JASPAR |
| SRY | 0.017136 | JASPAR |
BED file downloads
Top 10 Example Regions
| Location | Gene Link | Dist. |
|---|---|---|
| chr10: 15085780-15085930 | OLAH | 42.89 |
| chr7: 158469240-158469390 | ESYT2 | 46.57 |
| chr3: 190935240-190935390 | UTS2B | 47.5 |
| chr3: 15680140-15680290 | ANKRD28 | 48.87 |
| chr10: 89430540-89430690 | RP11-57C13.4 | 51.75 |
| chr3: 174213820-174213970 | NAALADL2 | 55.45 |
| chr12: 15786140-15786290 | EPS8 | 59.31 |
| chr11: 128393440-128393590 | RP11-264E20.1 | 59.82 |
| chr3: 141937660-141937810 | GK5 | 60.06 |
| chr5: 114791920-114792070 | FEM1C | 60.14 |