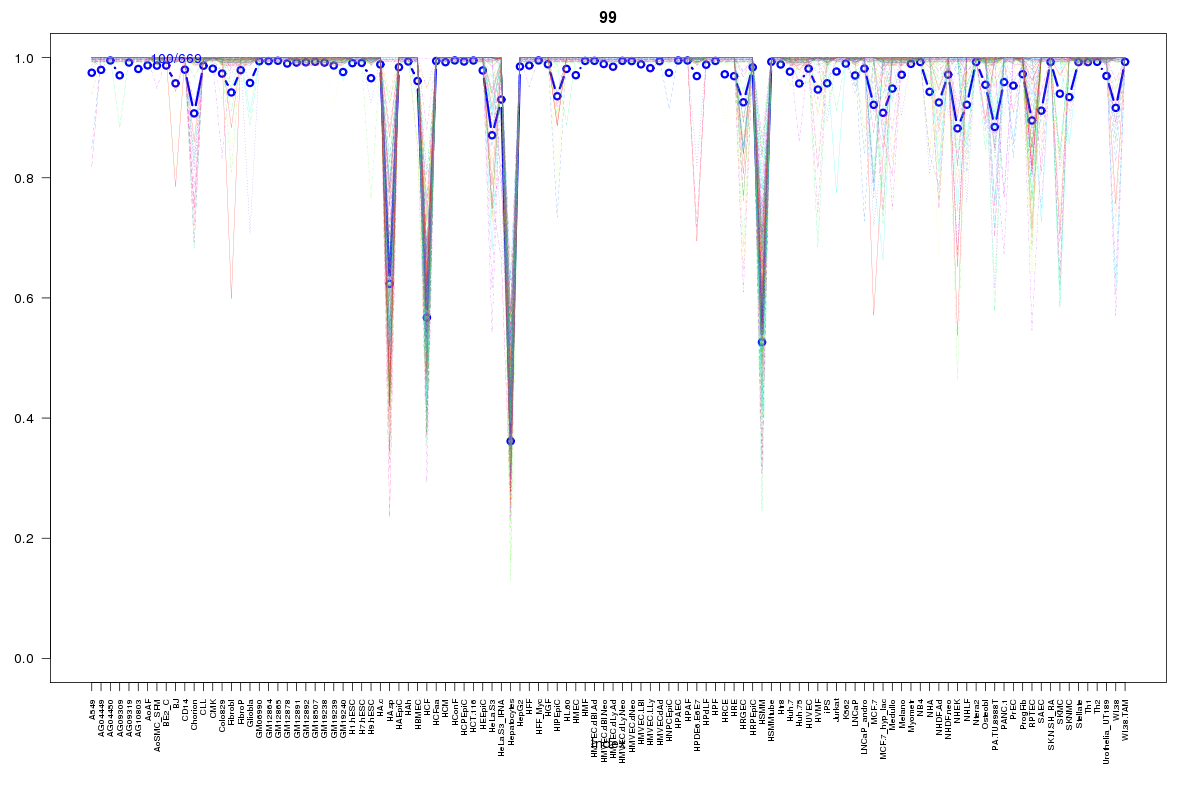
SOM cluster: 99
Cluster Hypersensitivity Profile

Genomic Location Trend
These plots show the distribution of the DHS sites surrounding the Transcript Start Site of the nearest gene.
Stats
Number of sites: 669Promoter: 87%
CpG-Island: 96%
Conserved: 92%
Enriched Motifs & Matches
Match Detail: [Jaspar]
|
| ||
|---|---|---|
| Sites: 100/100 | e-val: 0 | ||
| Factor | e-val(match) | DB |
| SP1 | 0.00000000000043554 | JASPAR |
| Klf4 | 0.000000013284 | JASPAR |
| INSM1 | 0.00053653 | JASPAR |
| Egr1 | 0.001578 | JASPAR |
| TFAP2A | 0.0027757 | JASPAR |
|
| ||
| Sites: 95/100 | e-val: 0 | ||
| Factor | e-val(match) | DB |
| SP1 | 0.00006077 | JASPAR |
| PLAG1 | 0.0026996 | JASPAR |
| TFAP2A | 0.0028599 | JASPAR |
| Klf4 | 0.008231 | JASPAR |
| Zfx | 0.0083136 | JASPAR |
|
| ||
| Sites: 11/100 | e-val: 0.0000005 | ||
| Factor | e-val(match) | DB |
| Myb | 0.0012244 | JASPAR |
| znf143 | 0.0015896 | JASPAR |
| ELK4 | 0.0022951 | JASPAR |
| RELA | 0.0035705 | JASPAR |
| Pax4 | 0.010775 | JASPAR |
BED file downloads
Top 10 Example Regions
| Location | Gene Link | Dist. |
|---|---|---|
| chr1: 146644040-146644190 | FMO5 | 13.02 |
| chr1: 161582220-161582370 | FCGR3A | 41.72 |
| chr7: 127291860-127292010 | FSCN3 | 43.76 |
| chr1: 53704160-53704310 | RP4-784A16.2 | 47.46 |
| chr2: 152266240-152266390 | NEB | 51.2 |
| chrX: 47092960-47093110 | RP11-571E6.1 | 53.76 |
| chr2: 101869285-101869435 | CREG2 | 56.75 |
| chr19: 38085640-38085790 | ZFP30 | 61.44 |
| chr6: 33679440-33679590 | IP6K3 | 63.55 |
| chr11: 64808420-64808570 | SYVN1 | 64.22 |