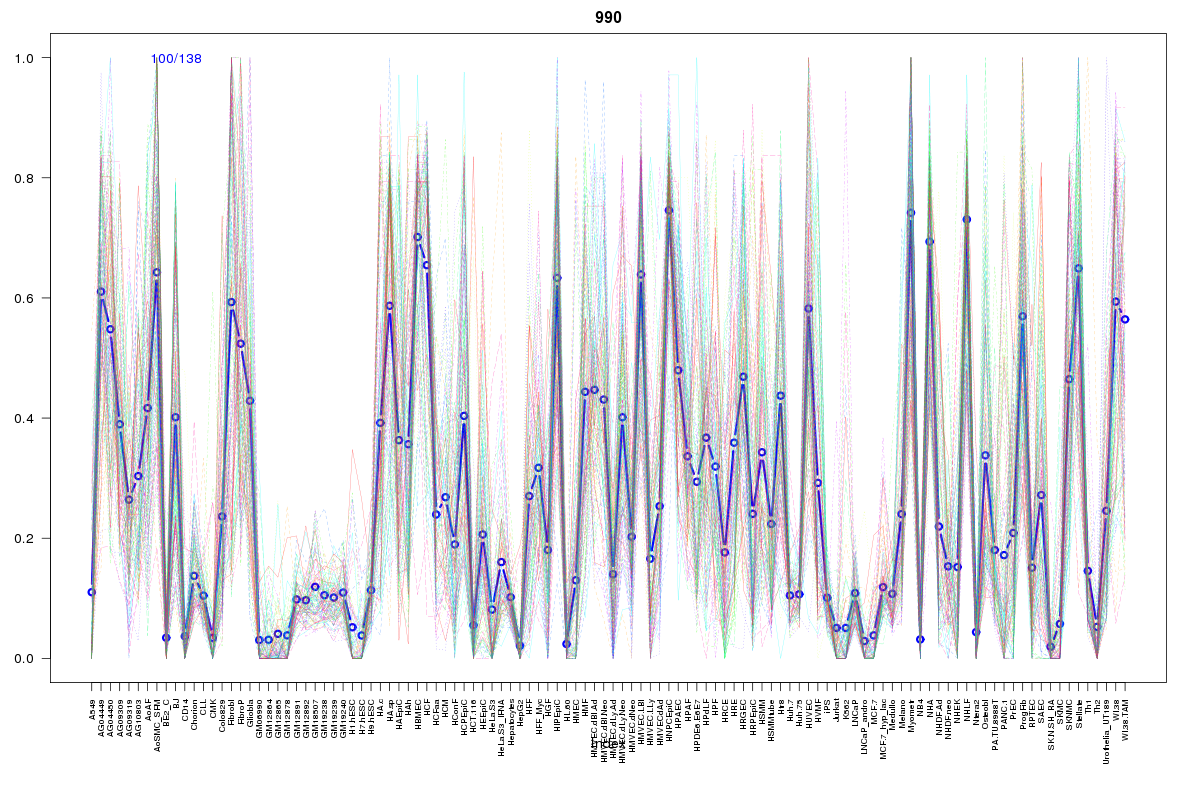
SOM cluster: 990
Cluster Hypersensitivity Profile

Genomic Location Trend
These plots show the distribution of the DHS sites surrounding the Transcript Start Site of the nearest gene.
Stats
Number of sites: 138Promoter: 0%
CpG-Island: 0%
Conserved: 36%
Enriched Motifs & Matches
Match Detail: [Jaspar]
|
| ||
|---|---|---|
| Sites: 58/100 | e-val: 1.4e-16 | ||
| Factor | e-val(match) | DB |
| AP1 | 0.0000000011469 | JASPAR |
| NFE2L2 | 0.000000037903 | JASPAR |
| PBX1 | 0.0024328 | JASPAR |
| Foxa2 | 0.0075715 | JASPAR |
| NFE2L1::MafG | 0.0088145 | JASPAR |
BED file downloads
Top 10 Example Regions
| Location | Gene Link | Dist. |
|---|---|---|
| chr1: 162843580-162843730 | RN7SL861P | 41.46 |
| chr1: 162843580-162843730 | HSD17B7 | 41.46 |
| chr1: 162843580-162843730 | DDR2 | 41.46 |
| chr1: 162843580-162843730 | C1orf110 | 41.46 |
| chr8: 42712260-42712410 | HOOK3 | 44.07 |
| chr14: 51909340-51909490 | FRMD6 | 50.73 |
| chr4: 3344320-3344470 | HTT | 53.17 |
| chr22: 31638080-31638230 | PATZ1 | 55.26 |
| chr8: 116448280-116448430 | TRPS1 | 57.77 |
| chr3: 159601340-159601490 | SCHIP1 | 57.98 |