Gene: ITGA3
chr17: 48133331-48154359Expression Profile
(log scale)
Graphical Connections
Distribution of linked clusters:
You may find it interesting if many of the connected DHS sites belong to the same cluster.| Cluster Profile | Cluster ID | Number of DHS sites in this cluster |
|---|---|---|
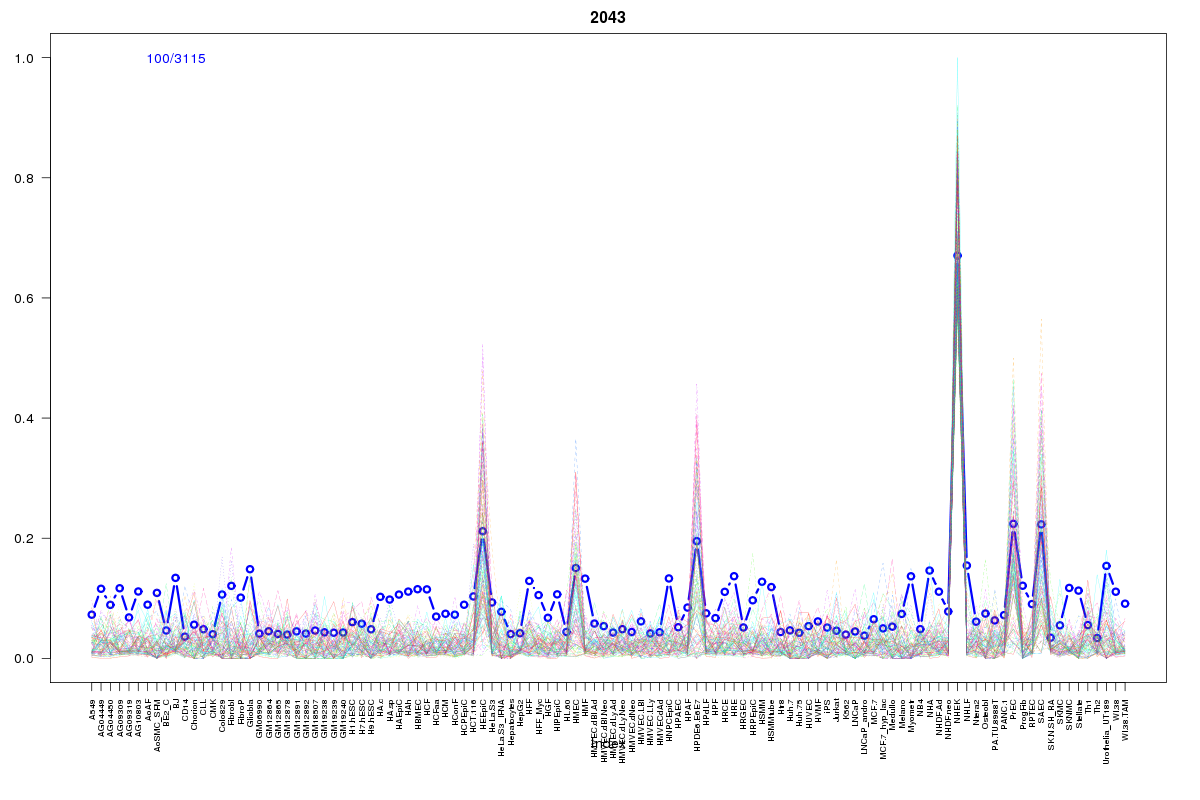 | 2043 | 4 |
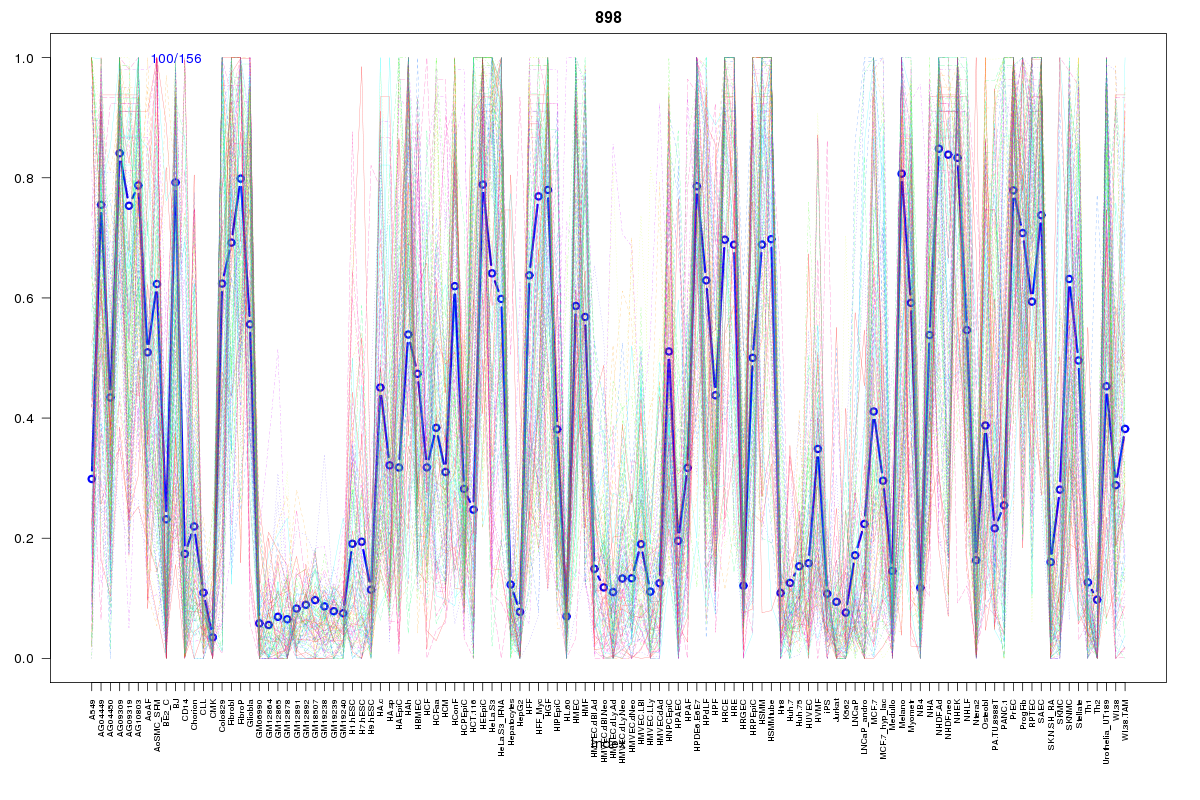 | 898 | 4 |
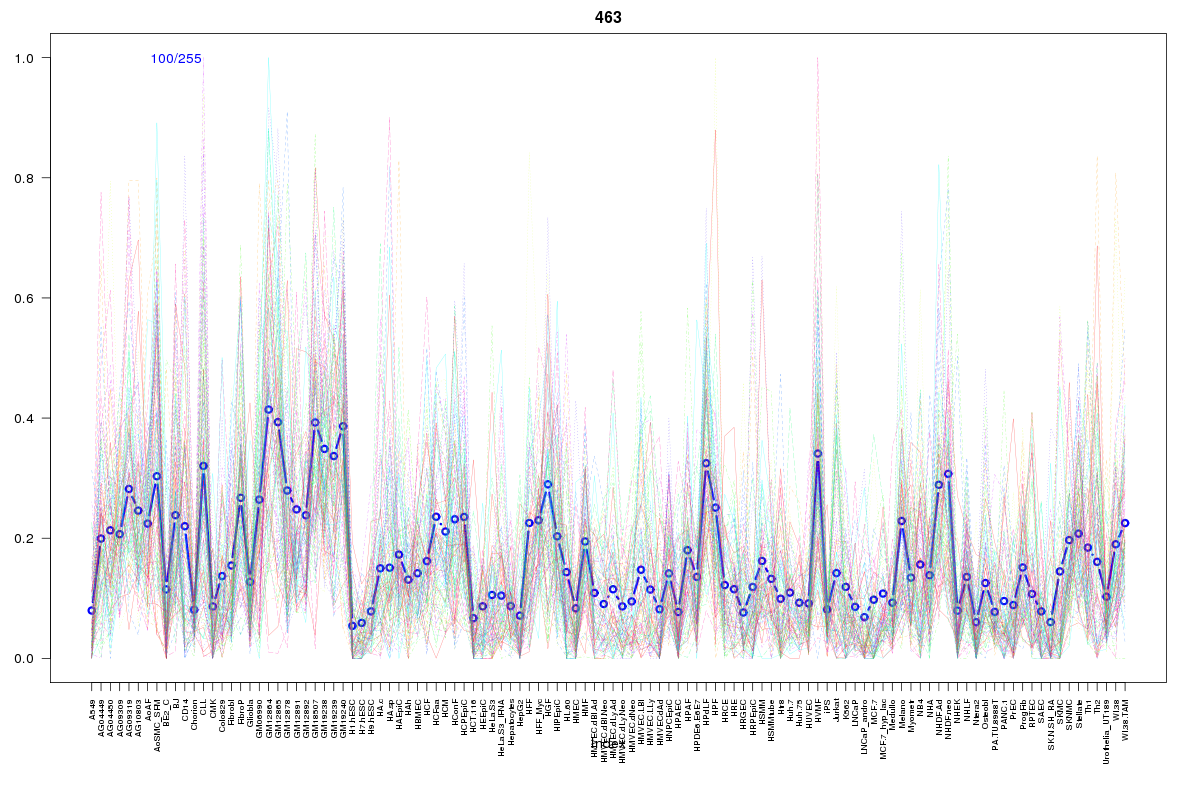 | 463 | 3 |
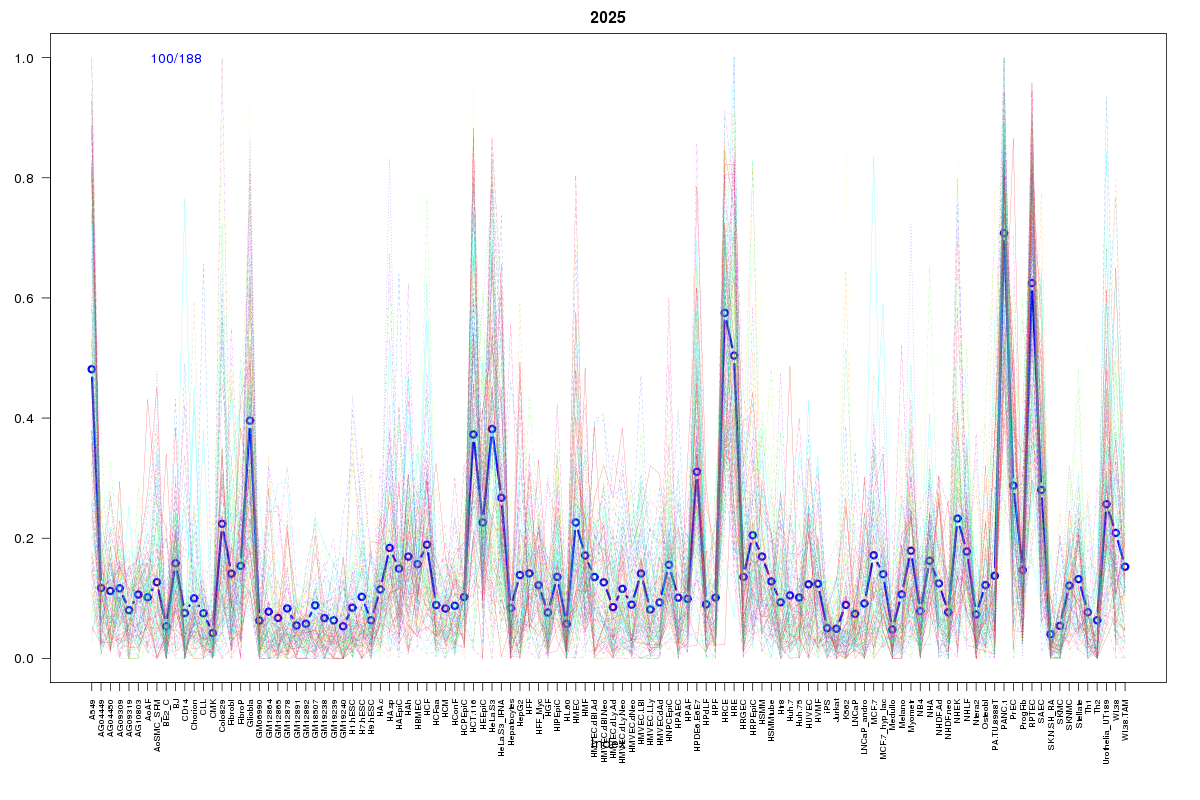 | 2025 | 2 |
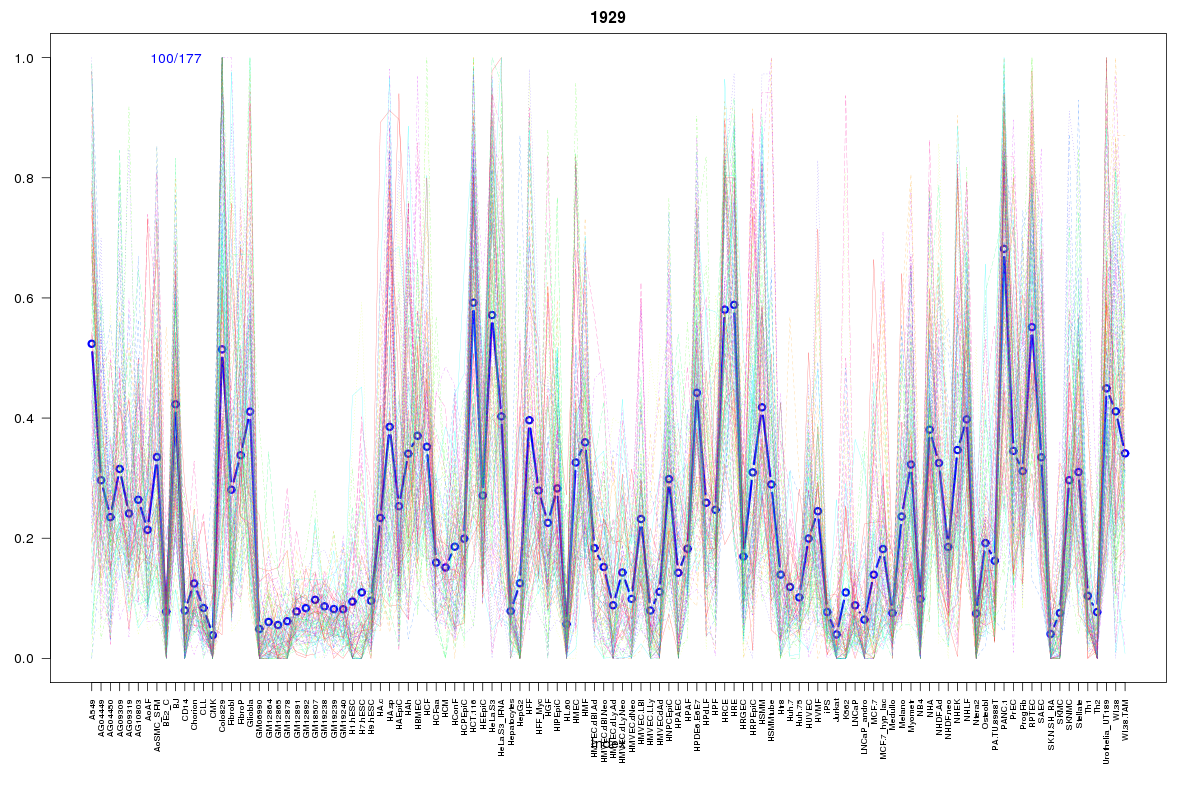 | 1929 | 2 |
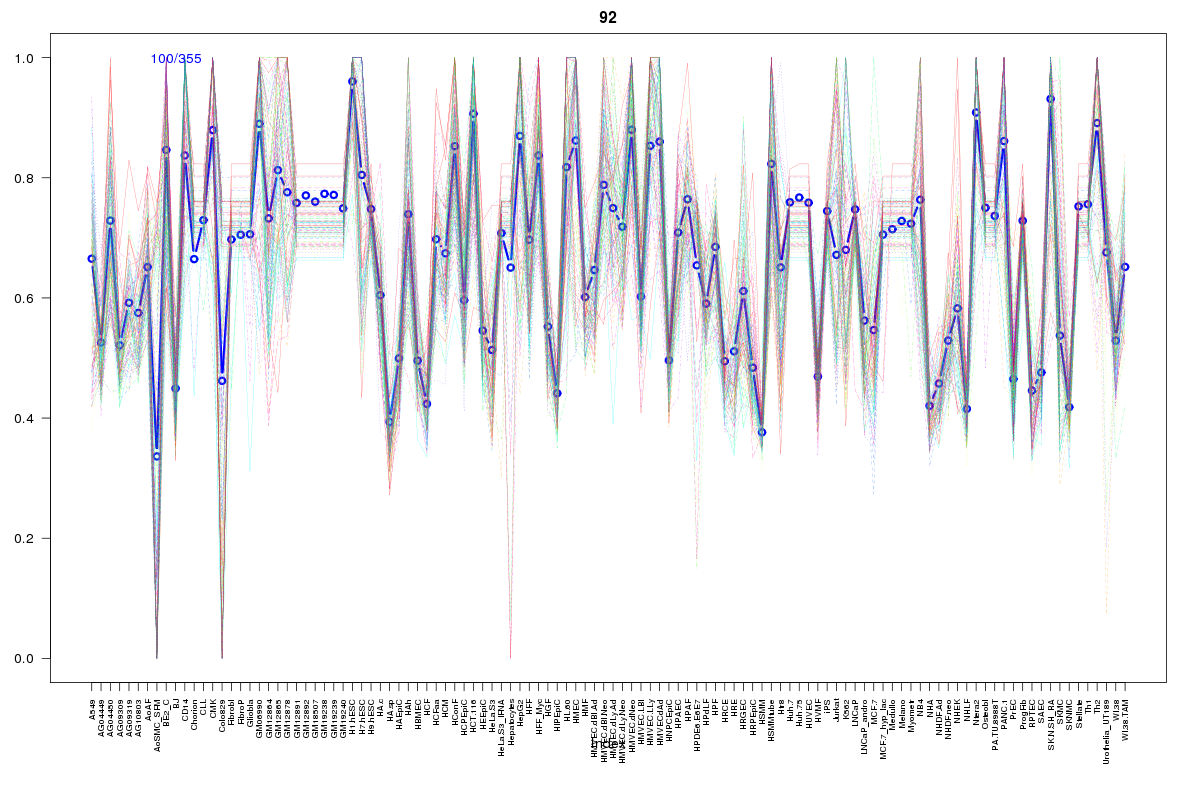 | 92 | 2 |
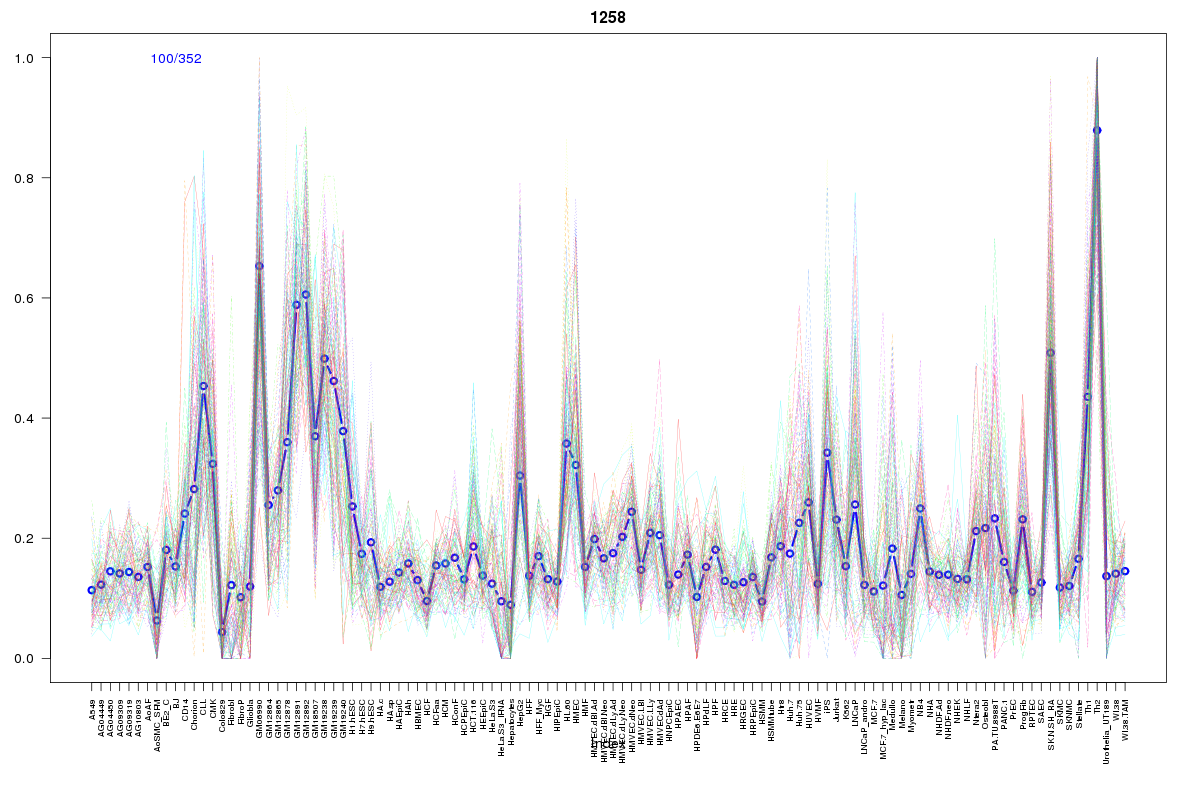 | 1258 | 2 |
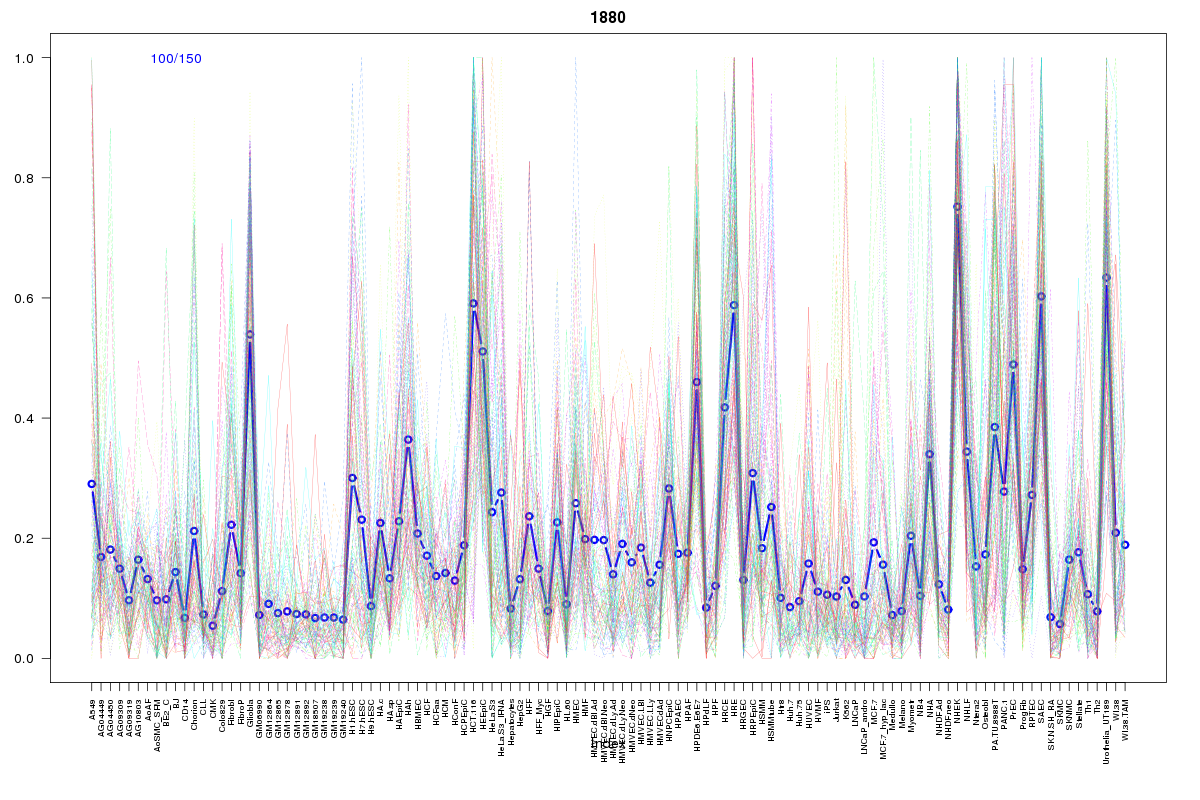 | 1880 | 2 |
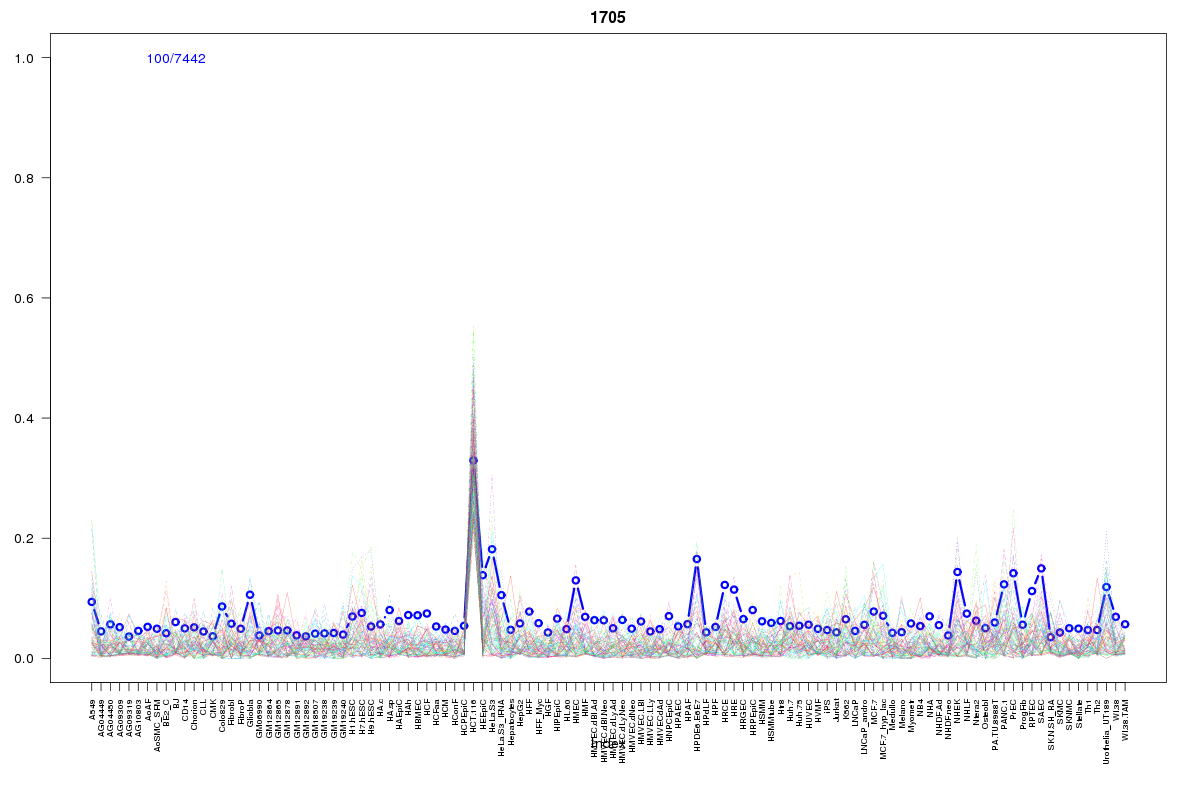 | 1705 | 2 |
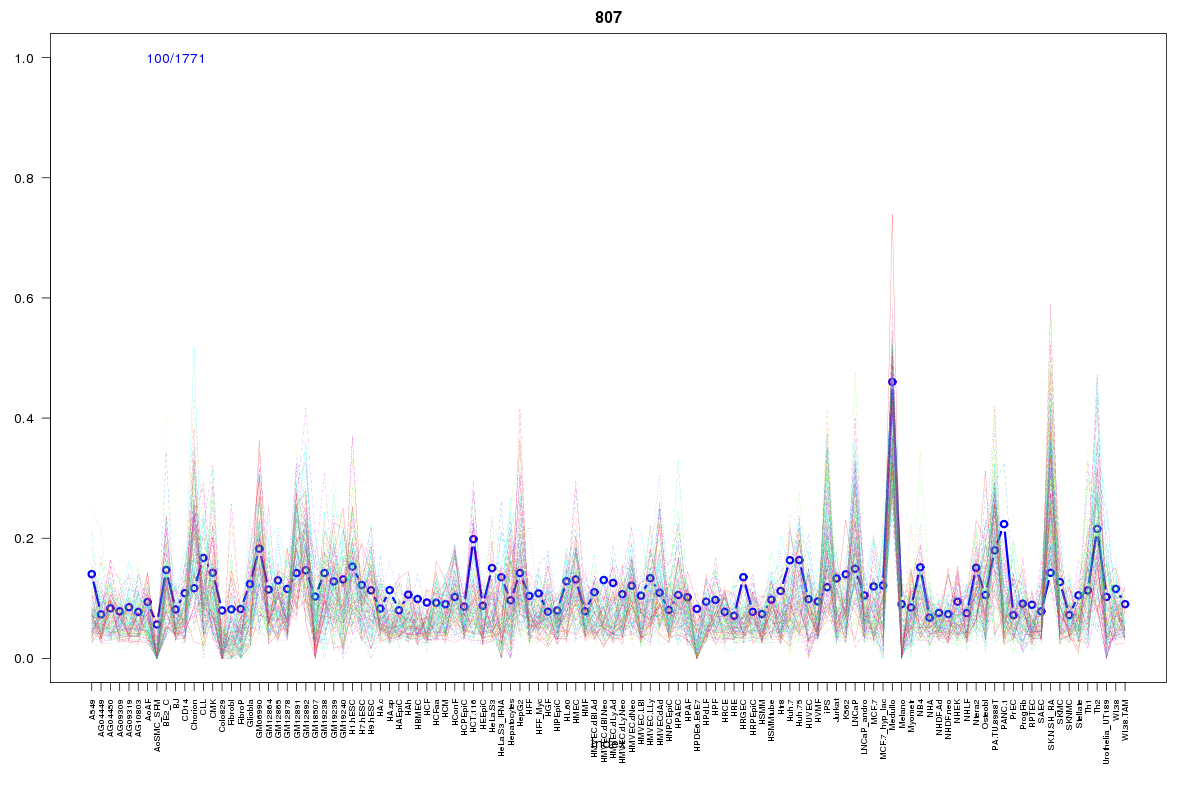 | 807 | 1 |
 | 1923 | 1 |
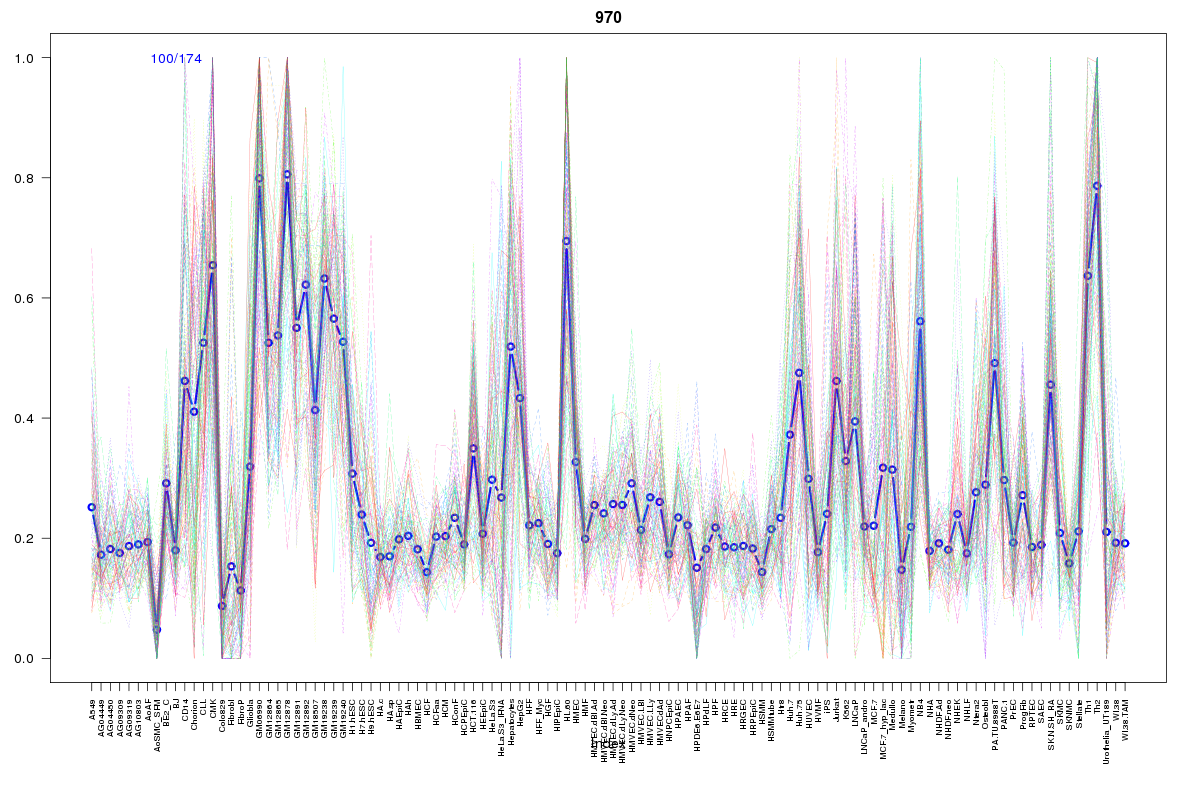 | 970 | 1 |
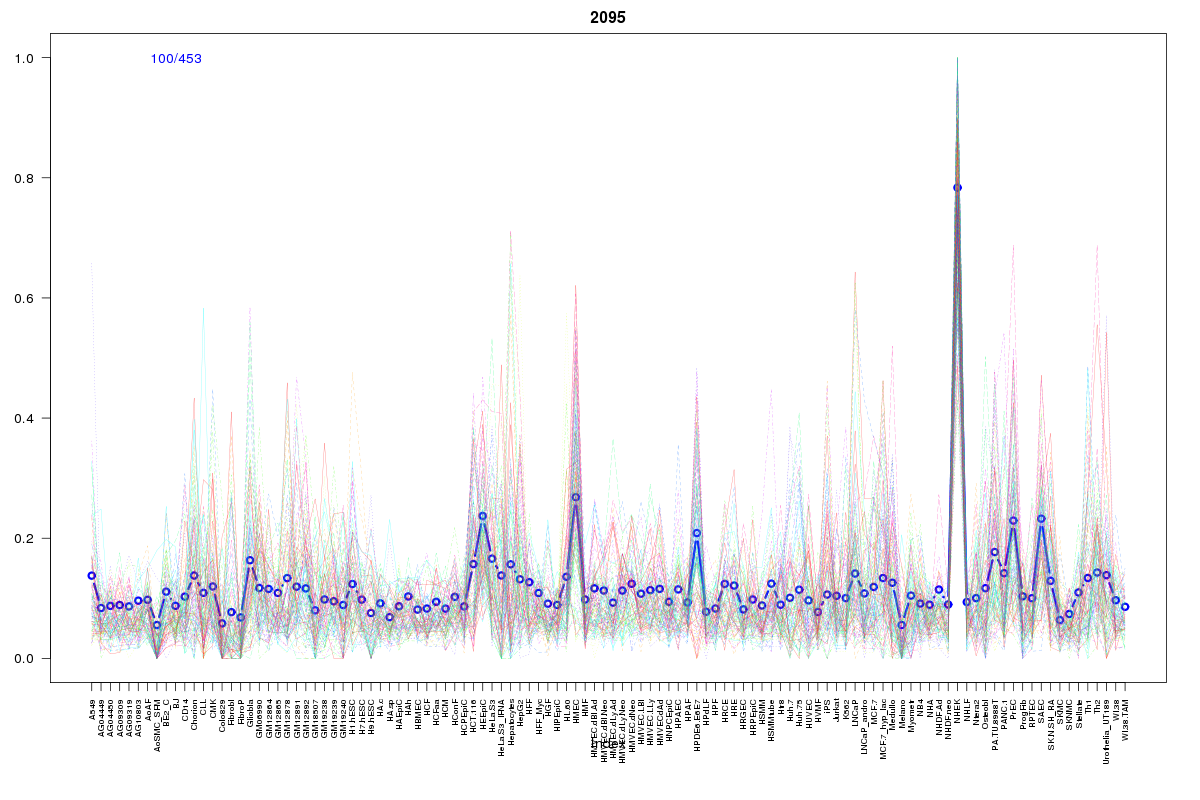 | 2095 | 1 |
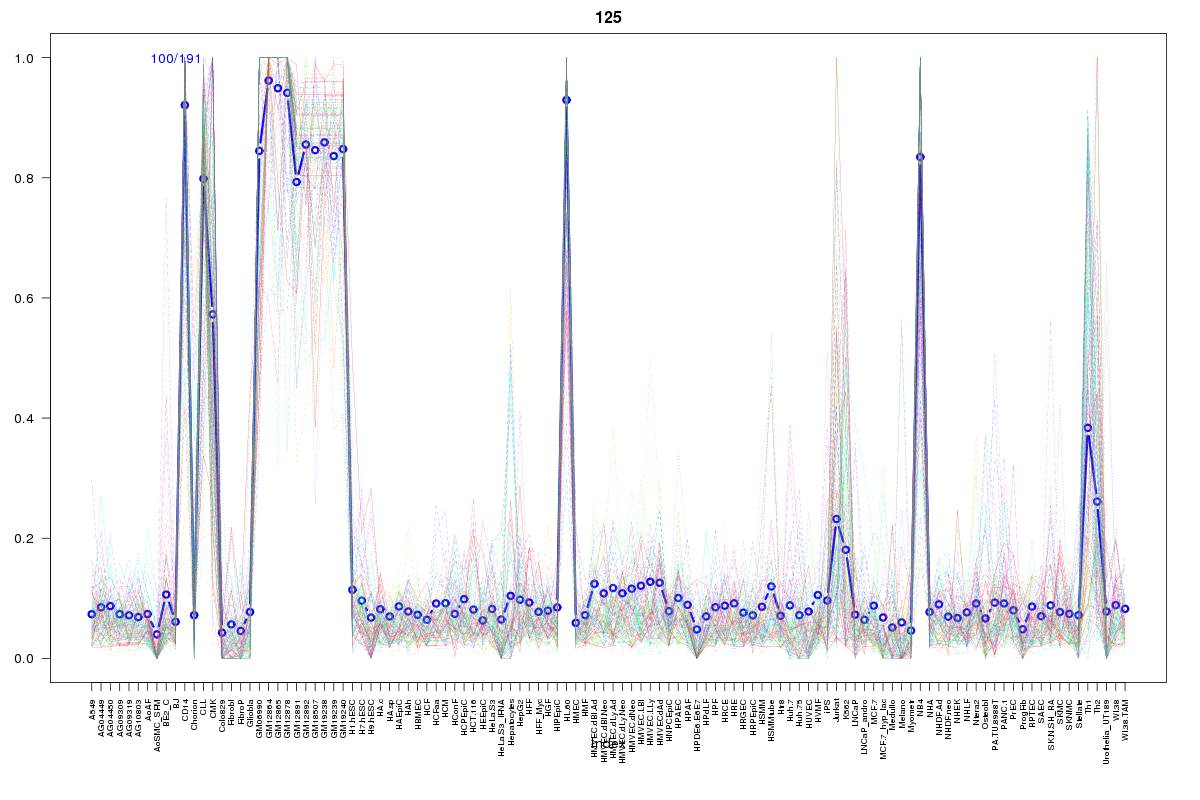 | 125 | 1 |
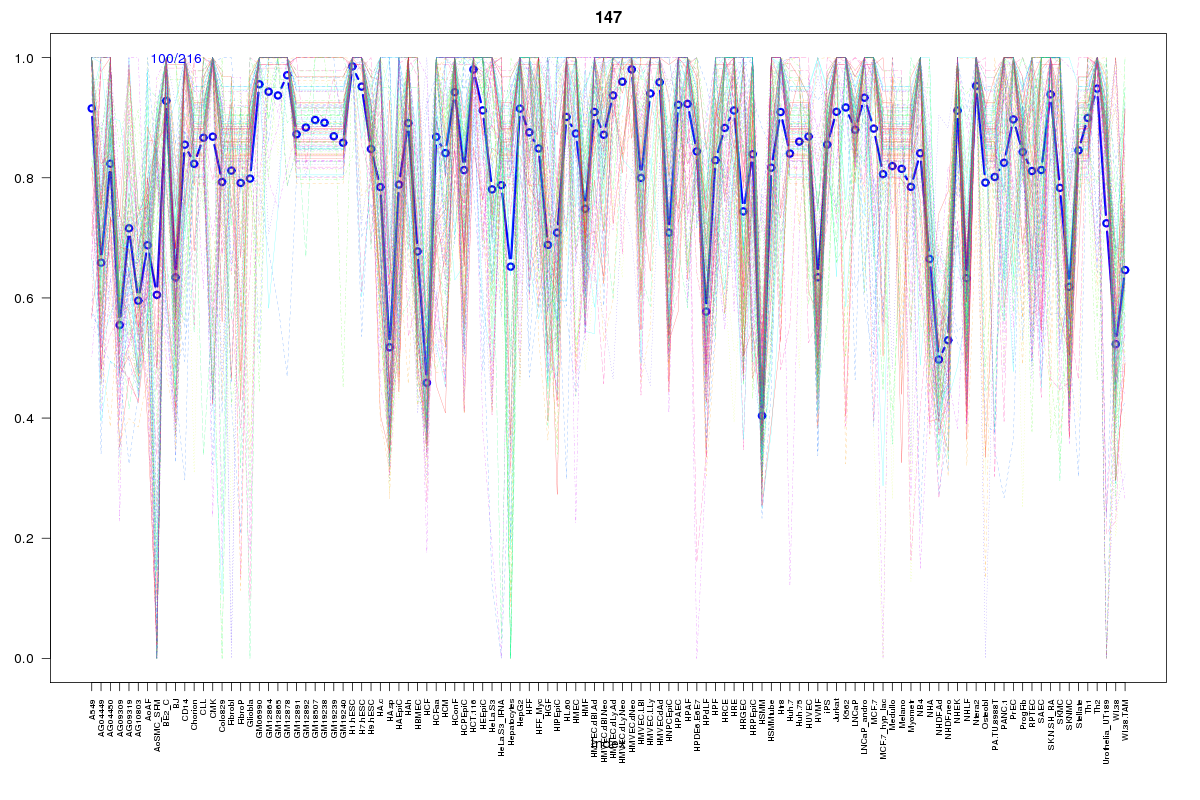 | 147 | 1 |
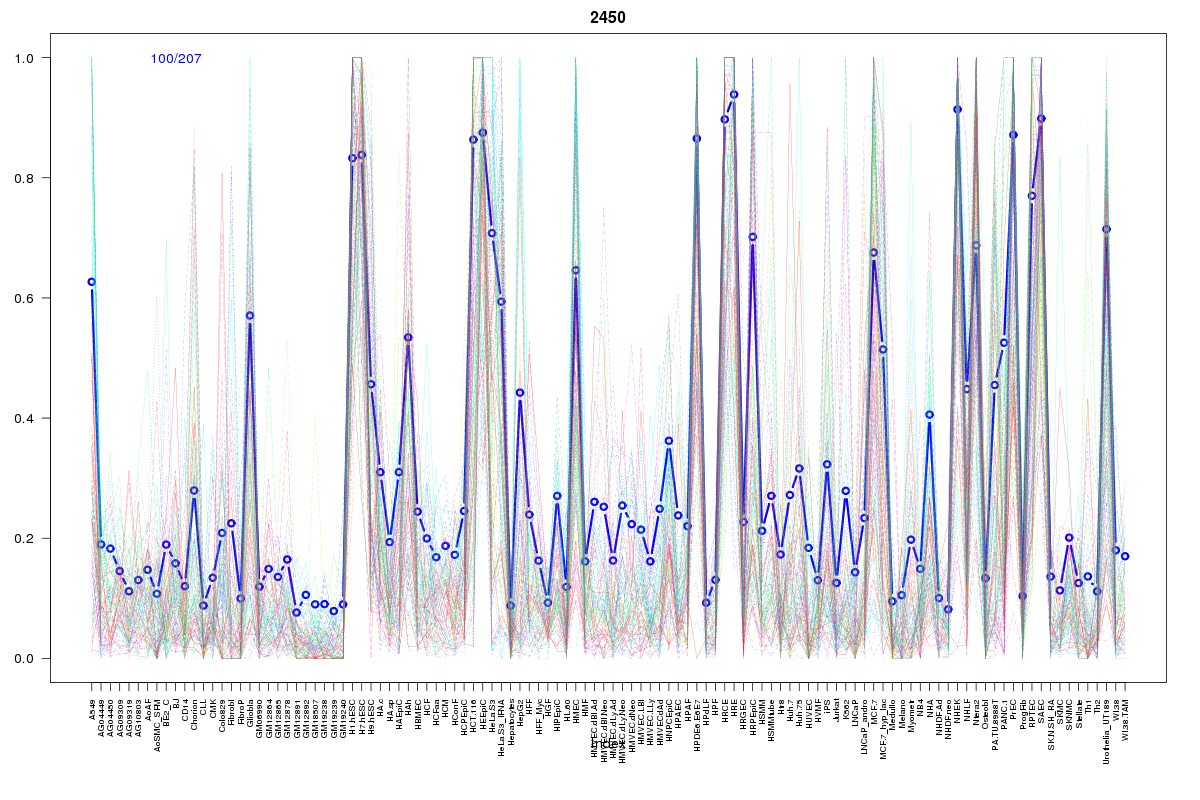 | 2450 | 1 |
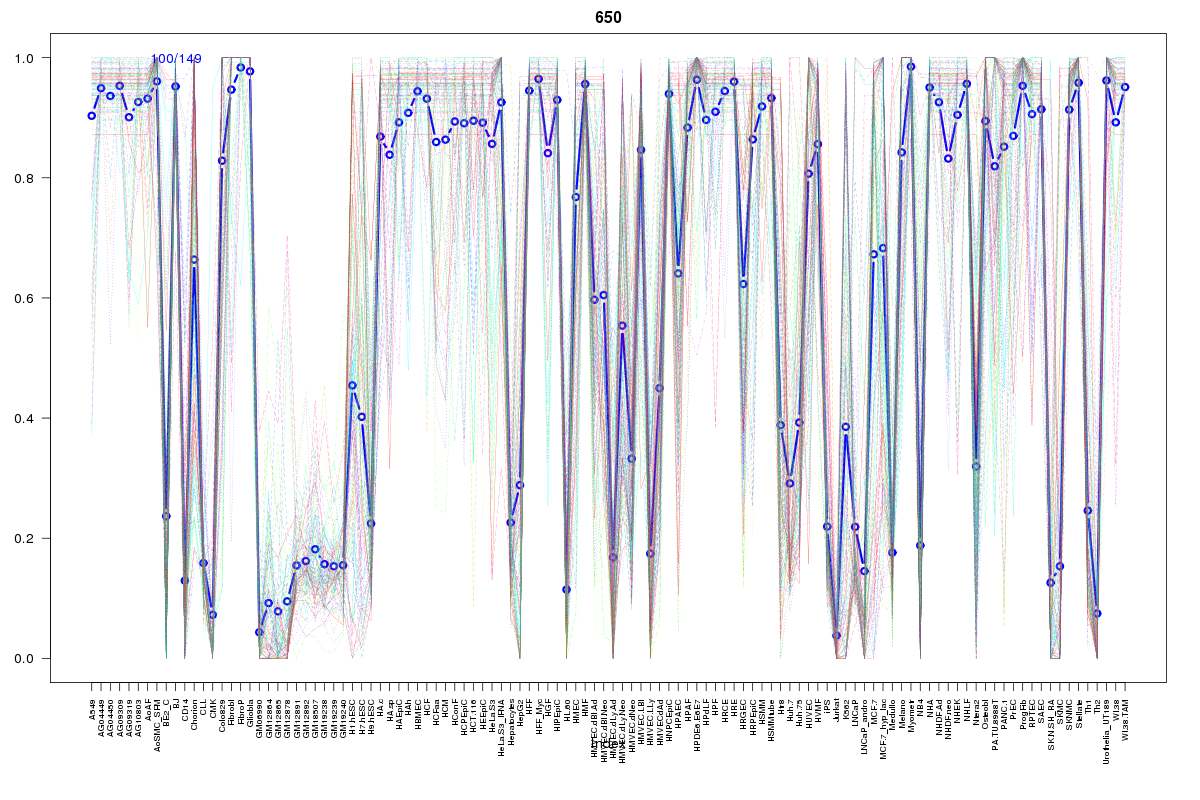 | 650 | 1 |
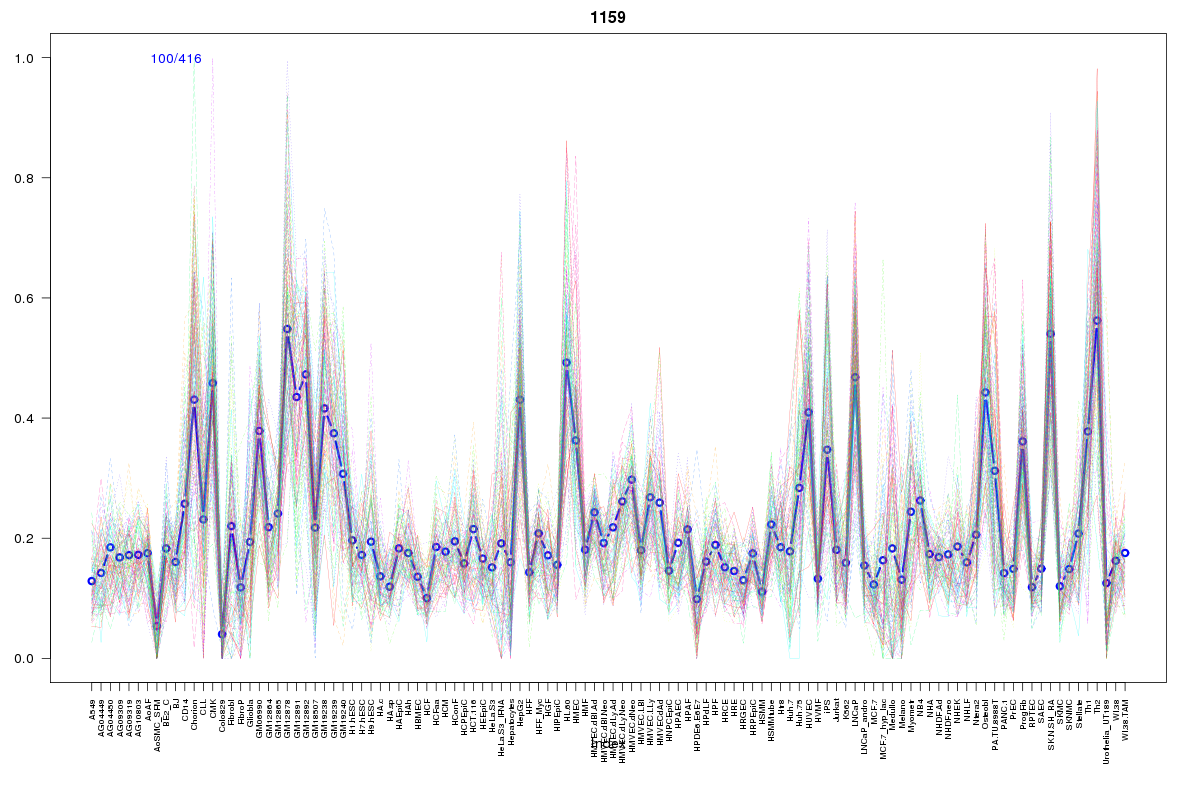 | 1159 | 1 |
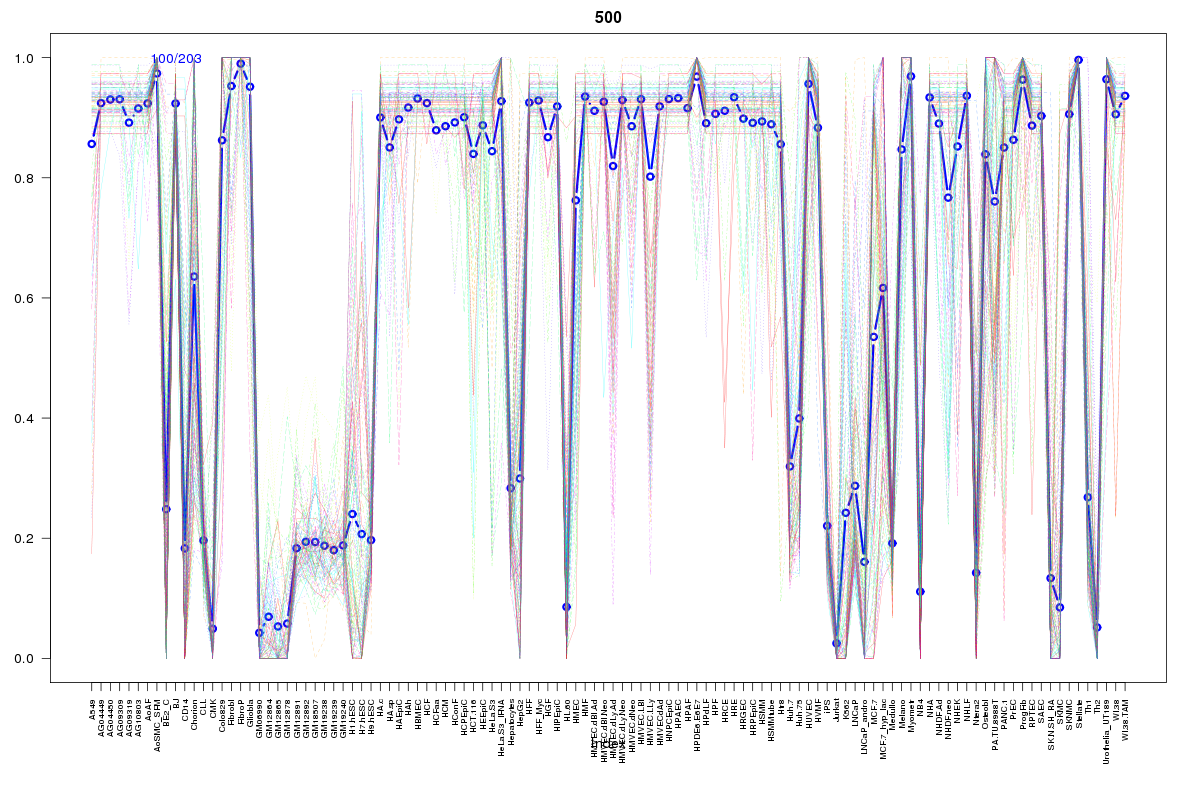 | 500 | 1 |
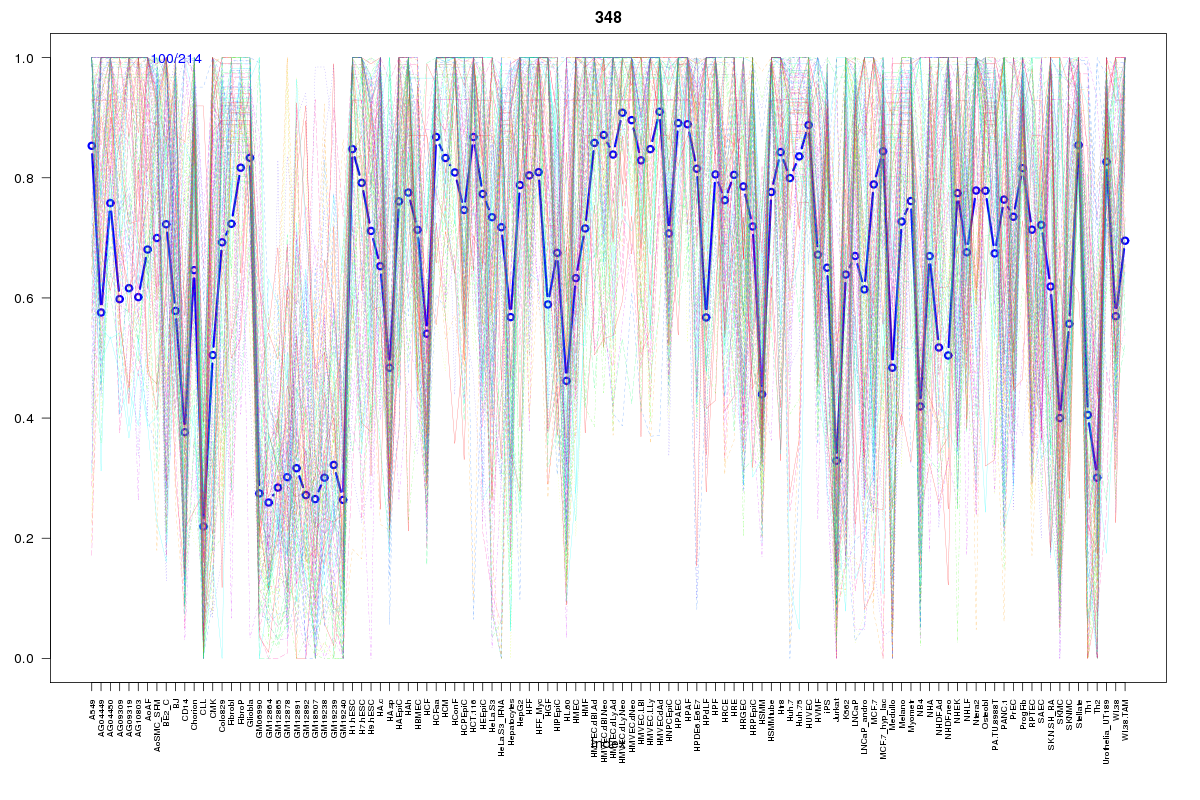 | 348 | 1 |
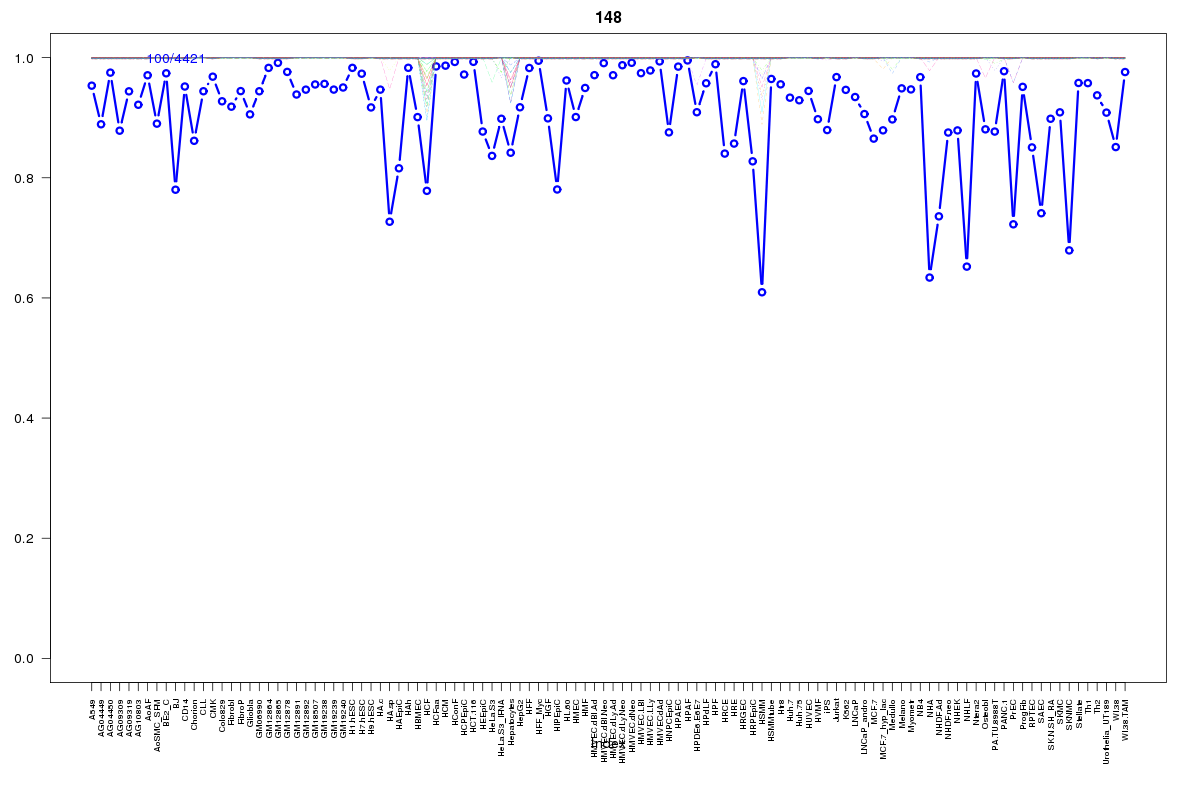 | 148 | 1 |
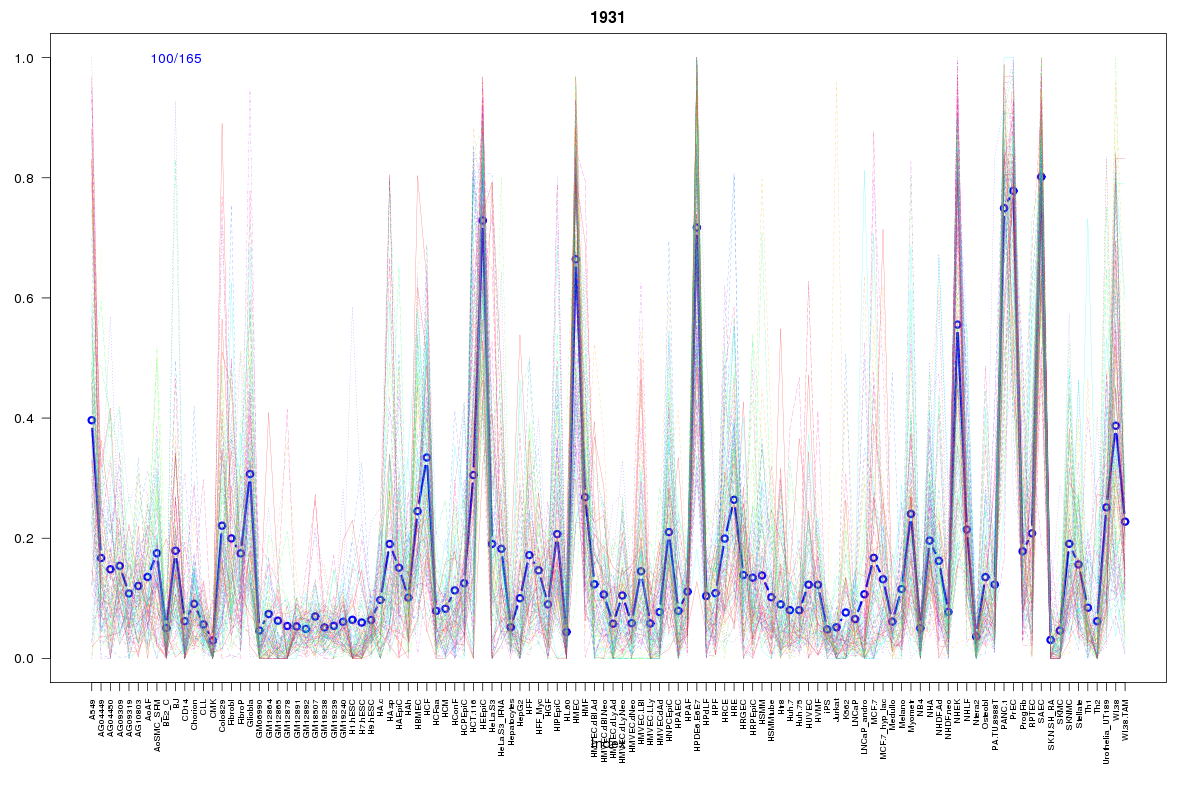 | 1931 | 1 |
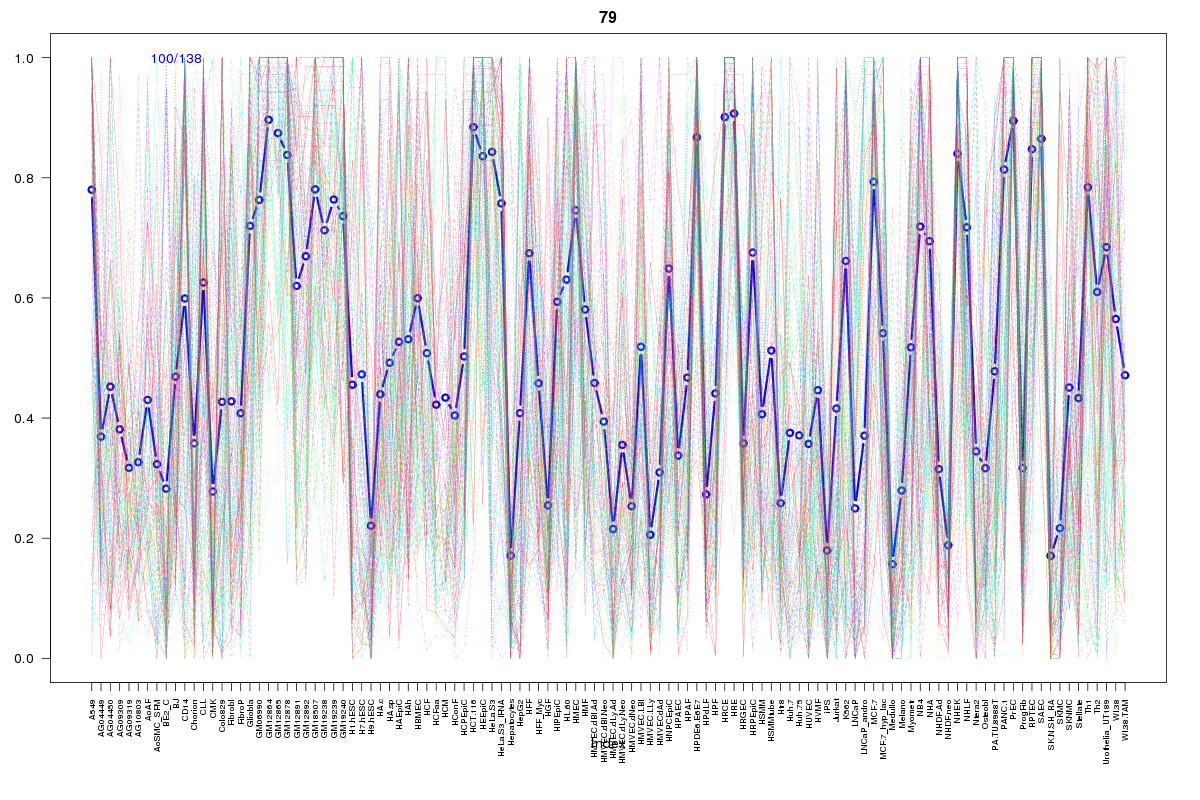 | 79 | 1 |
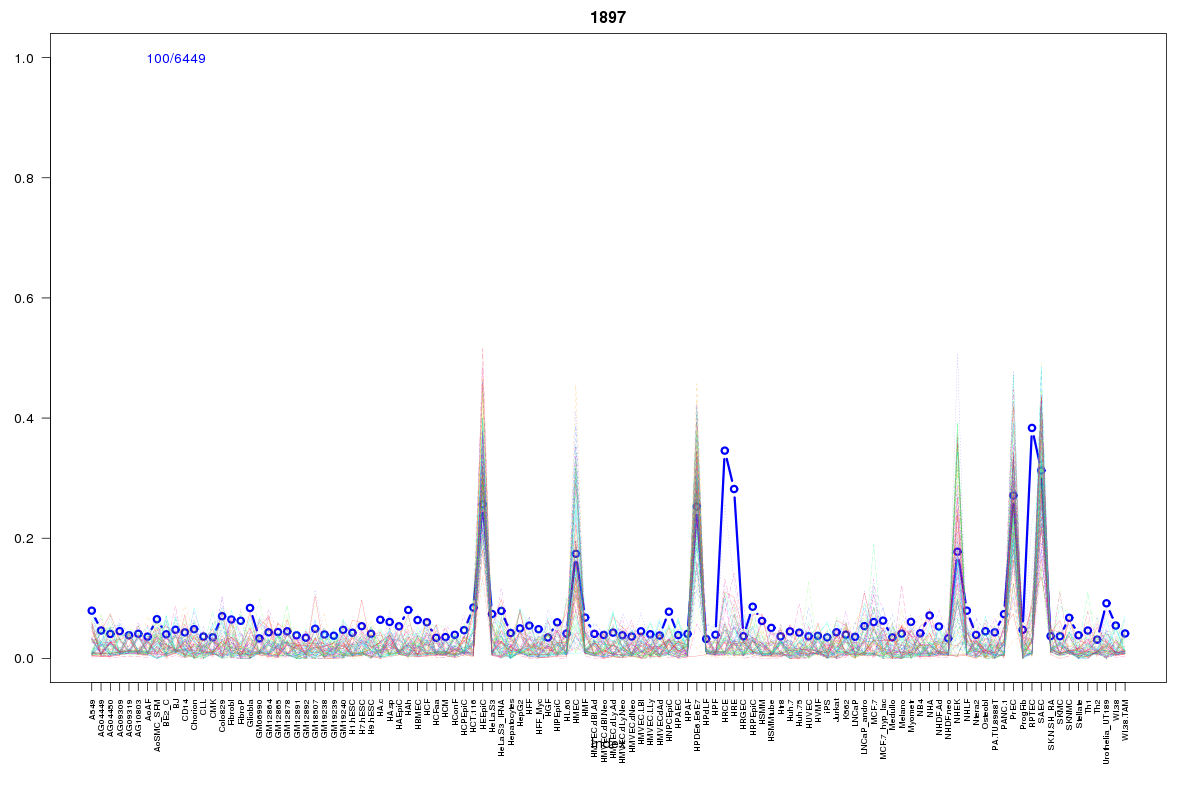 | 1897 | 1 |
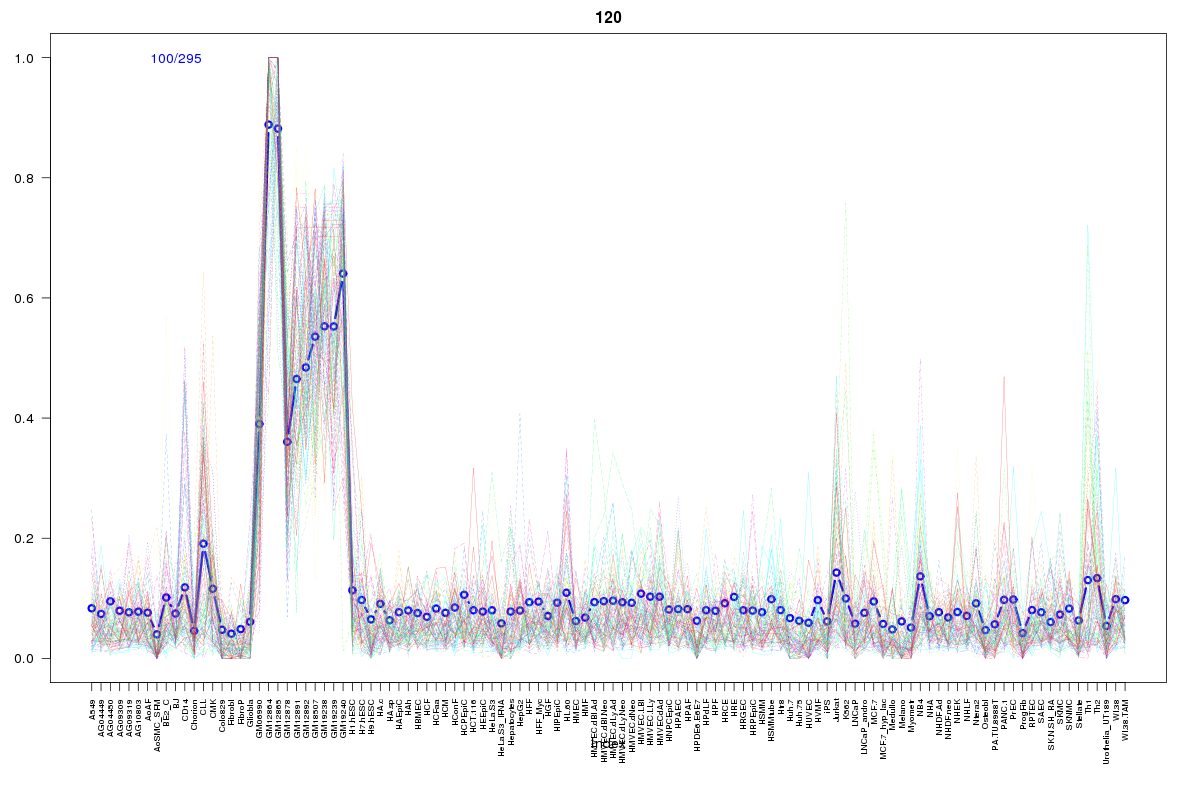 | 120 | 1 |
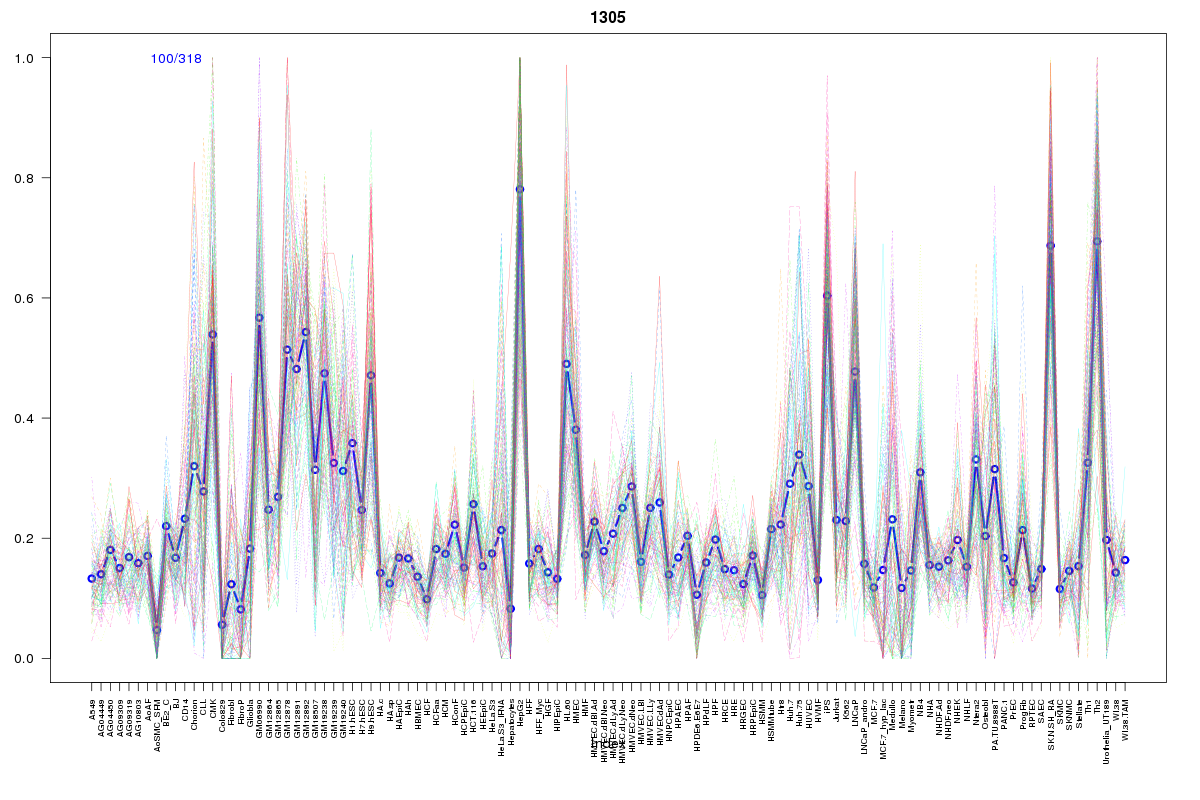 | 1305 | 1 |
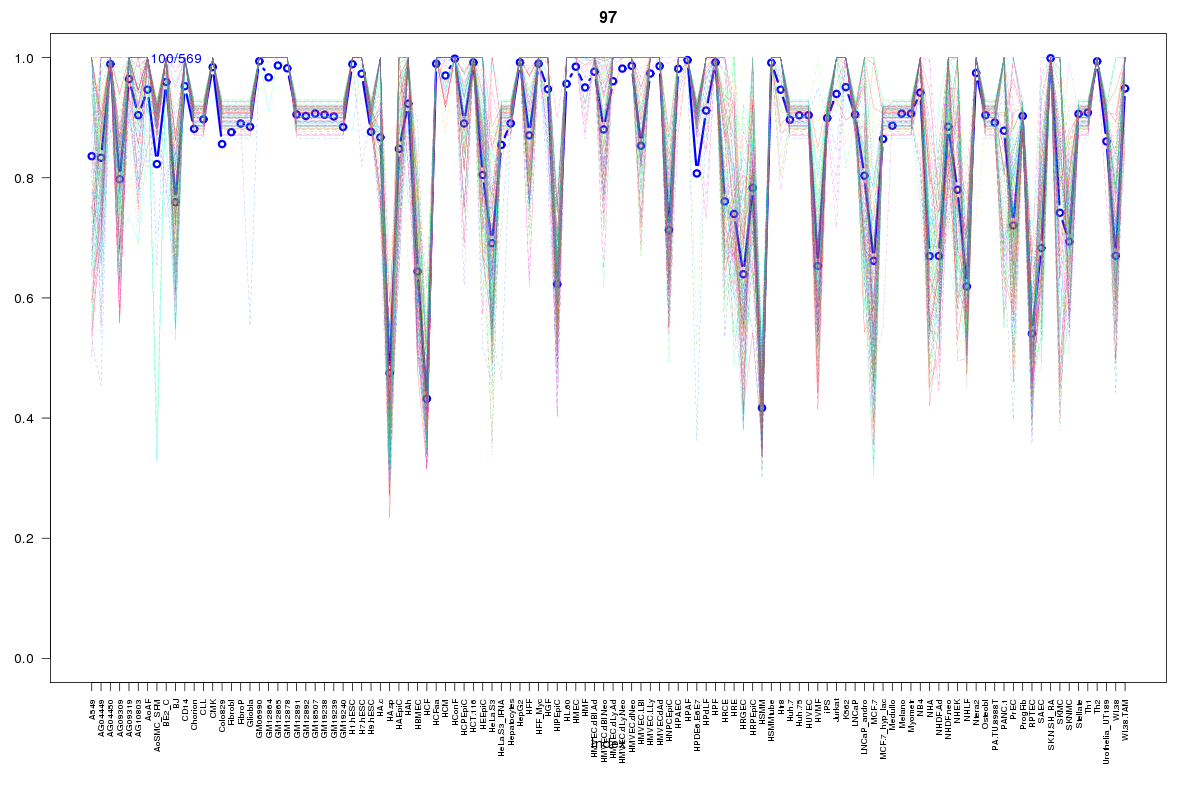 | 97 | 1 |
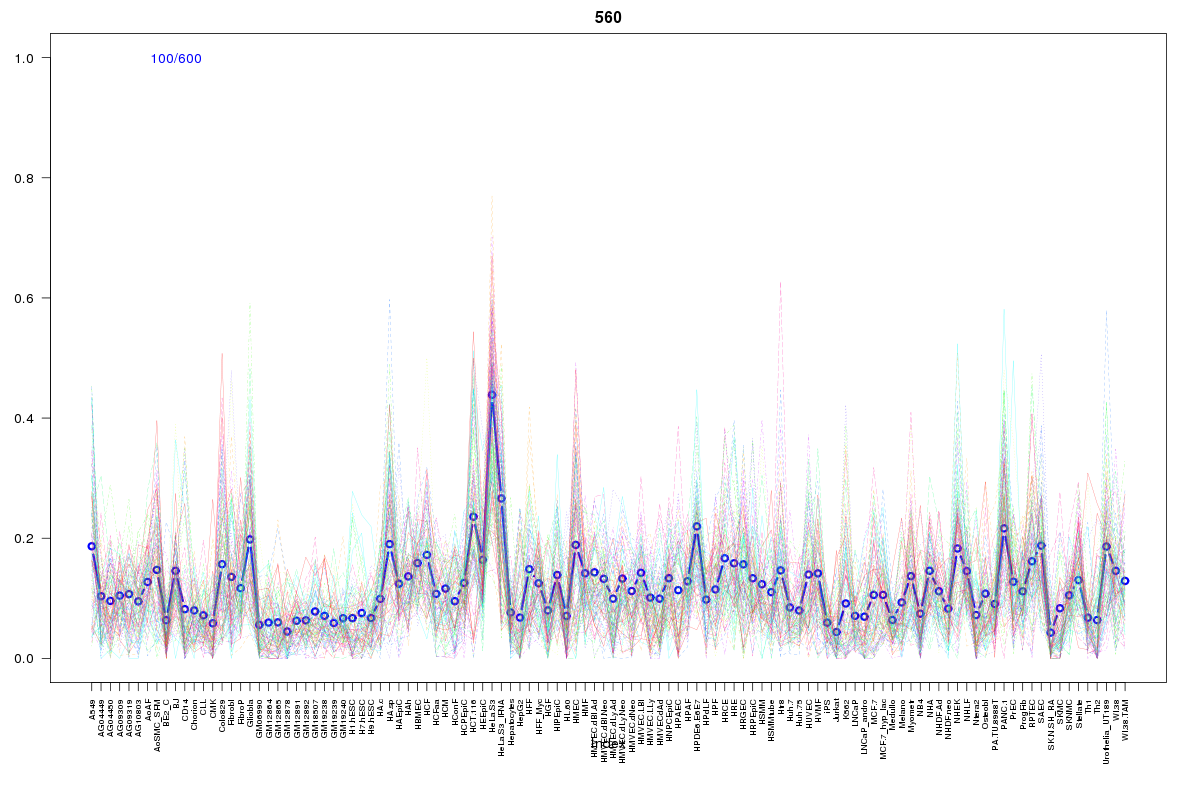 | 560 | 1 |
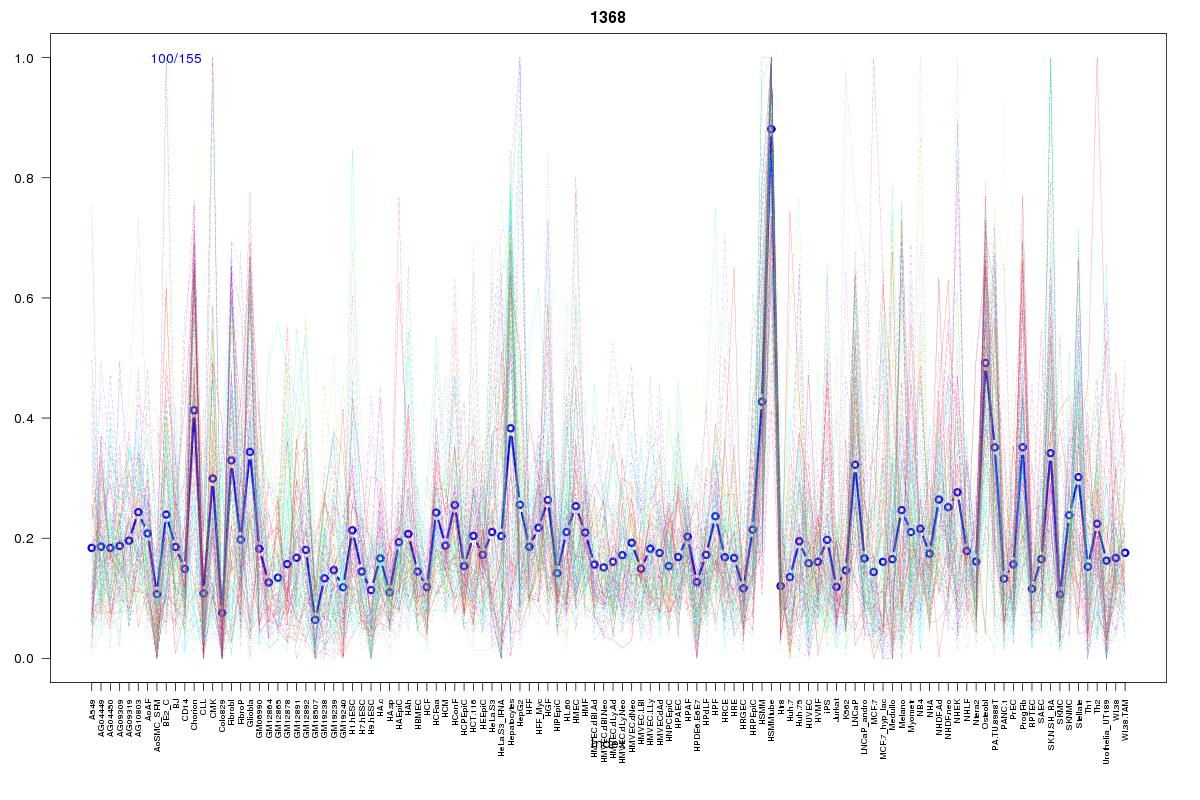 | 1368 | 1 |
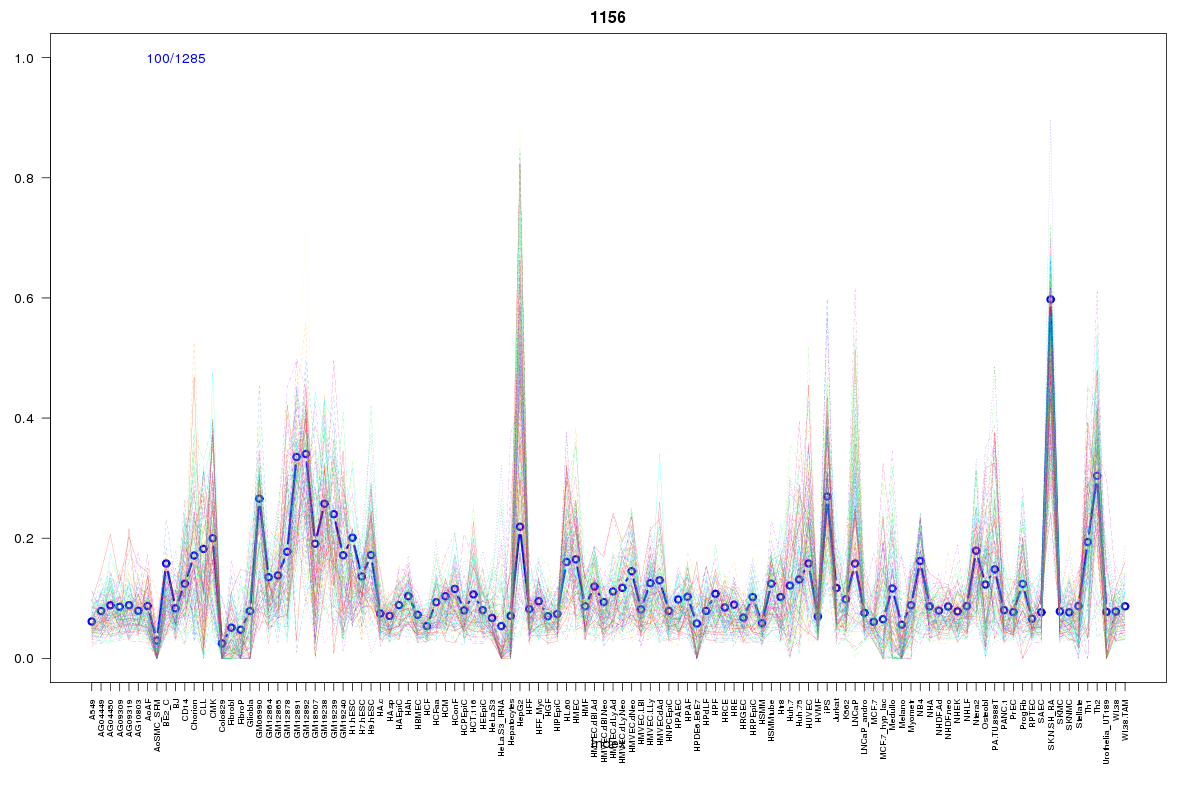 | 1156 | 1 |
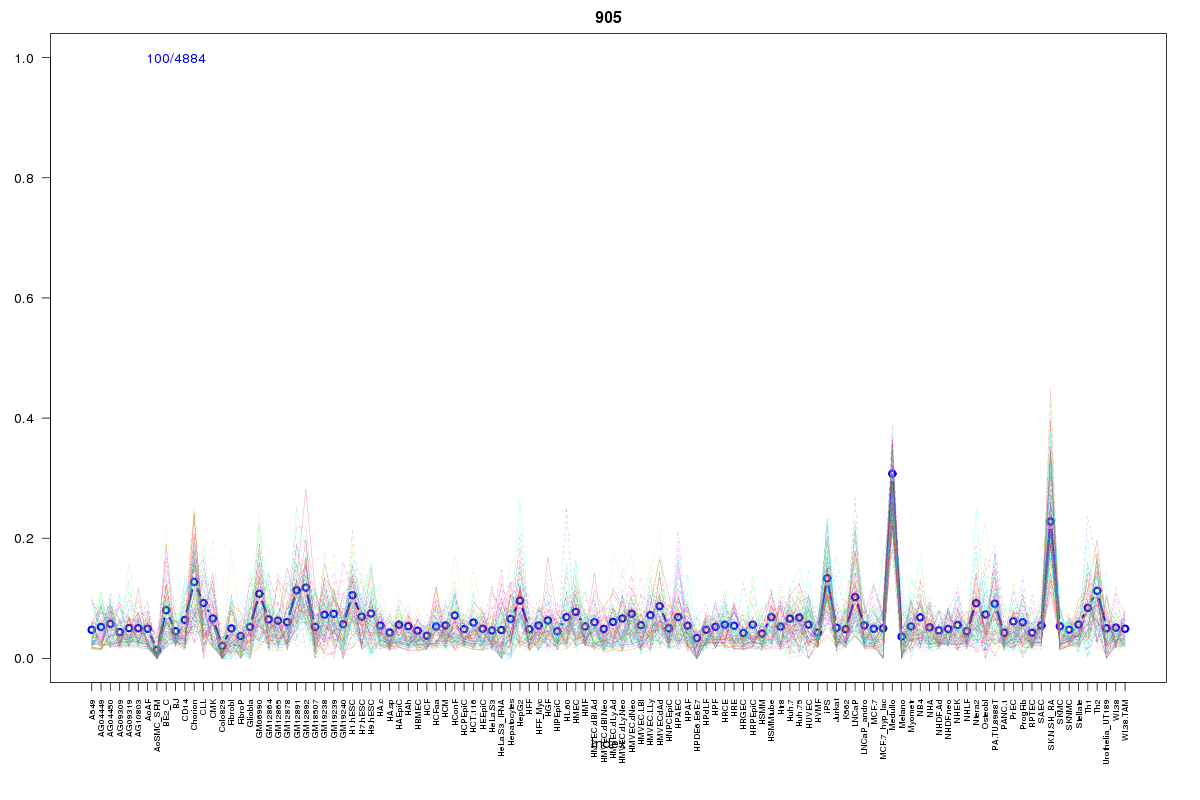 | 905 | 1 |
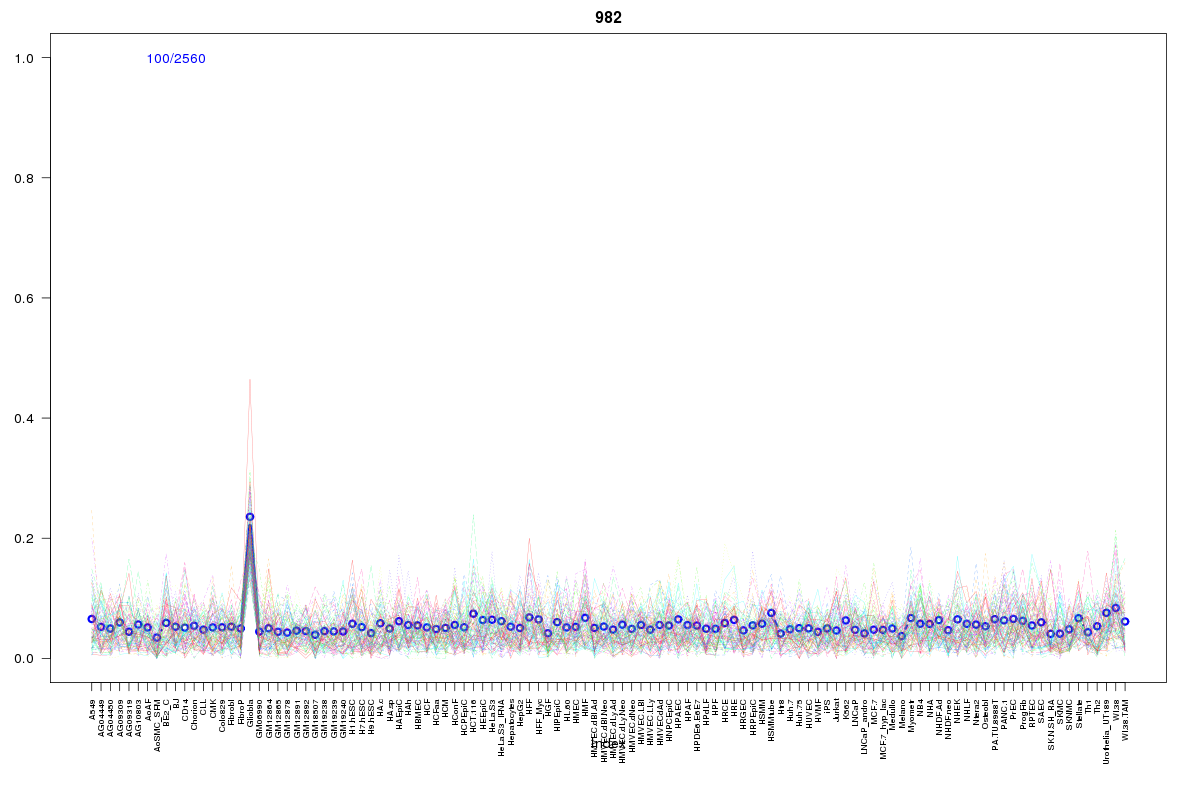 | 982 | 1 |
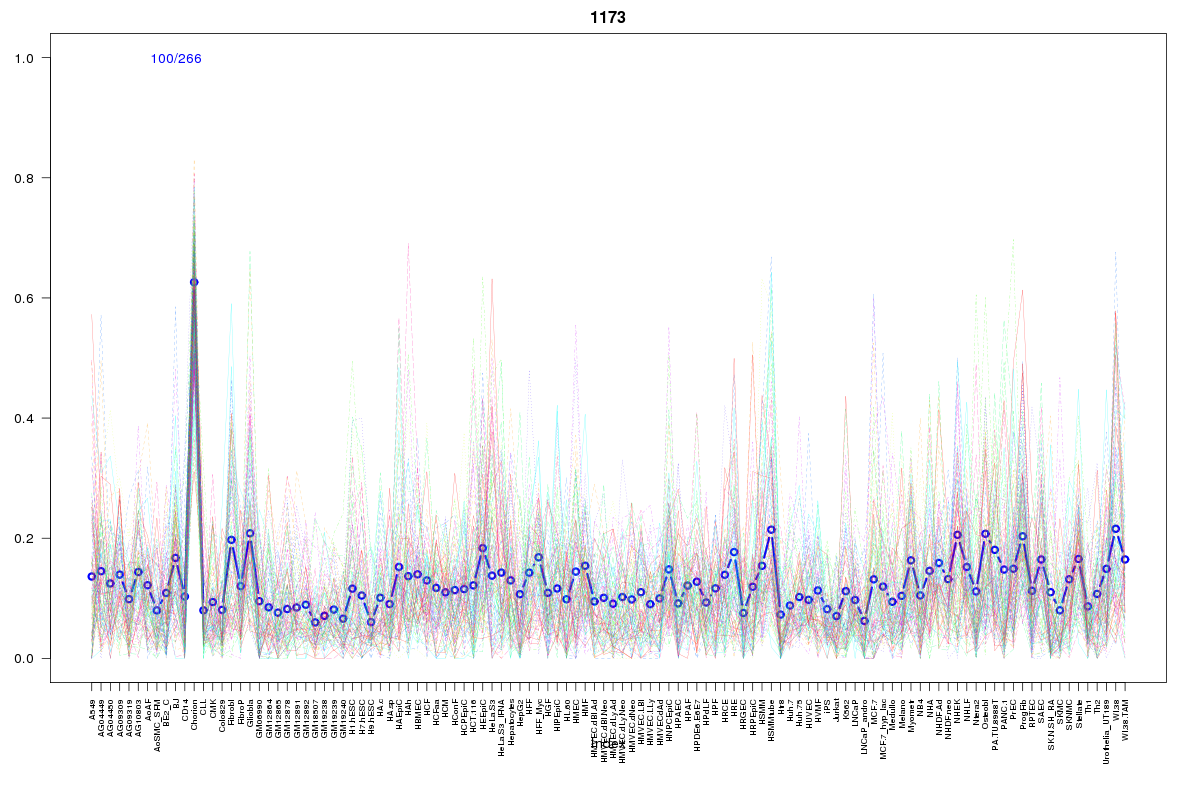 | 1173 | 1 |
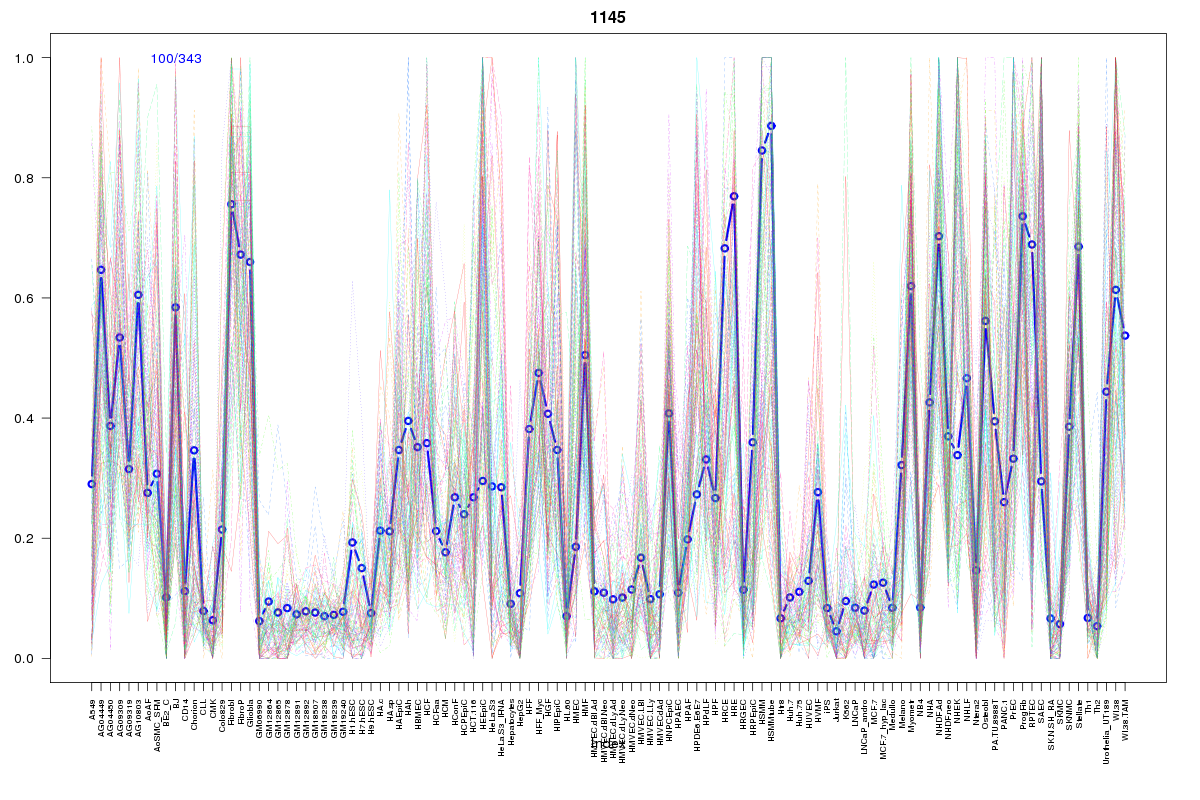 | 1145 | 1 |
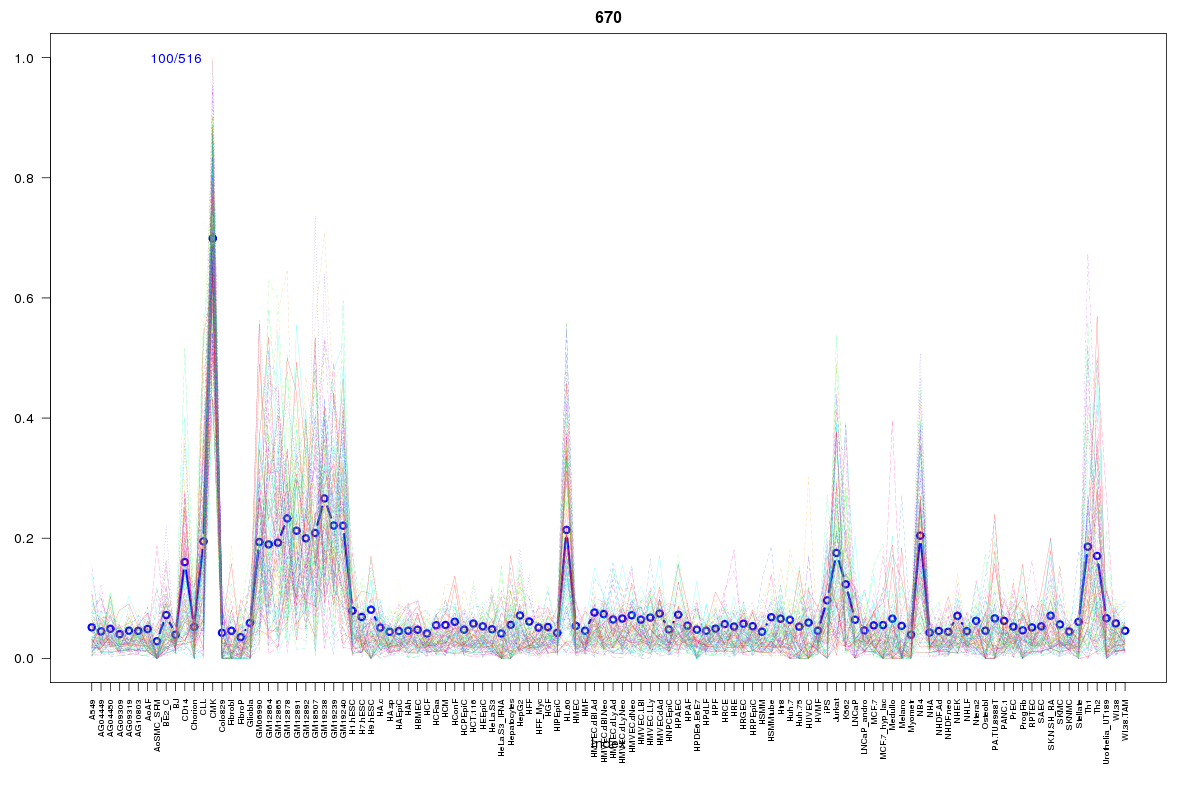 | 670 | 1 |
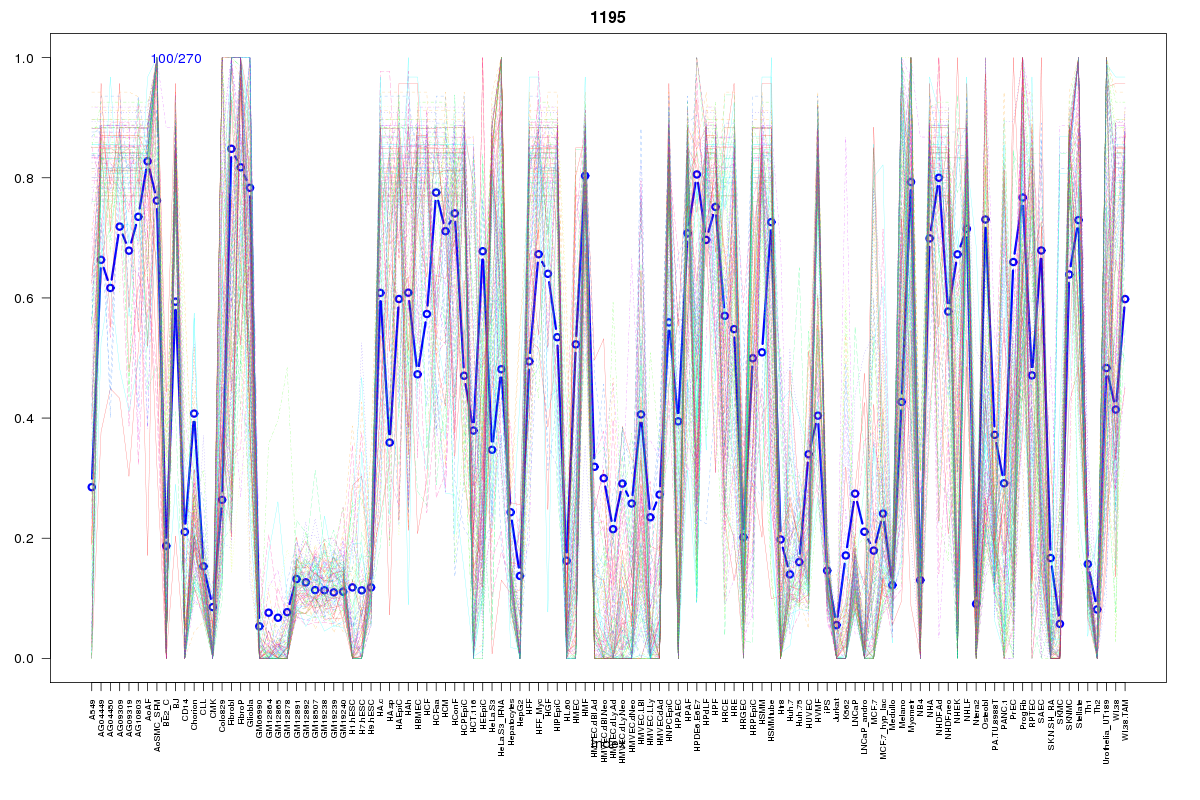 | 1195 | 1 |
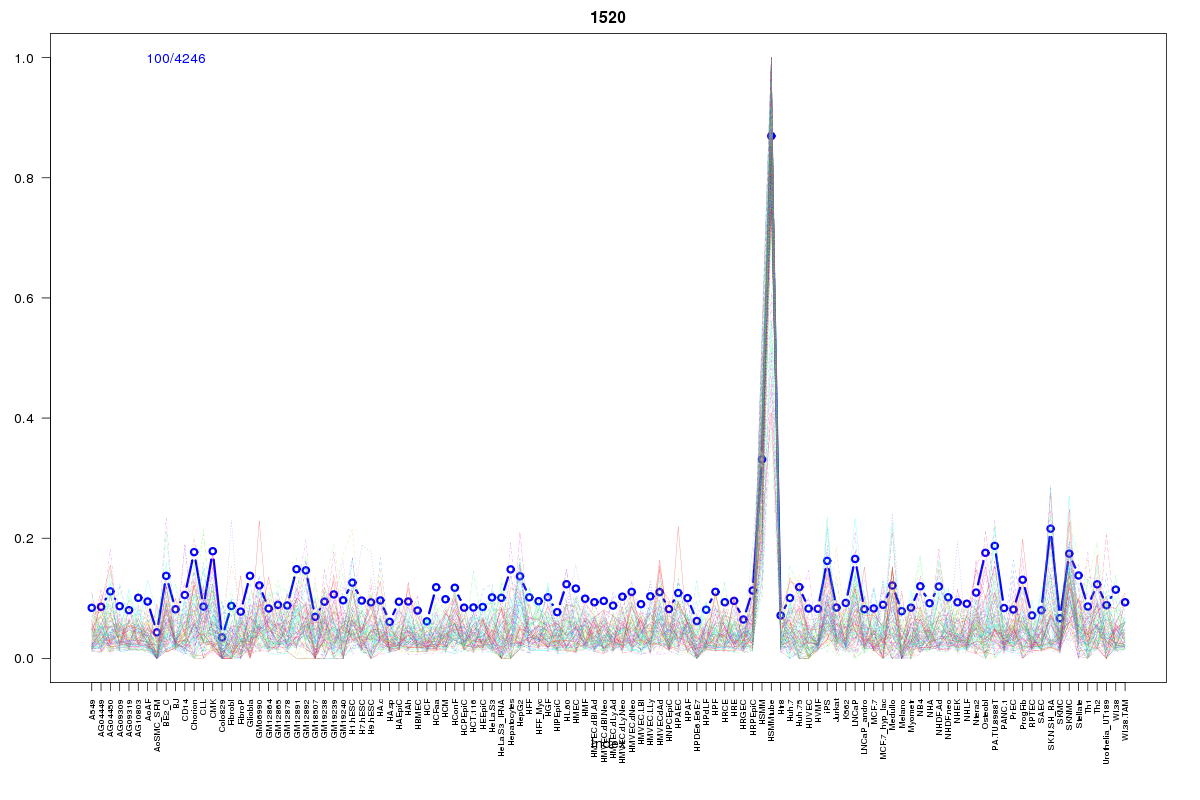 | 1520 | 1 |
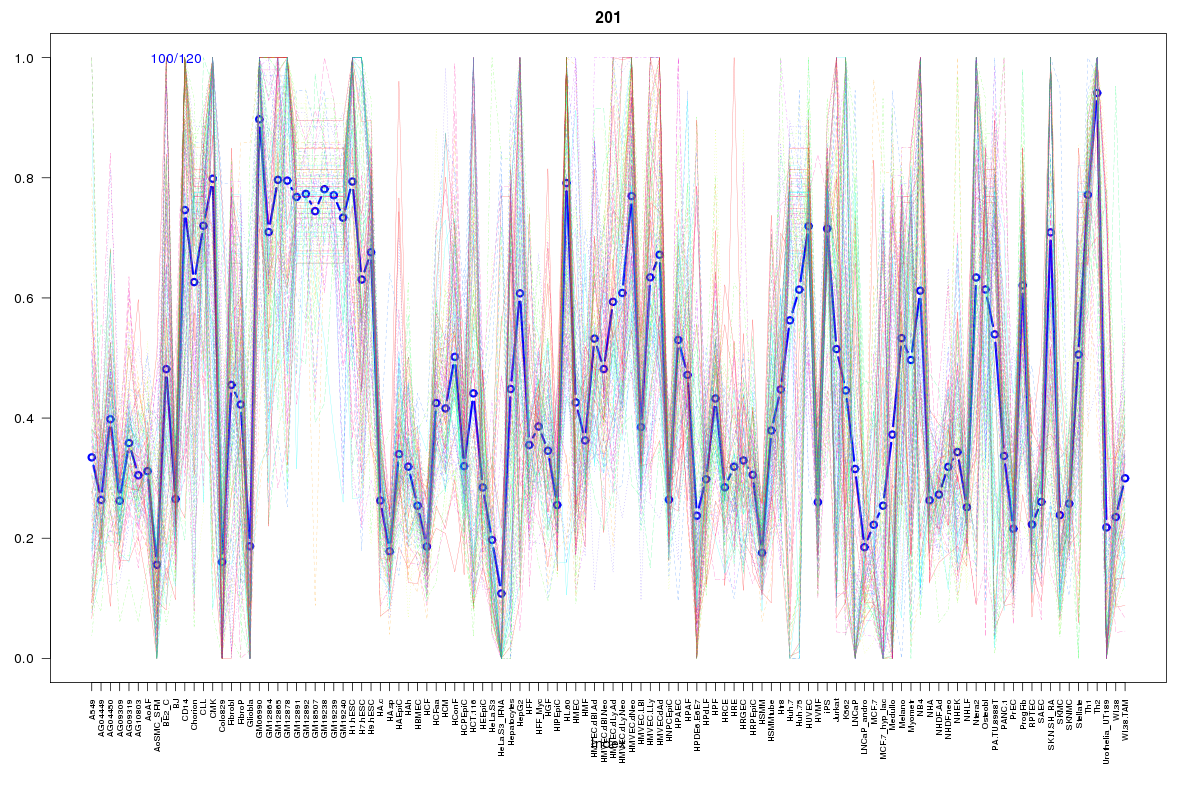 | 201 | 1 |
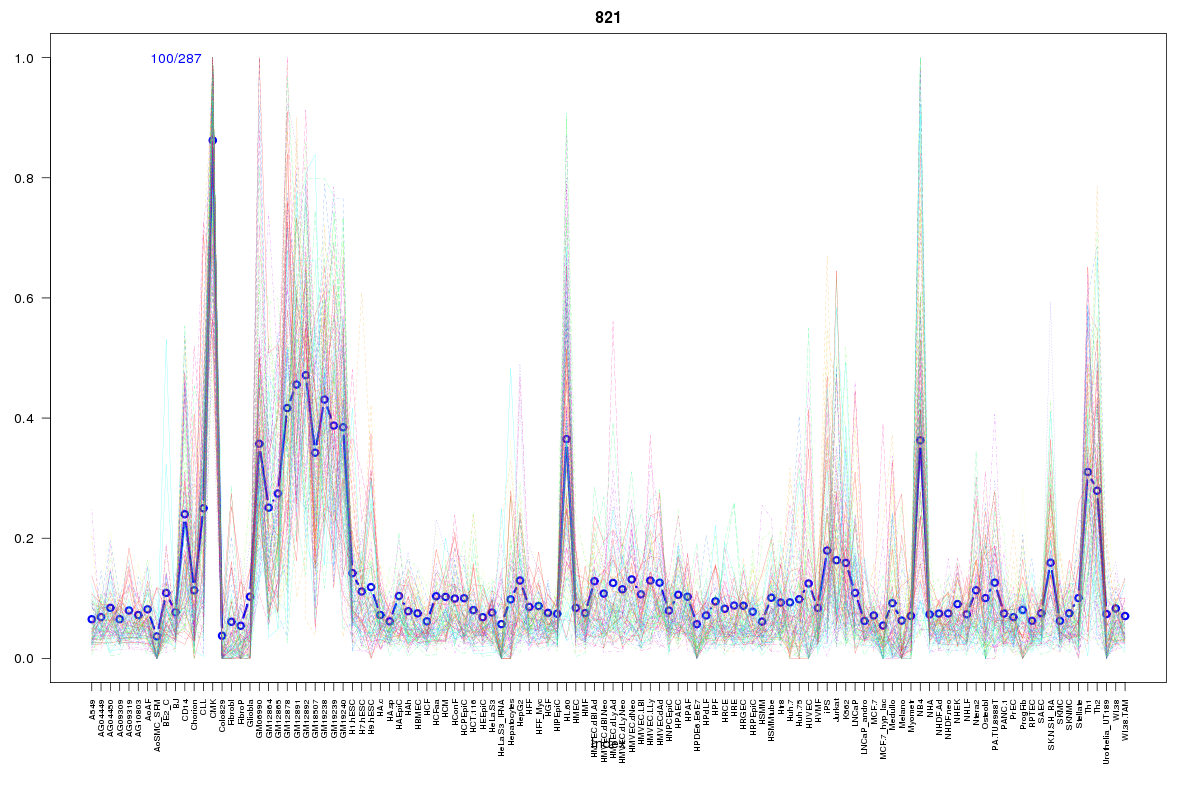 | 821 | 1 |
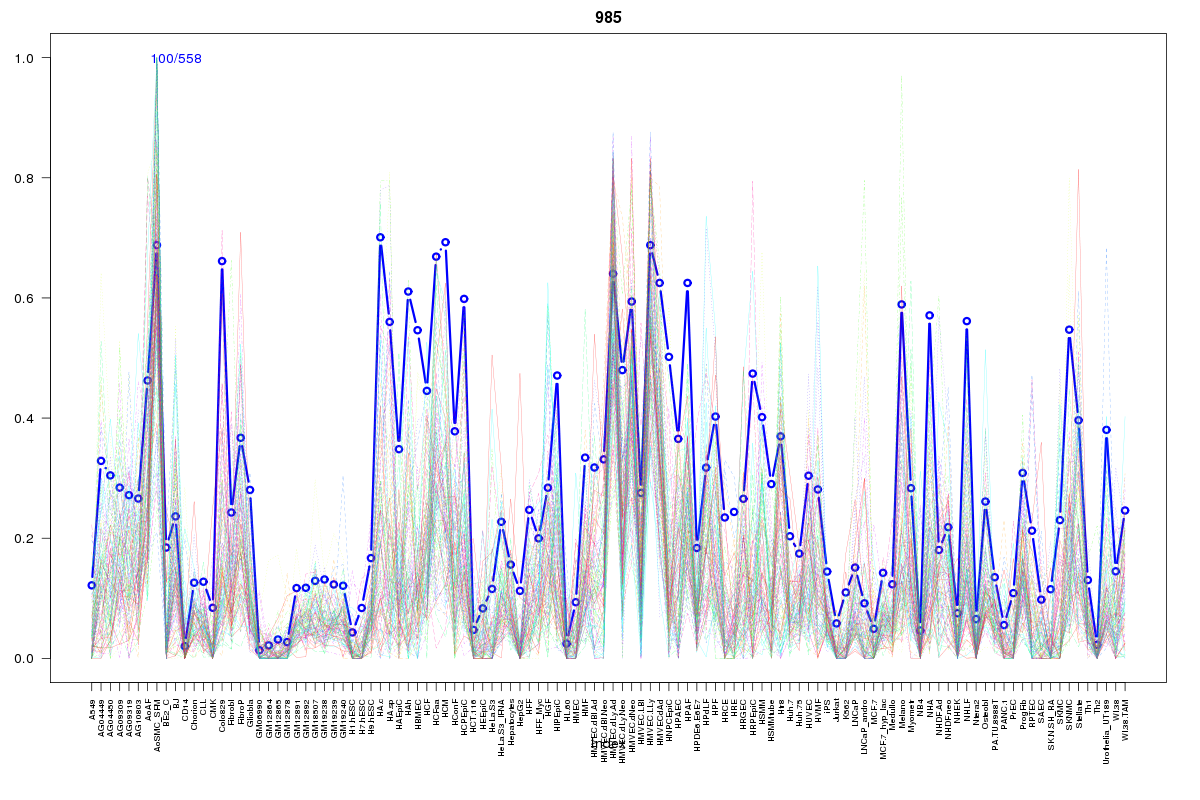 | 985 | 1 |
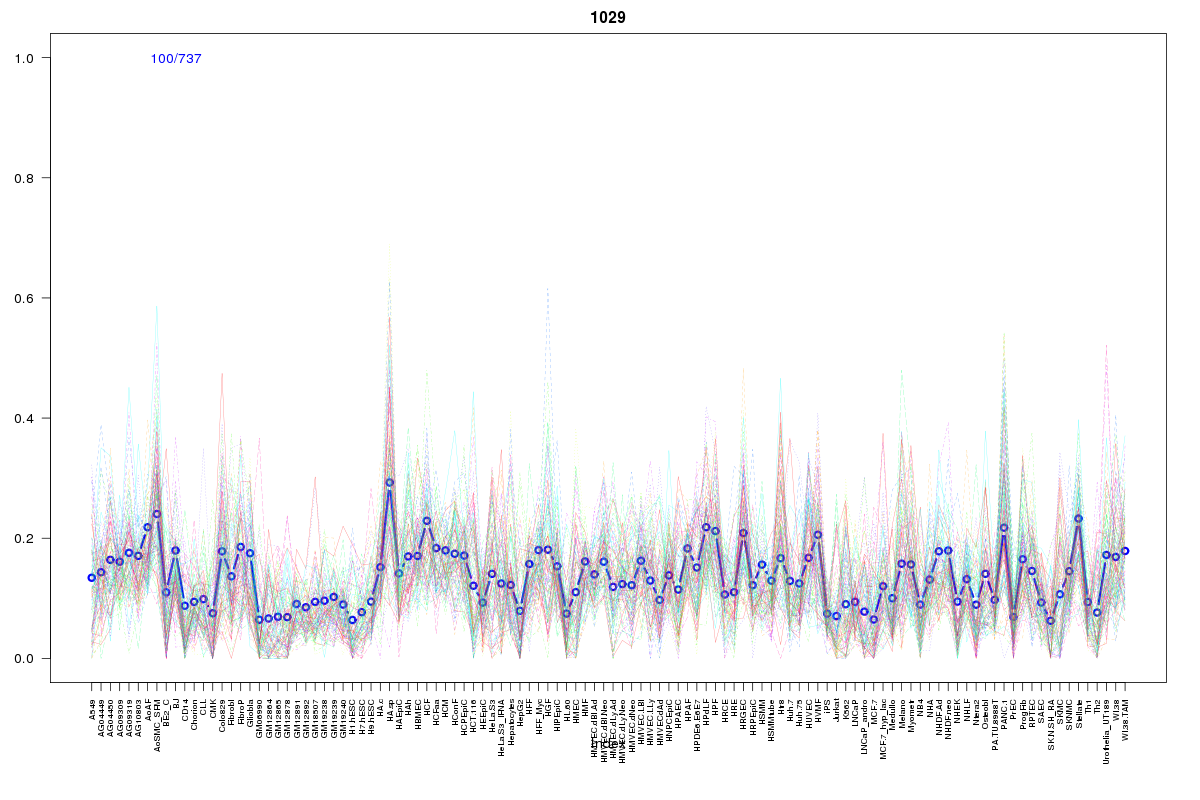 | 1029 | 1 |
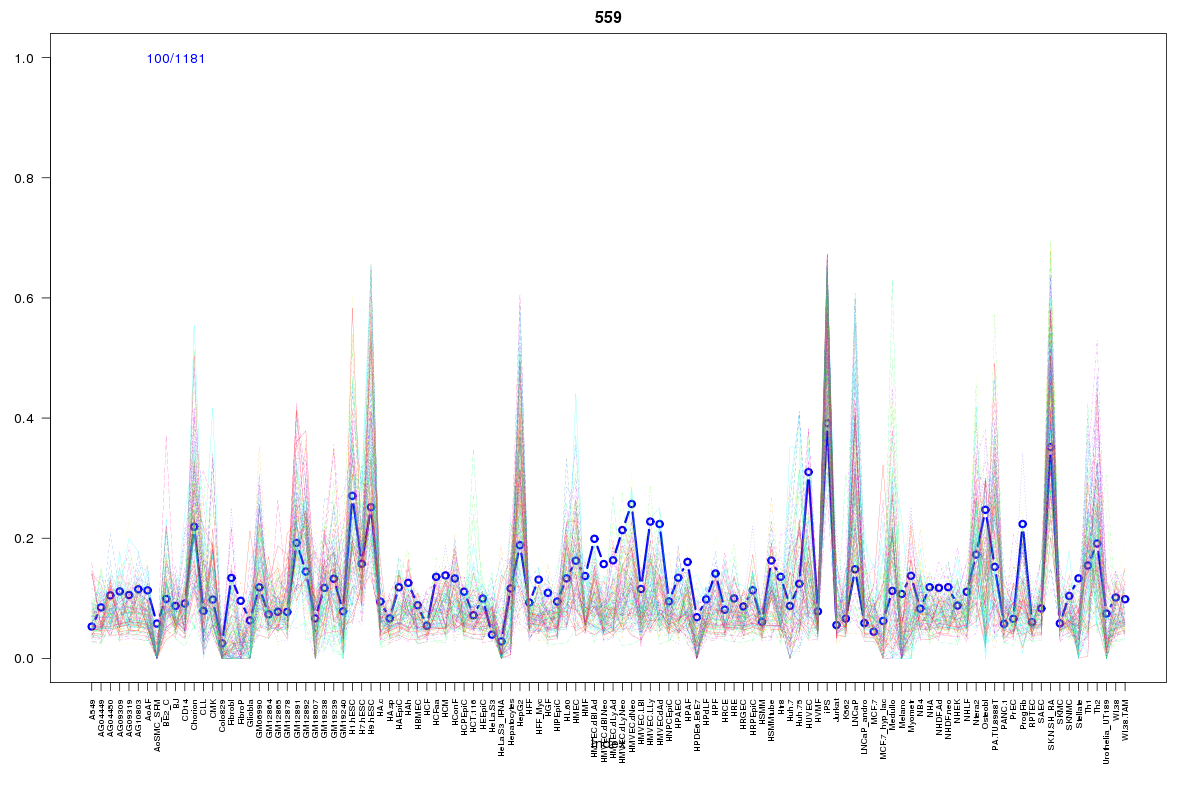 | 559 | 1 |
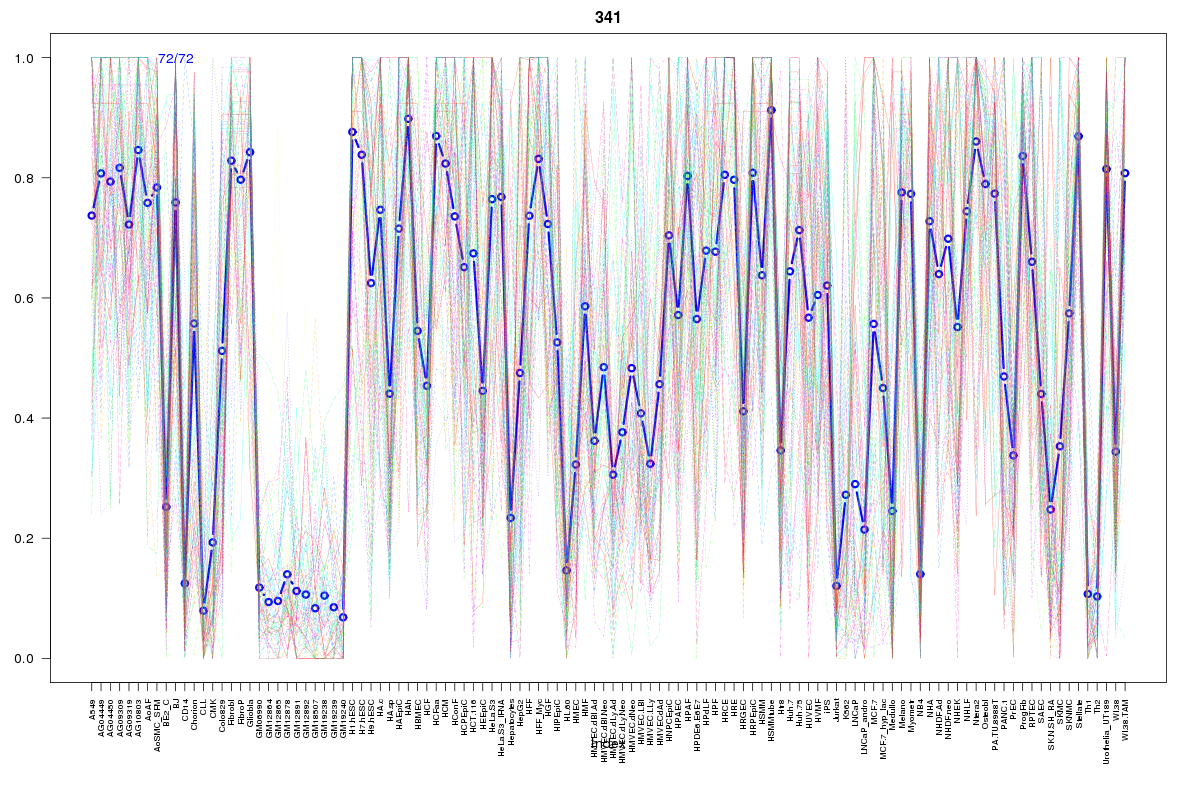 | 341 | 1 |
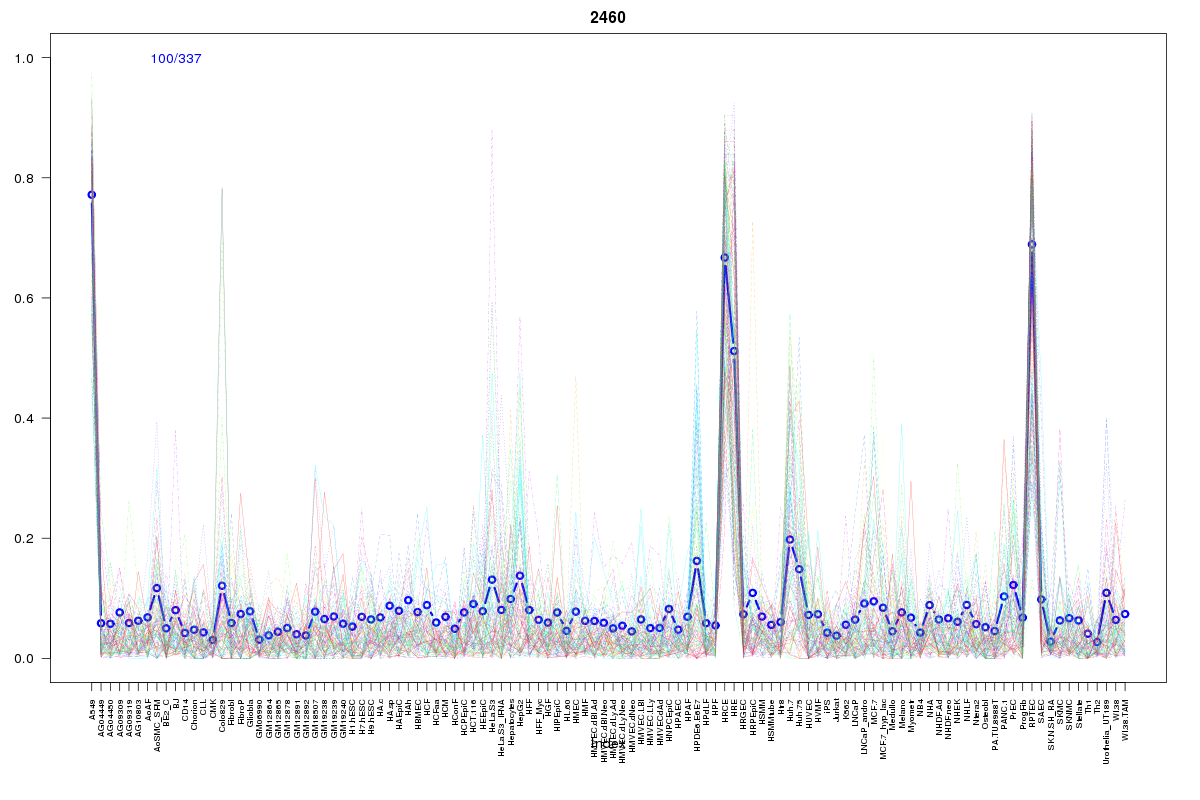 | 2460 | 1 |
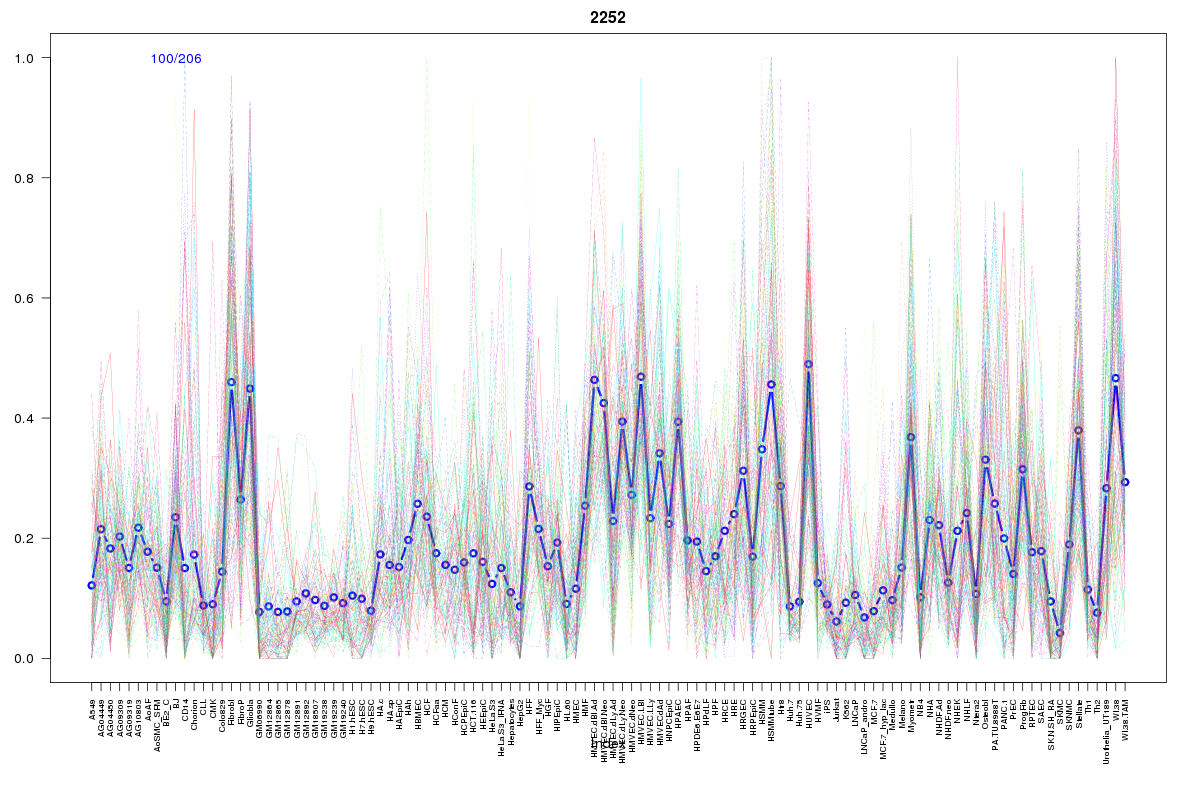 | 2252 | 1 |
 | 432 | 1 |
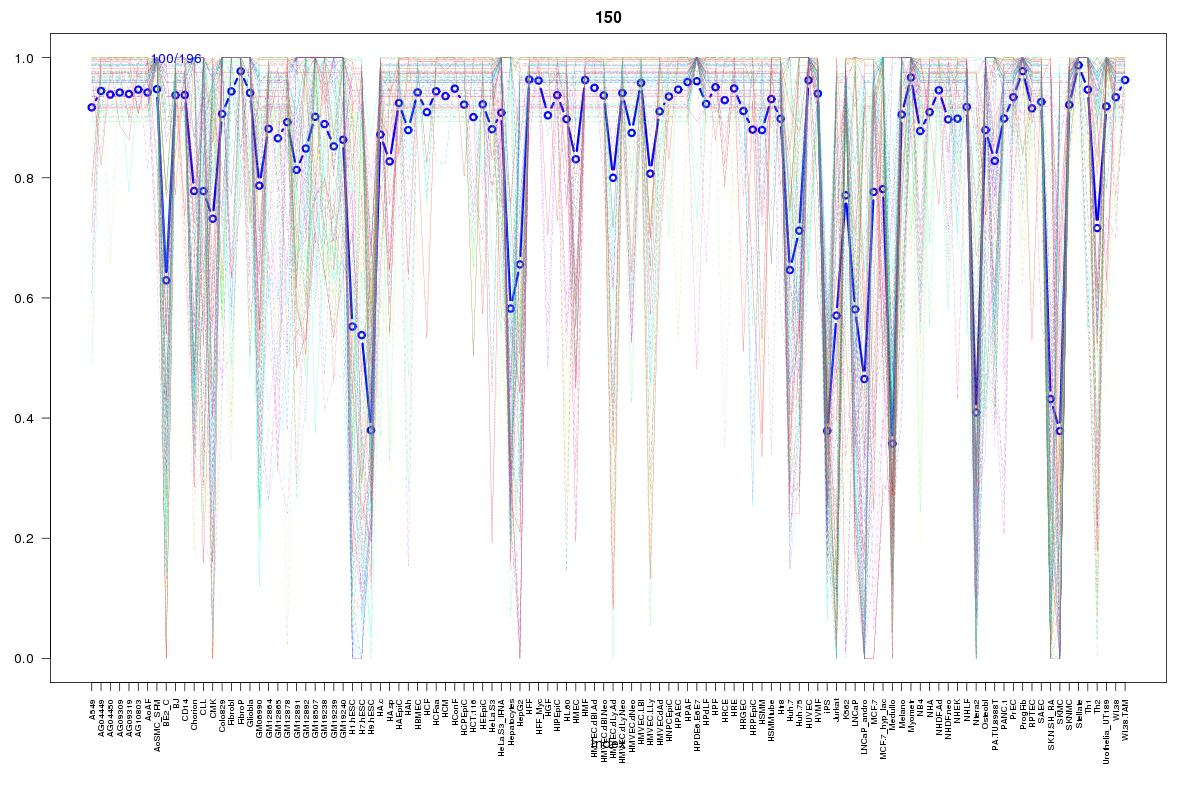 | 150 | 1 |
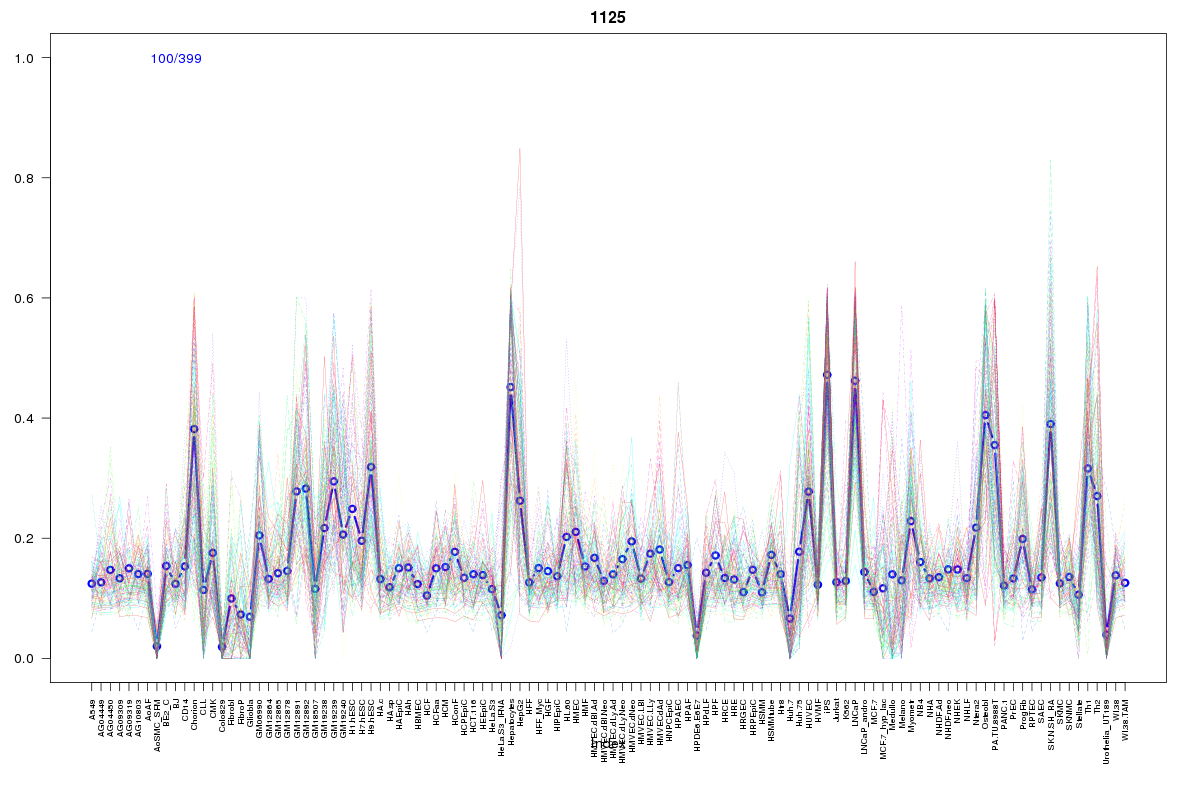 | 1125 | 1 |
 | 862 | 1 |
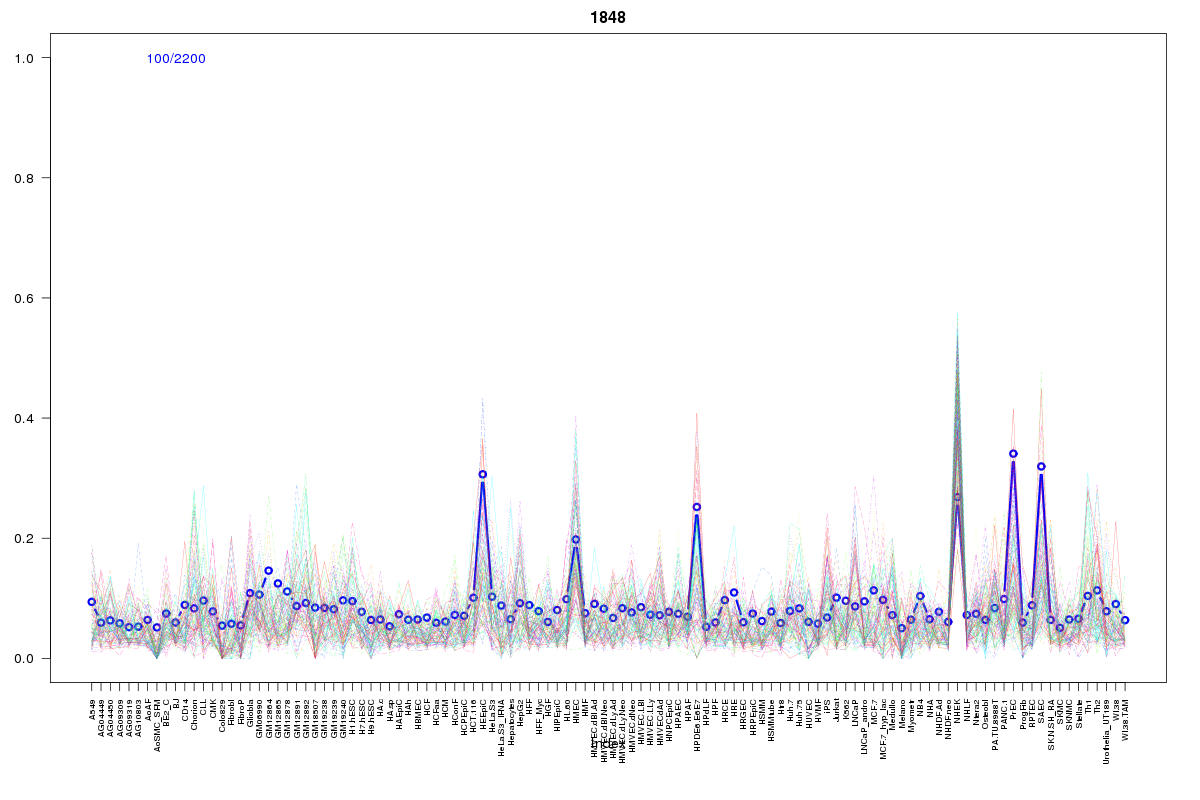 | 1848 | 1 |
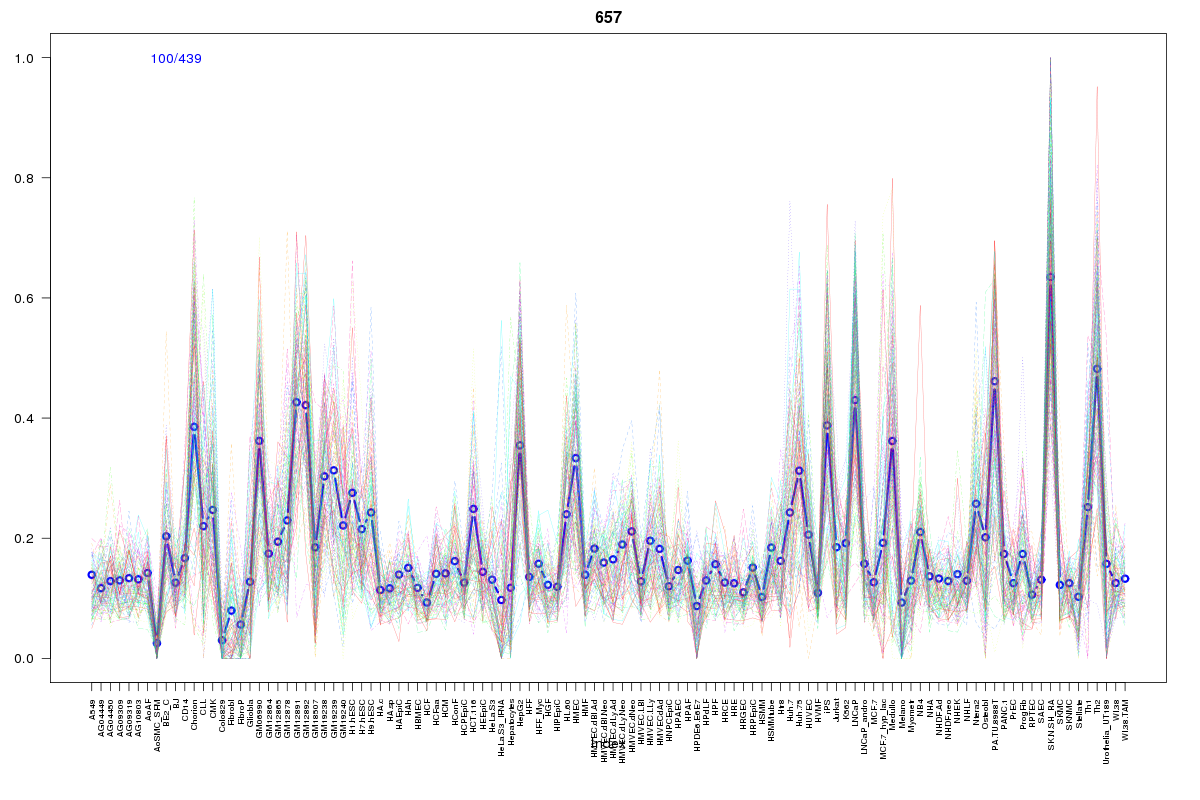 | 657 | 1 |
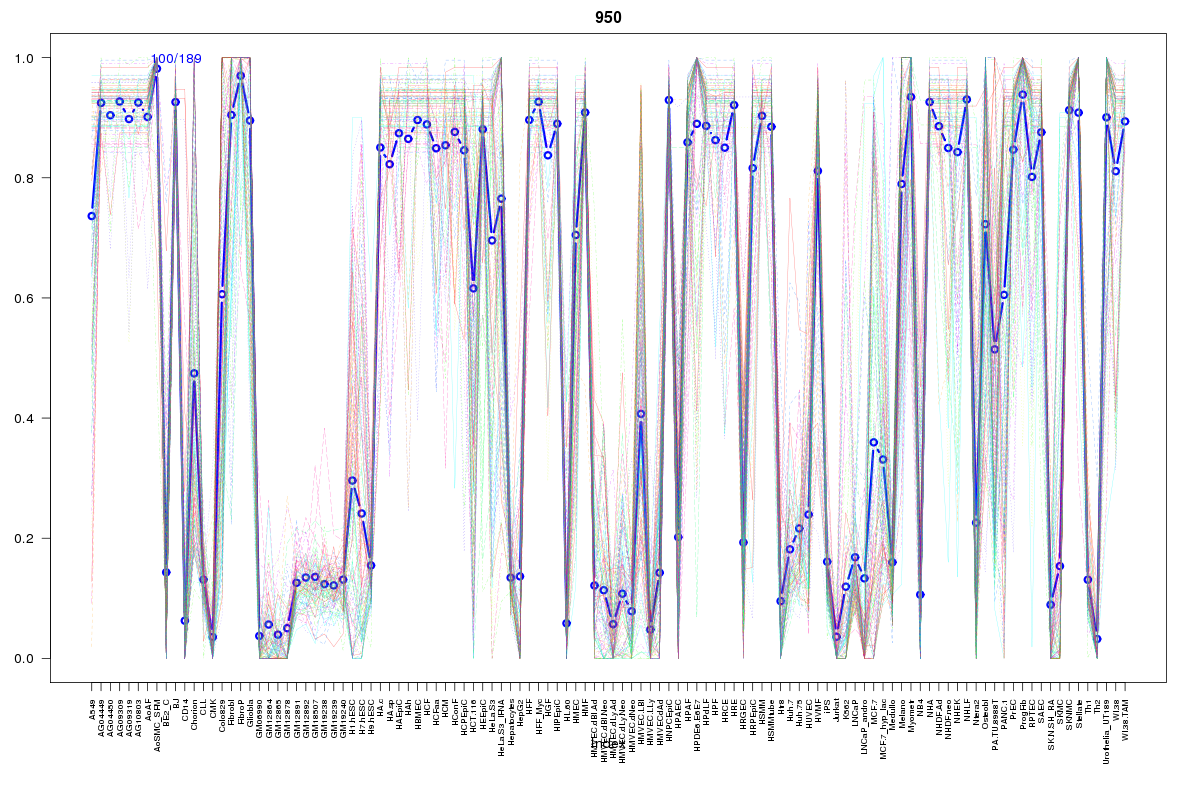 | 950 | 1 |
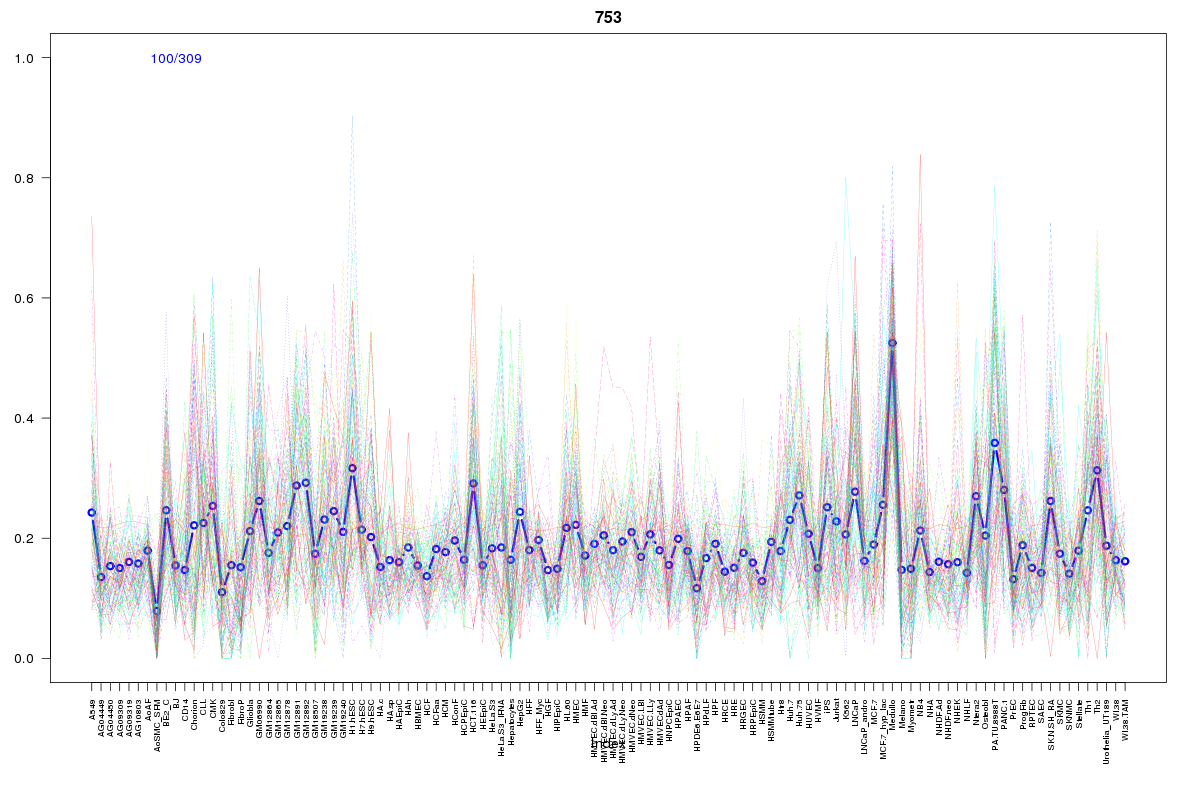 | 753 | 1 |
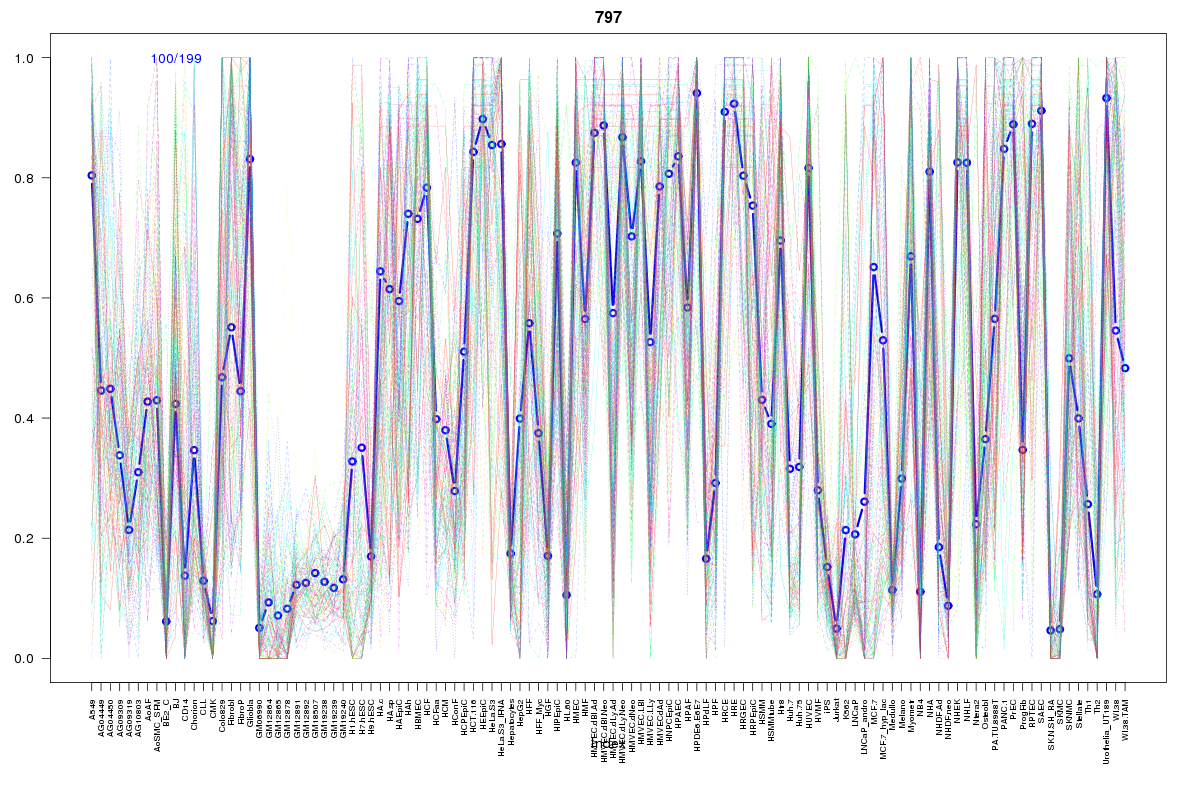 | 797 | 1 |
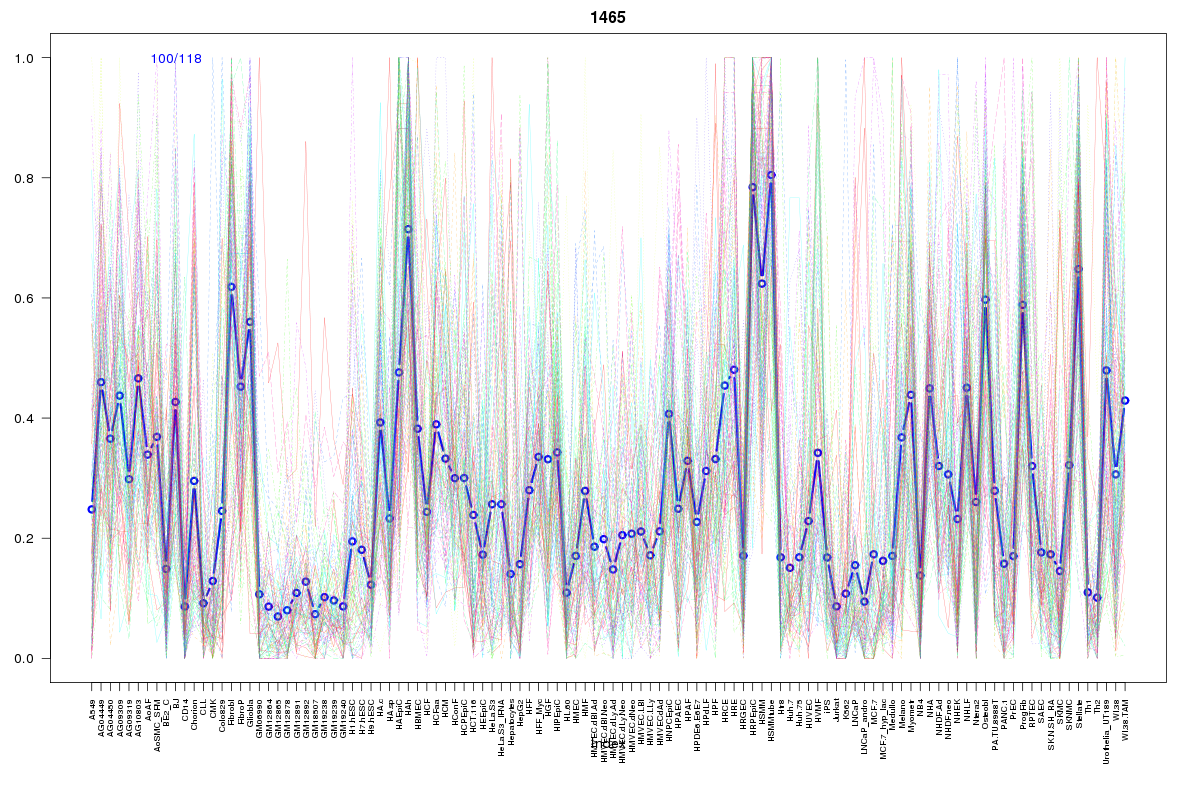 | 1465 | 1 |
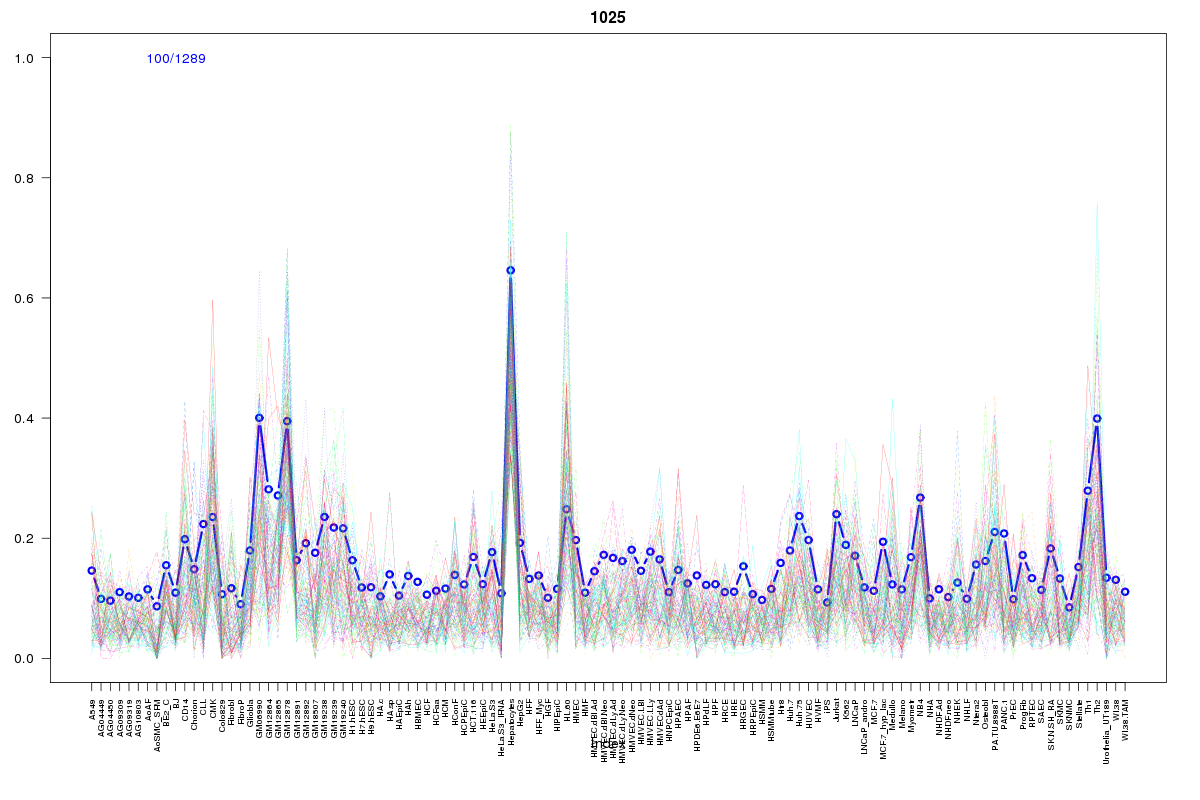 | 1025 | 1 |
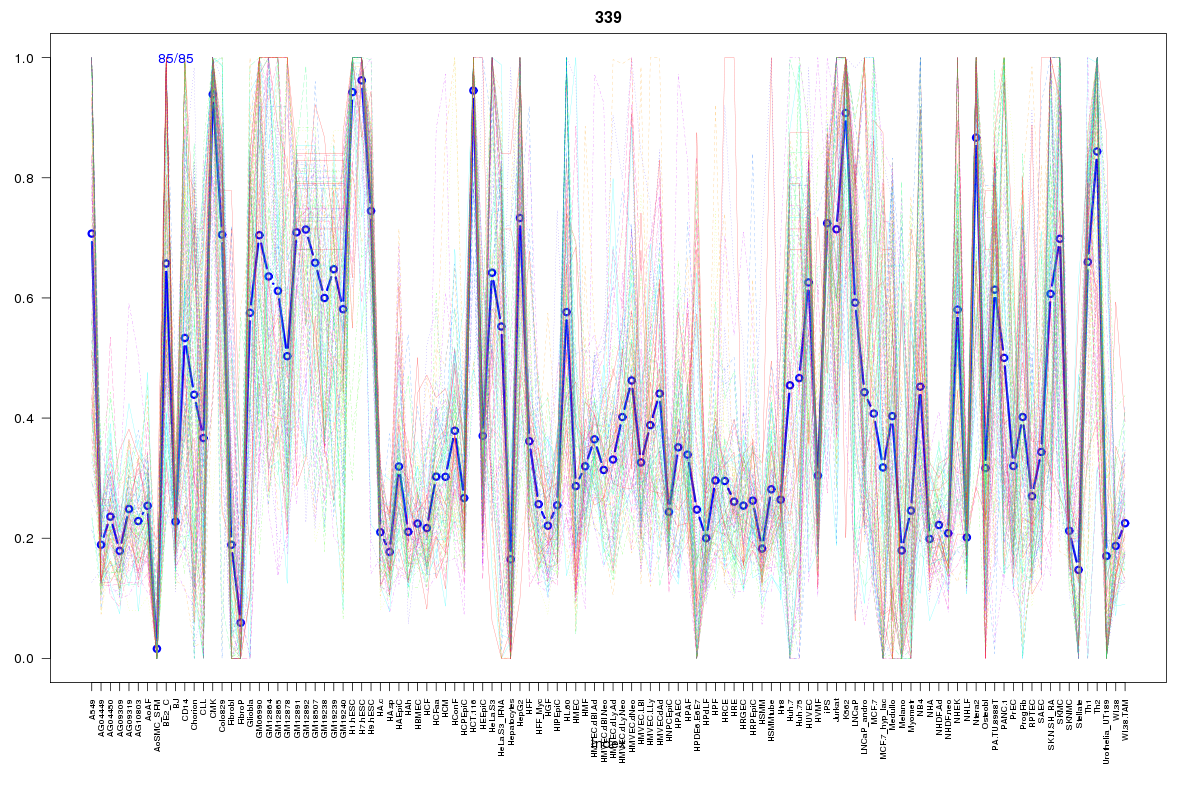 | 339 | 1 |
 | 1659 | 1 |
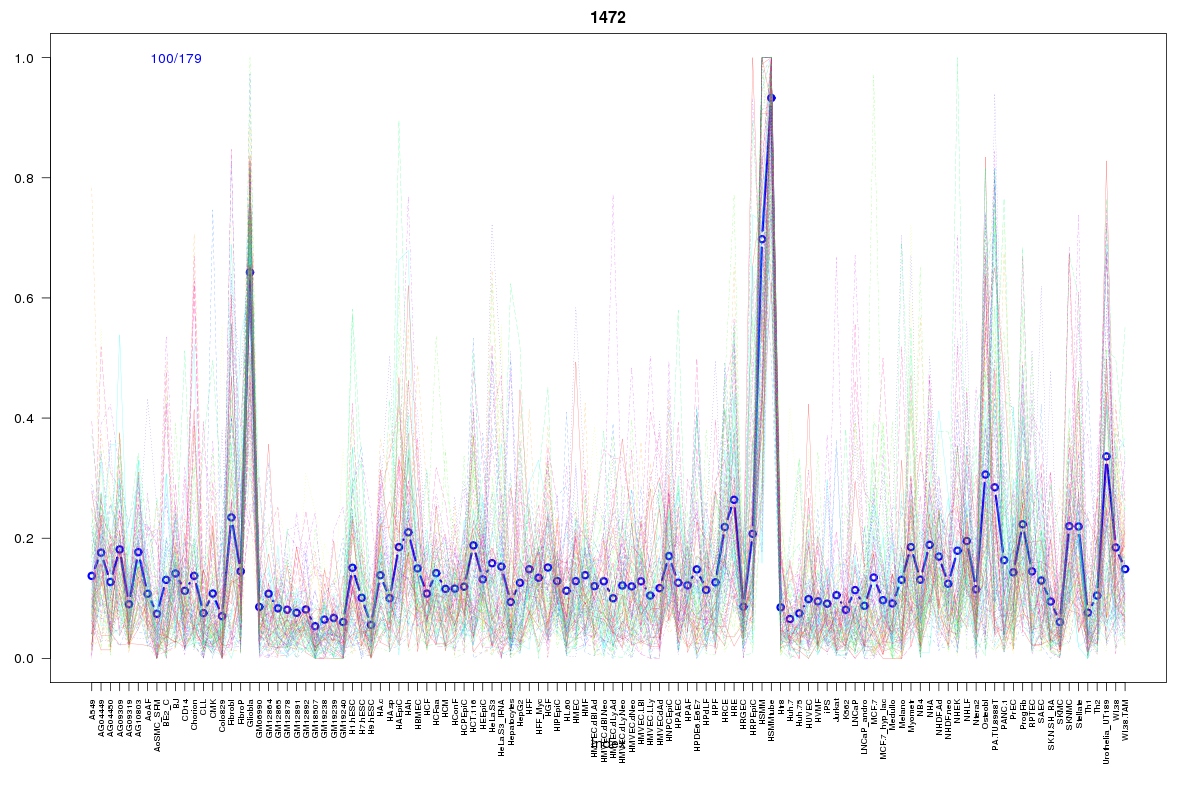 | 1472 | 1 |
 | 402 | 1 |
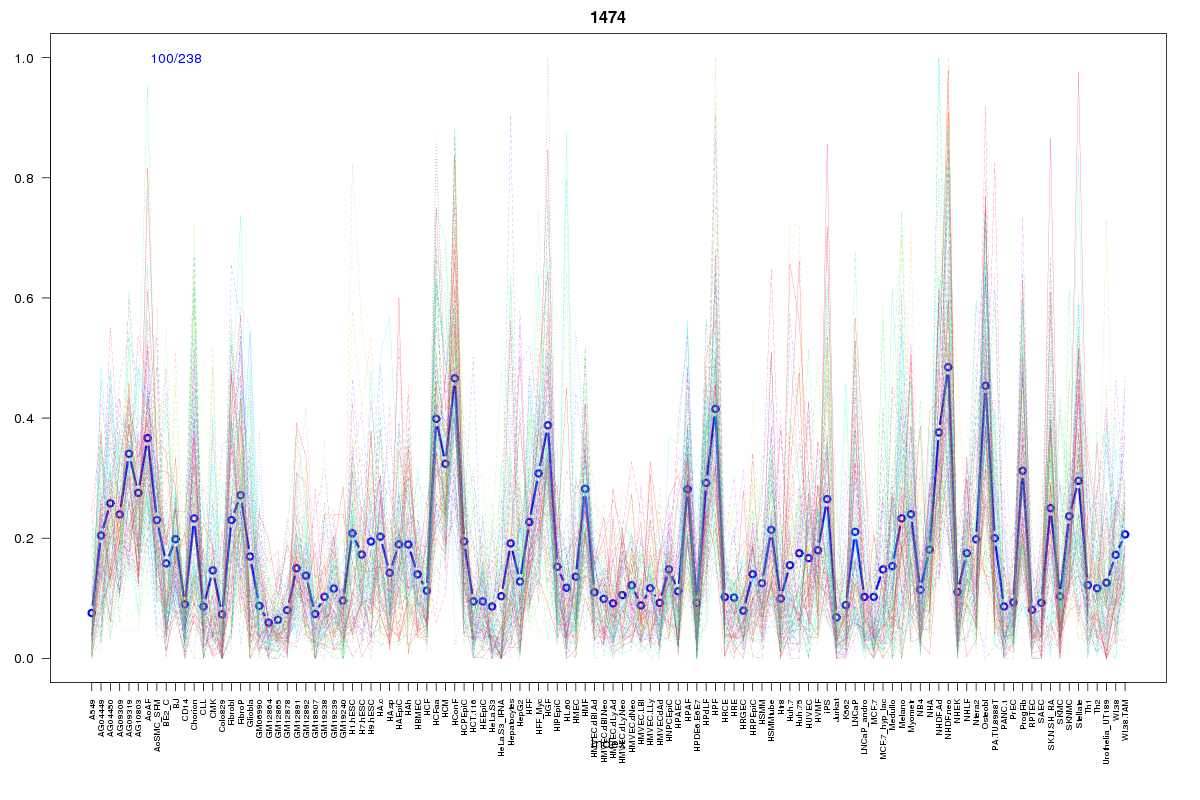 | 1474 | 1 |
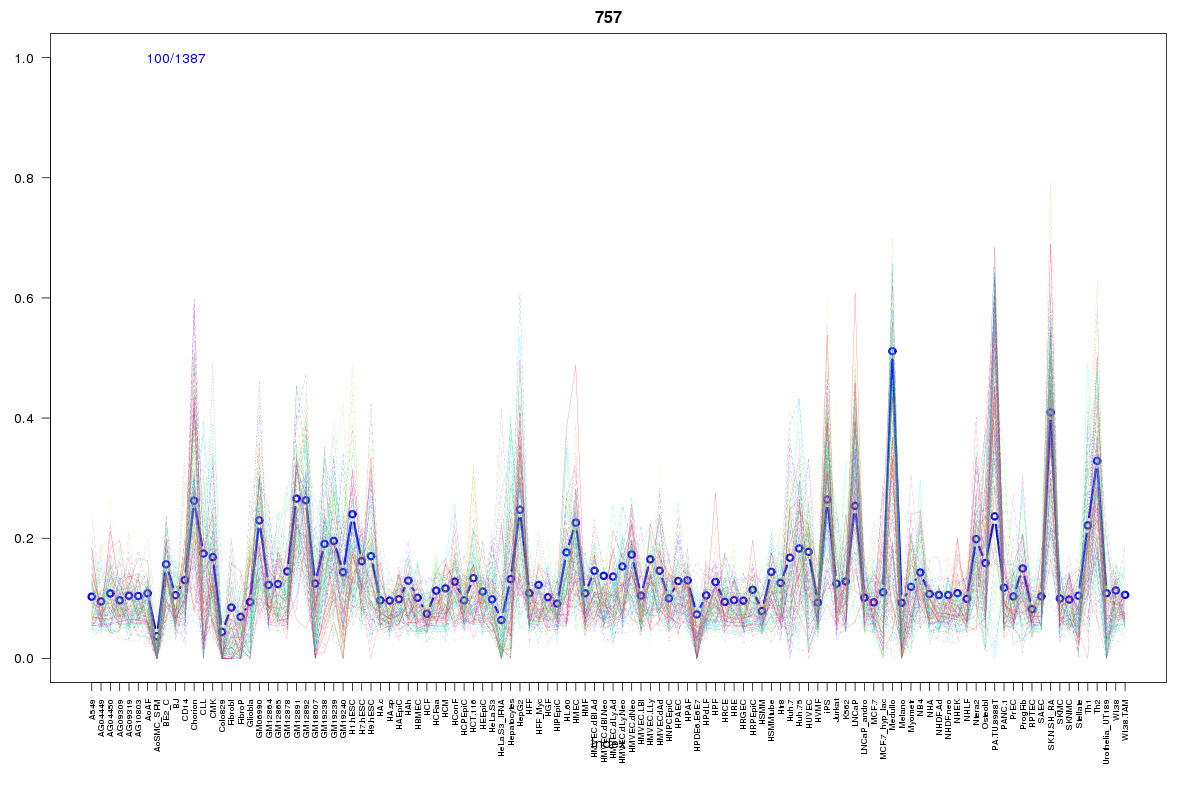 | 757 | 1 |
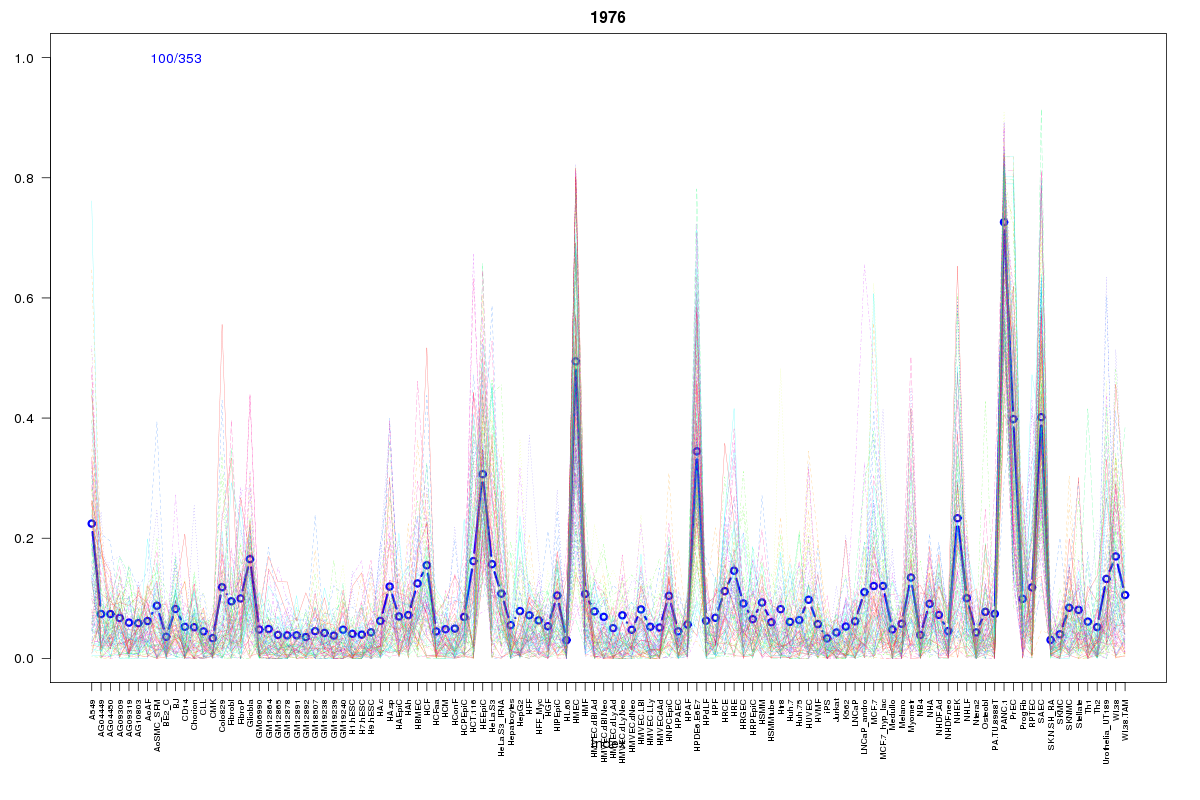 | 1976 | 1 |
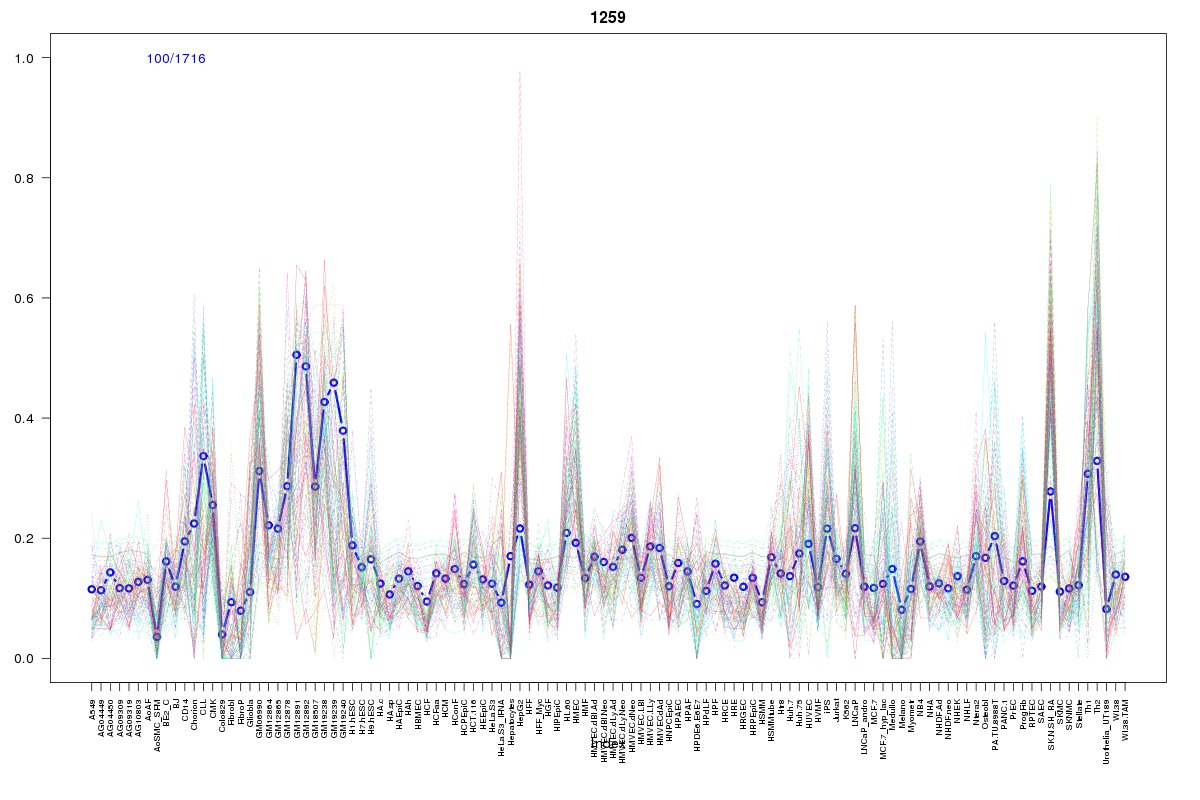 | 1259 | 1 |
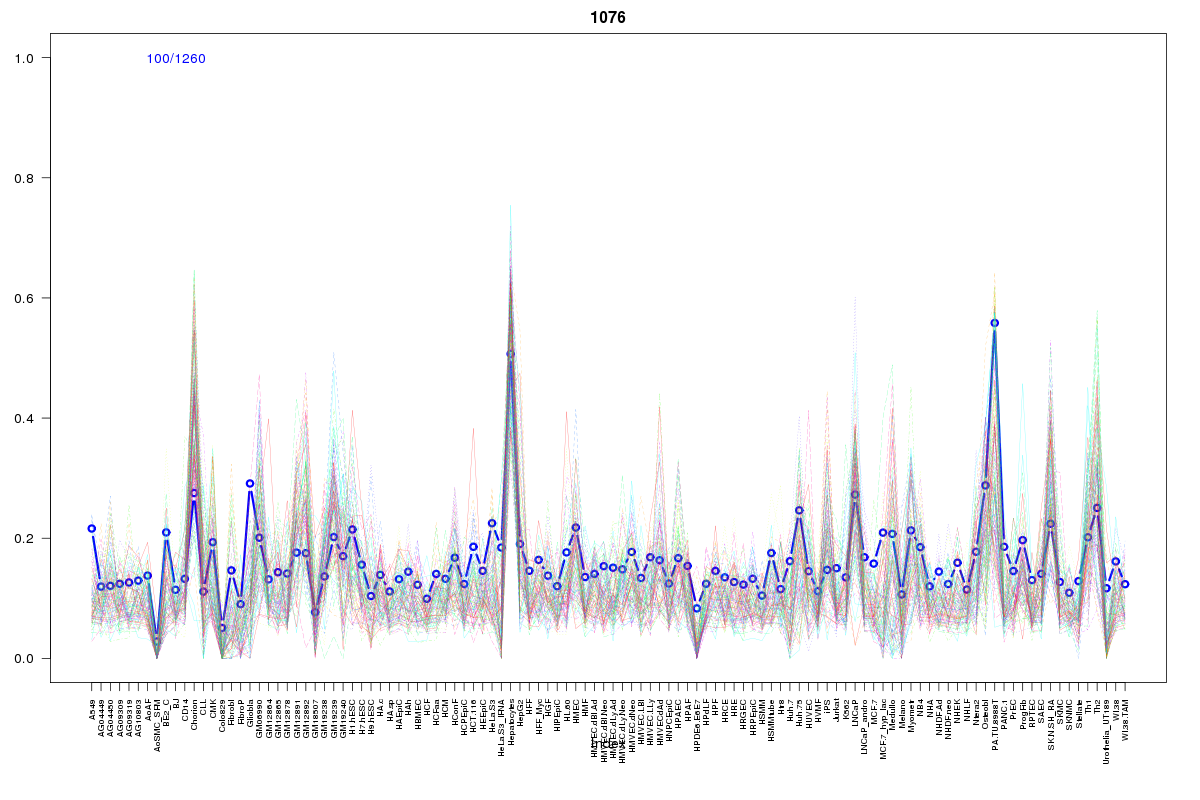 | 1076 | 1 |
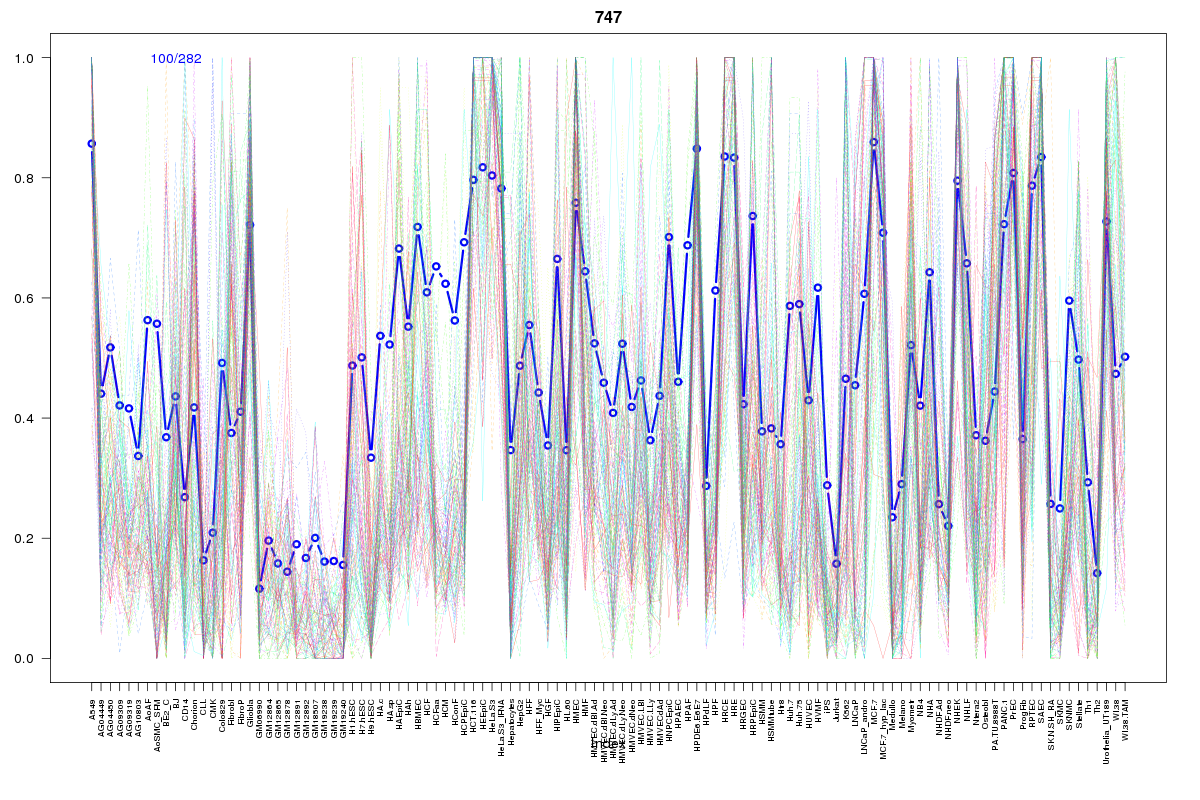 | 747 | 1 |
 | 1779 | 1 |
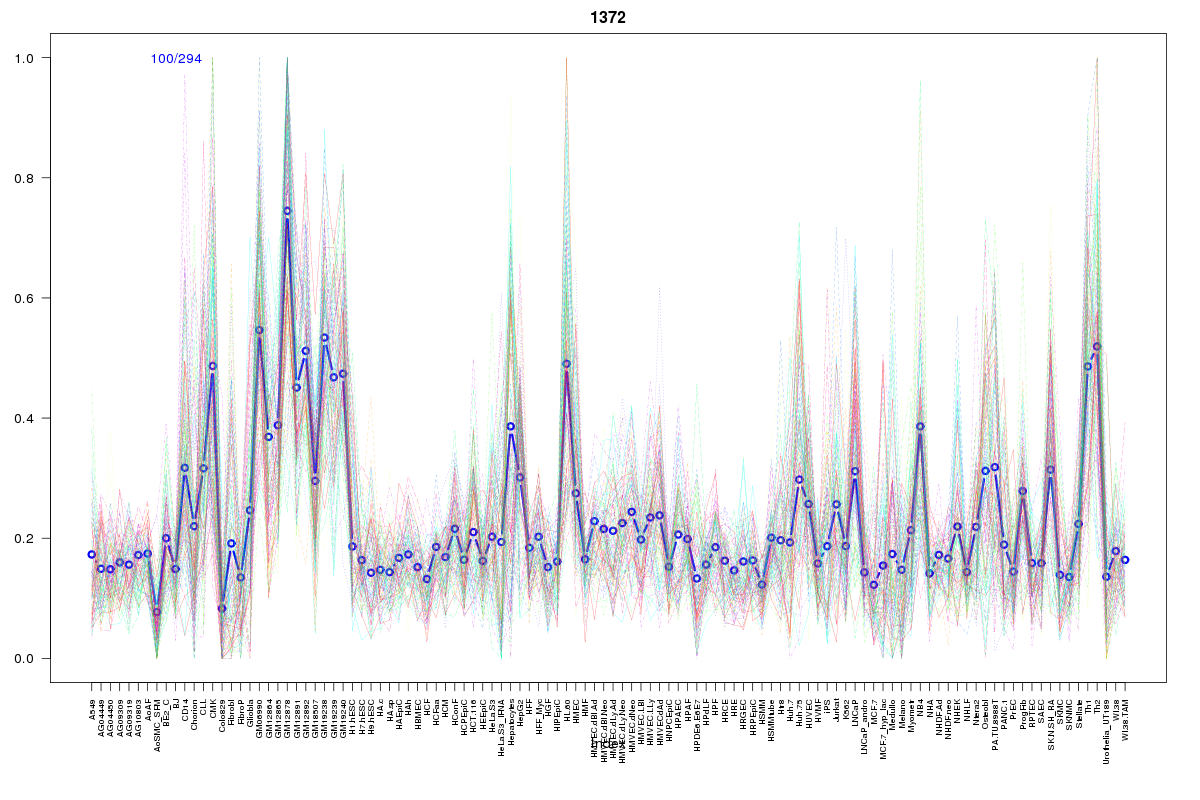 | 1372 | 1 |
Resources
BED file downloads
Connects to 82 DHS sitesTop 10 Correlated DHS Sites
p-values indiciate significant higher or lower correlationExternal Databases
UCSCEnsembl (ENSG00000005884)