Gene: FMO3
chr1: 171060017-171086955Expression Profile
(log scale)
Graphical Connections
Distribution of linked clusters:
You may find it interesting if many of the connected DHS sites belong to the same cluster.| Cluster Profile | Cluster ID | Number of DHS sites in this cluster |
|---|---|---|
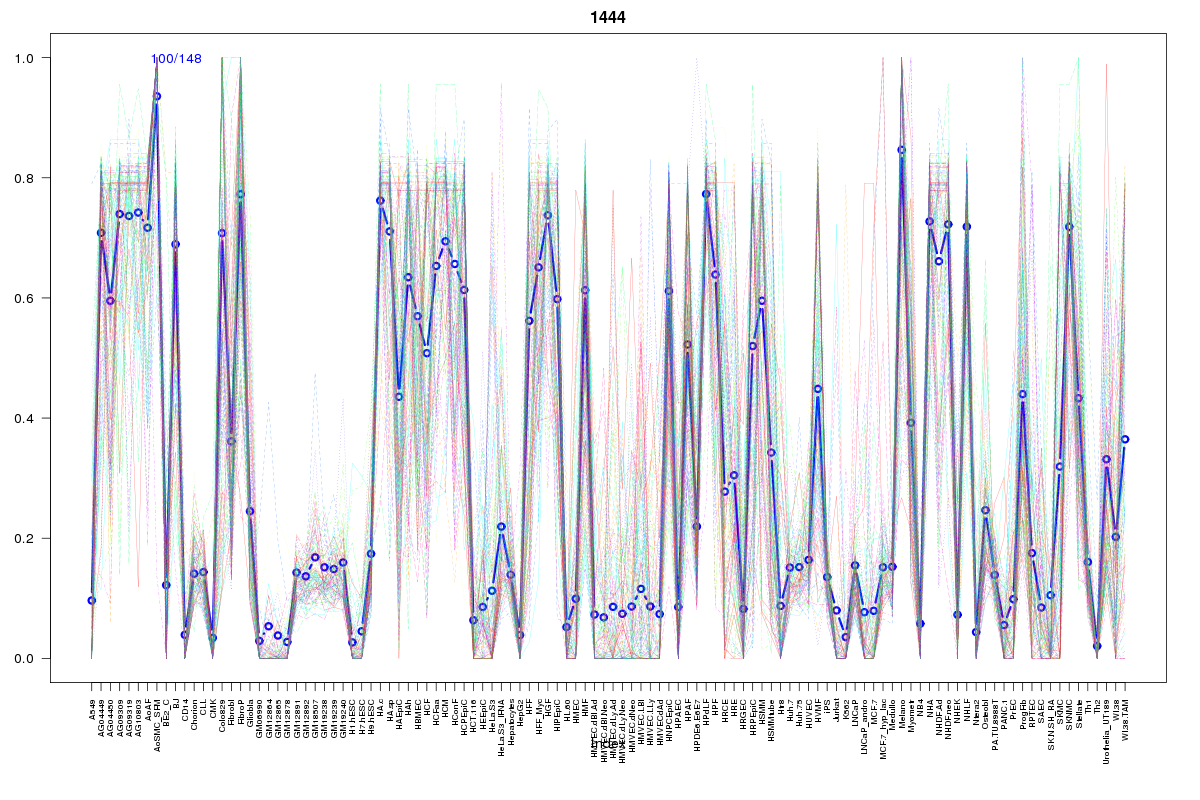 | 1444 | 3 |
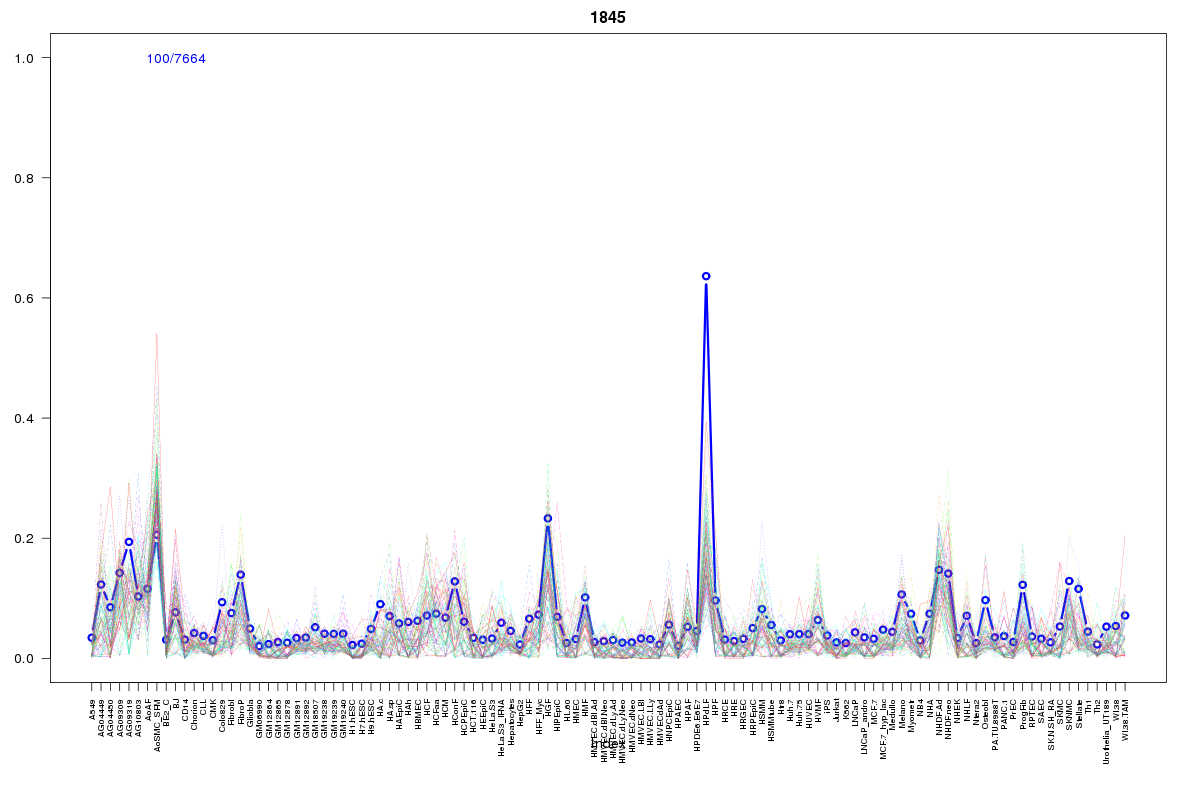 | 1845 | 1 |
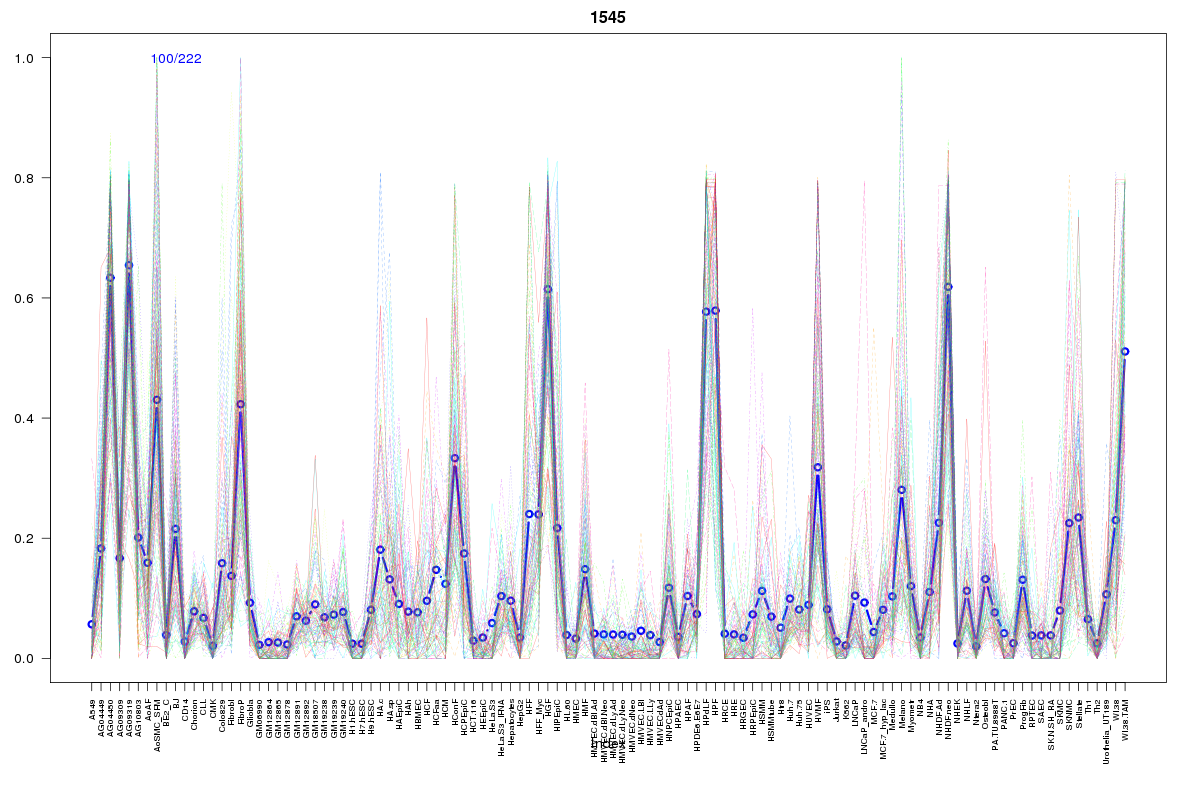 | 1545 | 1 |
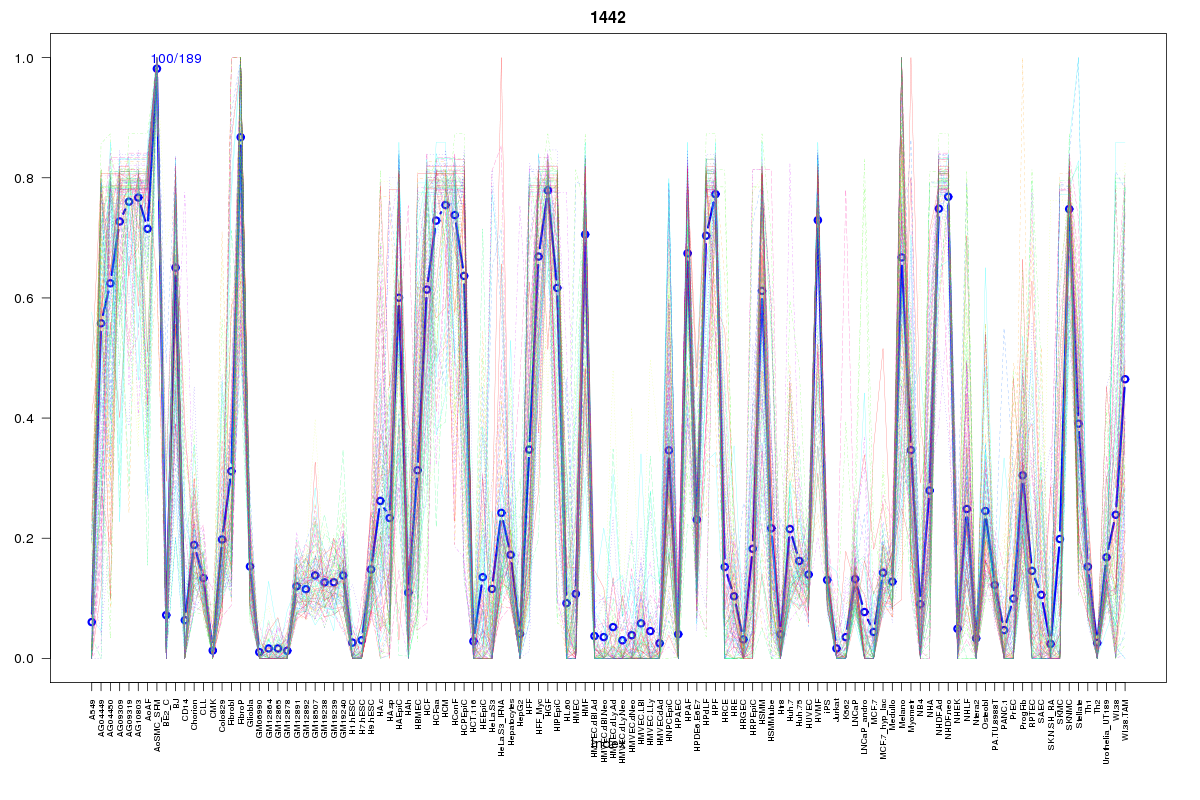 | 1442 | 1 |
Resources
BED file downloads
Connects to 6 DHS sitesTop 10 Correlated DHS Sites
p-values indiciate significant higher or lower correlation| Location | Cluster | P-value |
|---|---|---|
| chr1:171096740-171096890 | 1444 | 0.014 |
| chr1:171085940-171086090 | 1545 | 0.018 |
| chr1:171110840-171110990 | 1444 | 0.019 |
| chr1:171076760-171076910 | 1845 | 0.02 |
| chr1:171111000-171111150 | 1444 | 0.023 |
| chr1:171111800-171111950 | 1442 | 0.024 |
External Databases
UCSCEnsembl (ENSG00000007933)