Gene: FMO1
chr1: 171217637-171255117Expression Profile
(log scale)
Graphical Connections
Distribution of linked clusters:
You may find it interesting if many of the connected DHS sites belong to the same cluster.| Cluster Profile | Cluster ID | Number of DHS sites in this cluster |
|---|---|---|
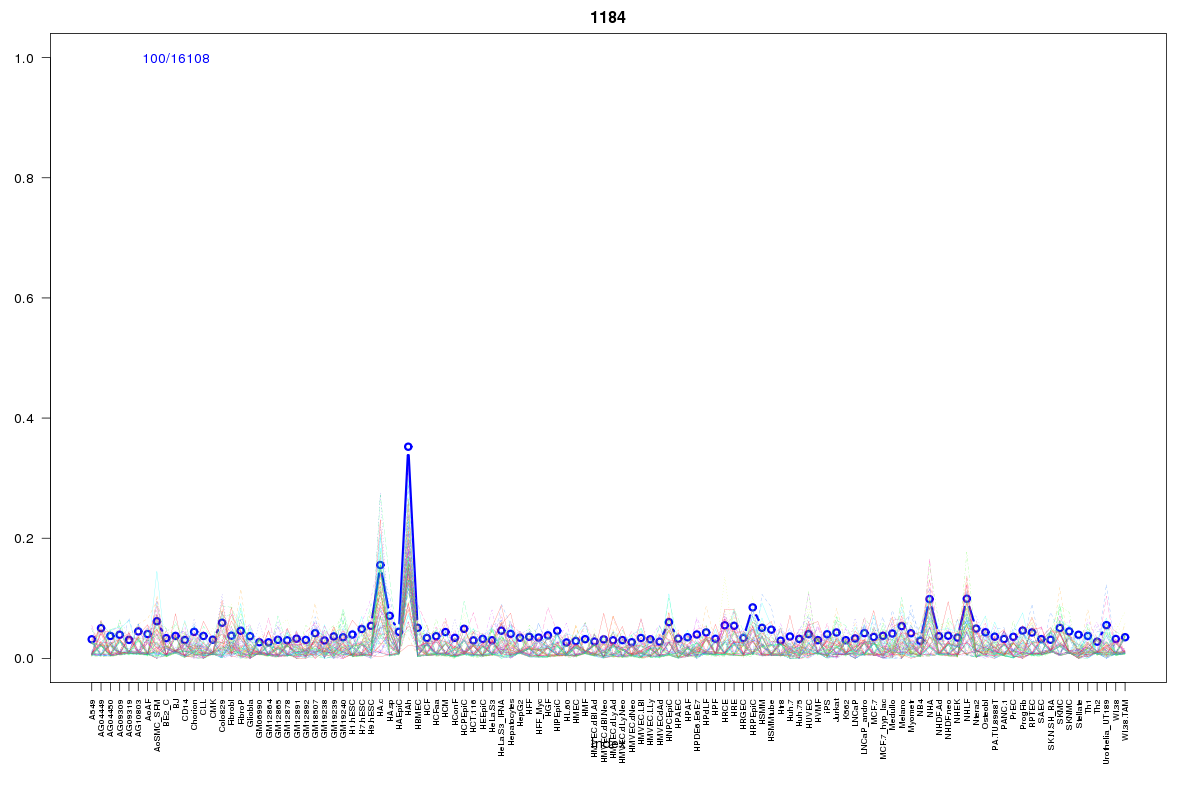 | 1184 | 2 |
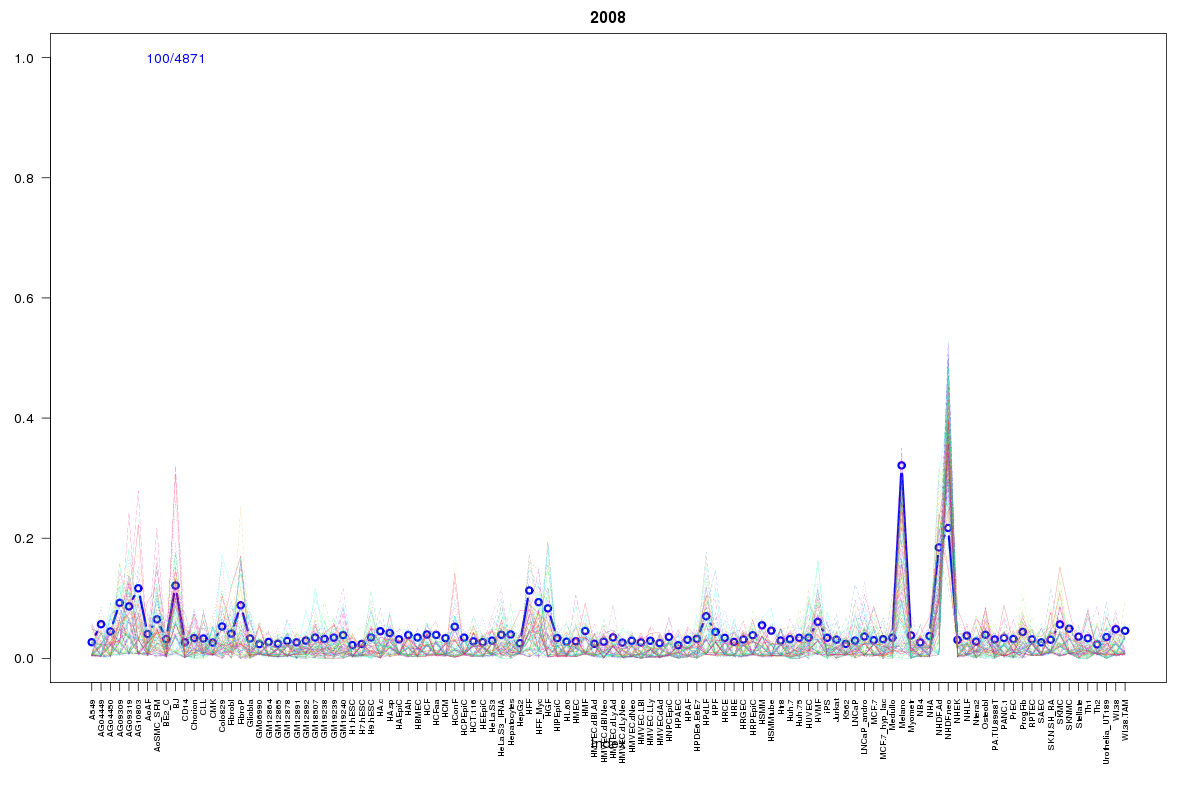 | 2008 | 1 |
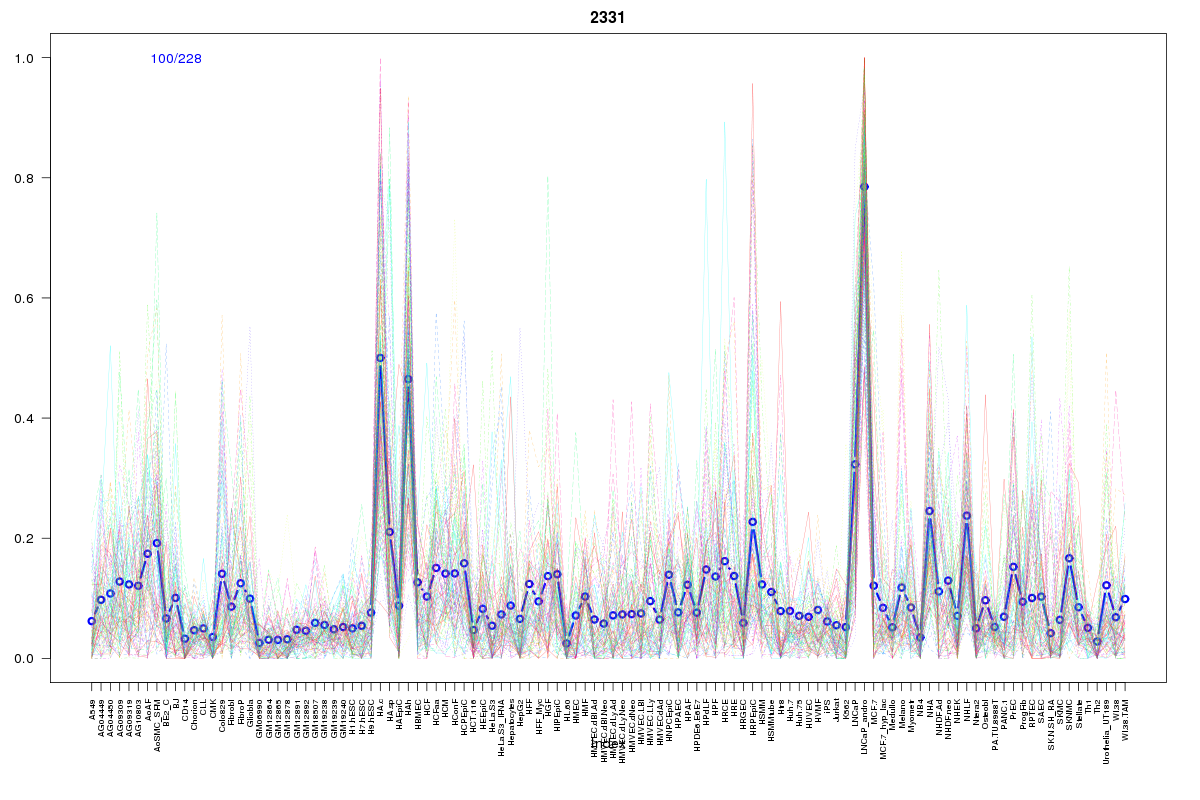 | 2331 | 1 |
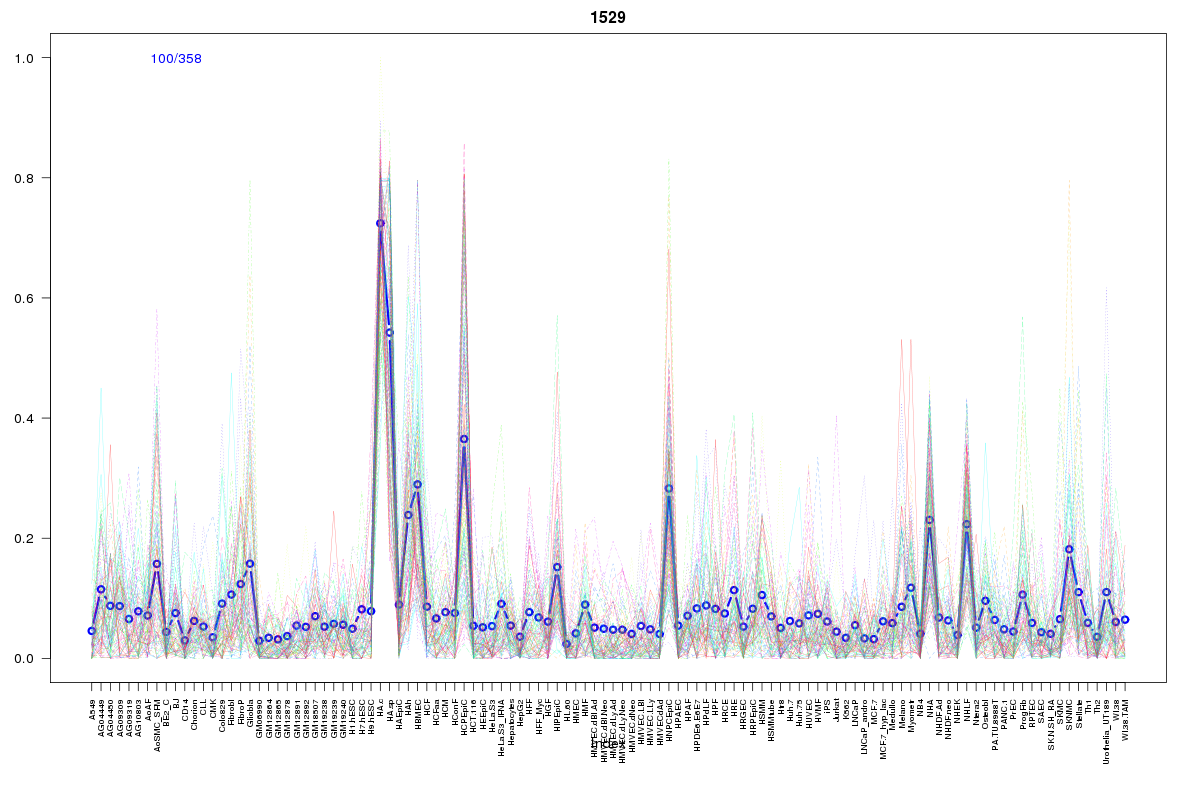 | 1529 | 1 |
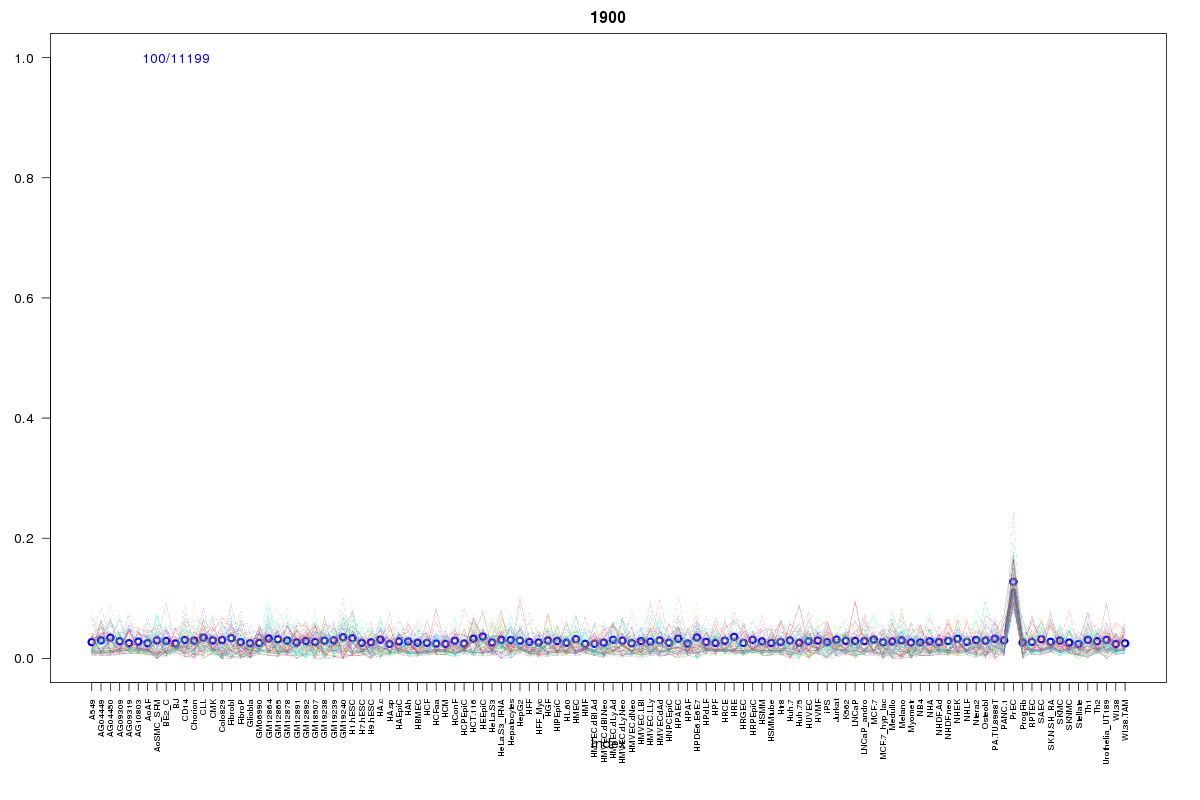 | 1900 | 1 |
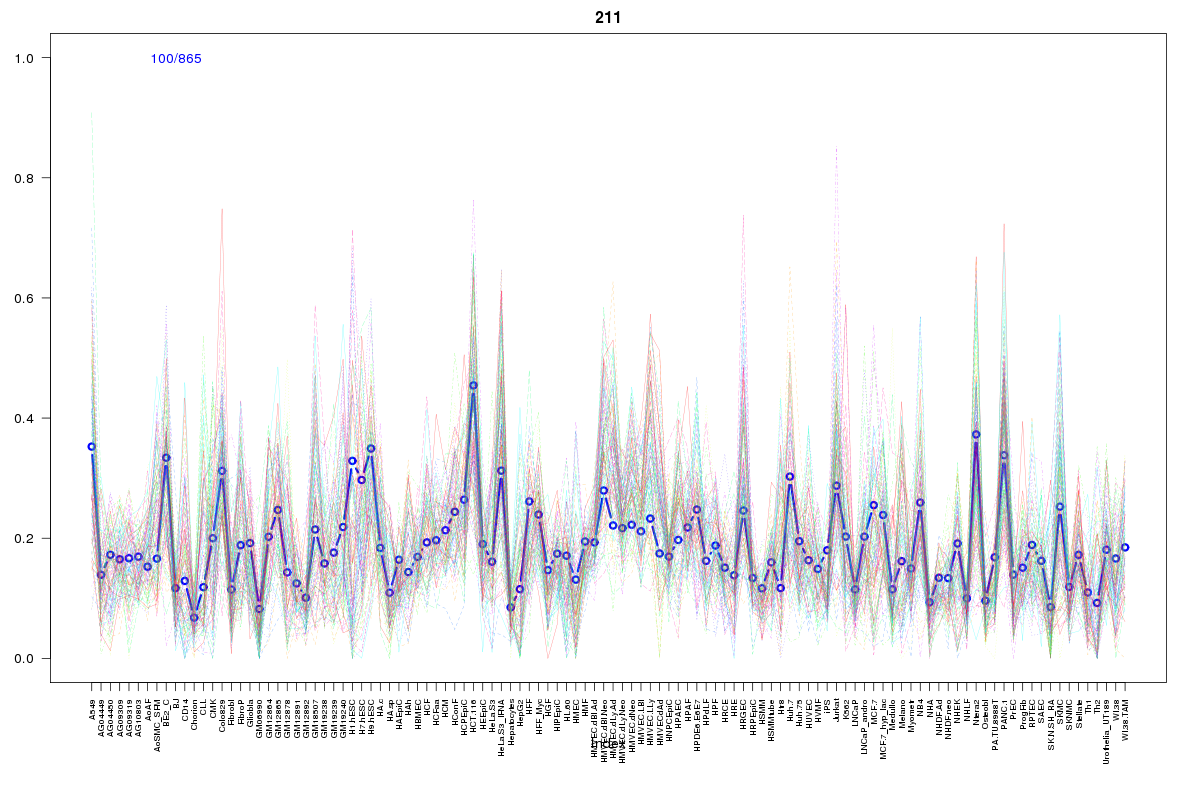 | 211 | 1 |
 | 1457 | 1 |
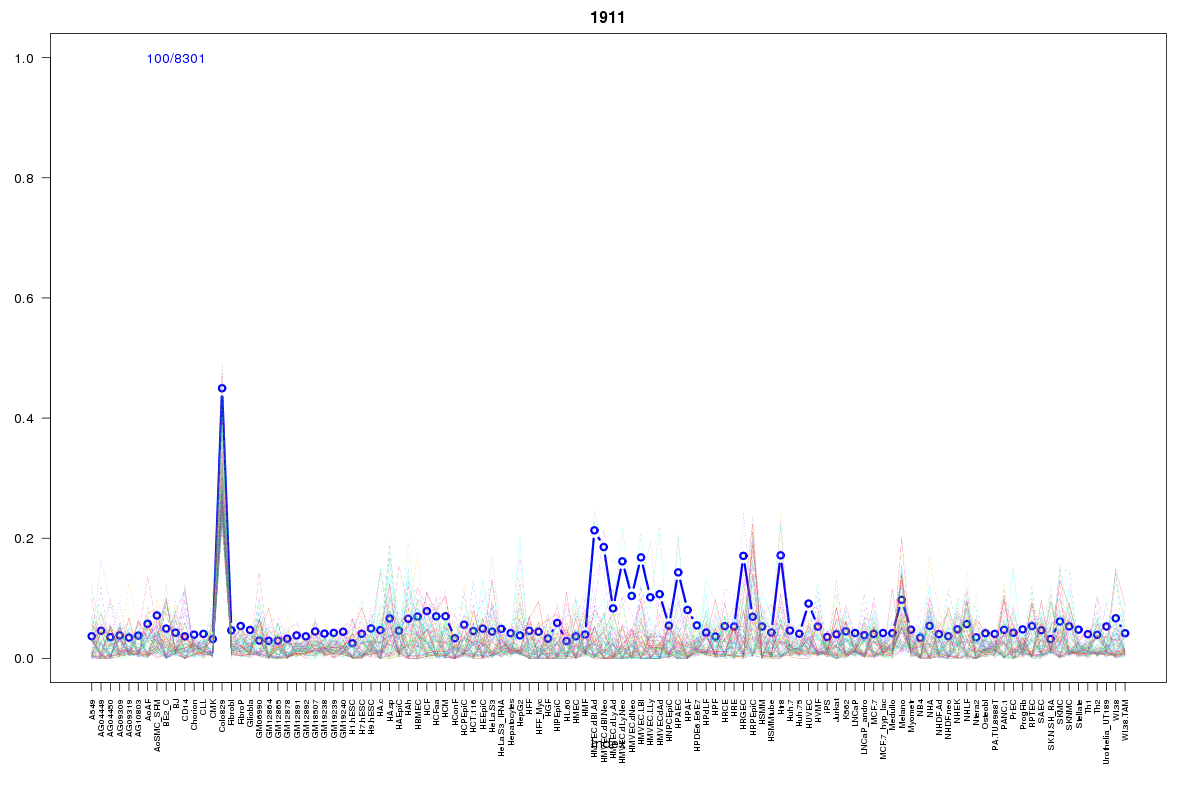 | 1911 | 1 |
 | 1605 | 1 |
Resources
BED file downloads
Connects to 10 DHS sitesTop 10 Correlated DHS Sites
p-values indiciate significant higher or lower correlation| Location | Cluster | P-value |
|---|---|---|
| chr1:171171100-171171250 | 1184 | 0.009 |
| chr1:171228340-171228490 | 1911 | 0.009 |
| chr1:171191140-171191290 | 1529 | 0.011 |
| chr1:171168020-171168170 | 1184 | 0.012 |
| chr1:171237980-171238130 | 1605 | 0.015 |
| chr1:171220960-171221110 | 211 | 0.018 |
| chr1:171219505-171219655 | 1900 | 0.018 |
| chr1:171188640-171188790 | 2331 | 0.018 |
| chr1:171221780-171221930 | 1457 | 0.021 |
| chr1:171148540-171148690 | 2008 | 0.022 |
External Databases
UCSCEnsembl (ENSG00000010932)