Gene: TNFRSF9
chr1: 7979906-8000926Expression Profile
(log scale)
Graphical Connections
Distribution of linked clusters:
You may find it interesting if many of the connected DHS sites belong to the same cluster.| Cluster Profile | Cluster ID | Number of DHS sites in this cluster |
|---|---|---|
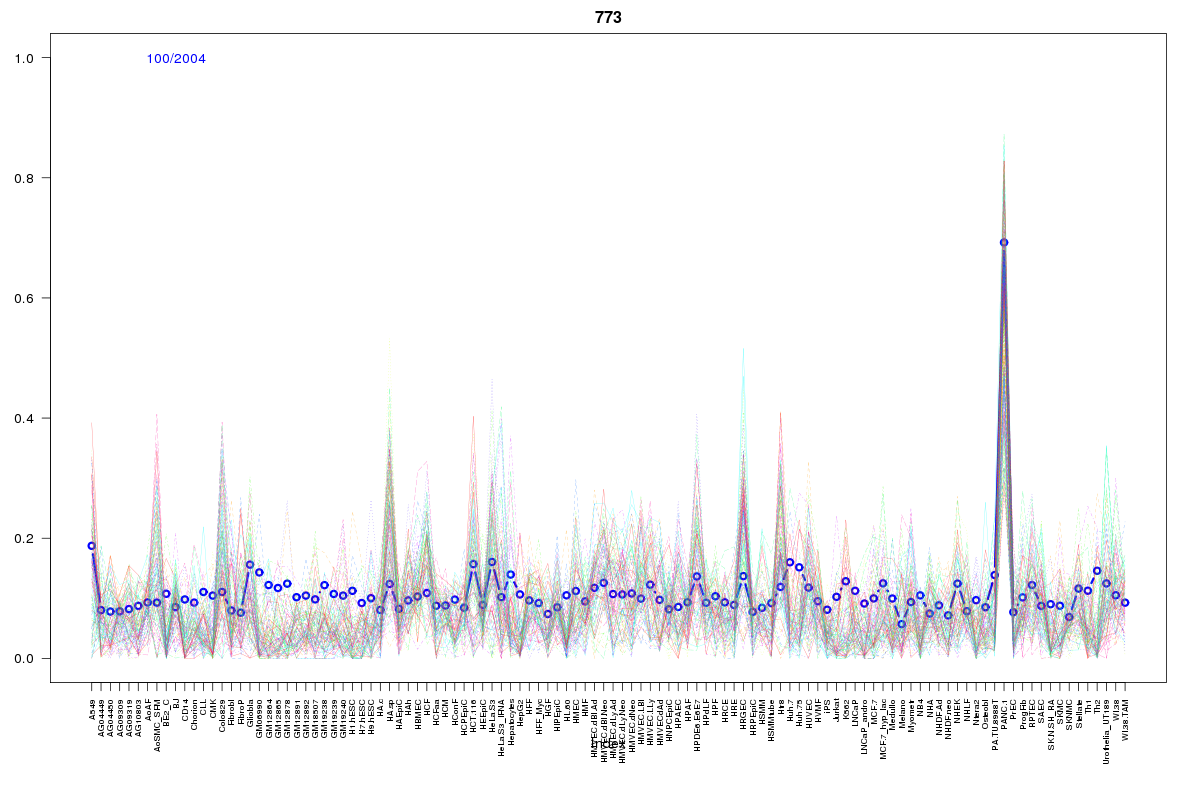 | 773 | 1 |
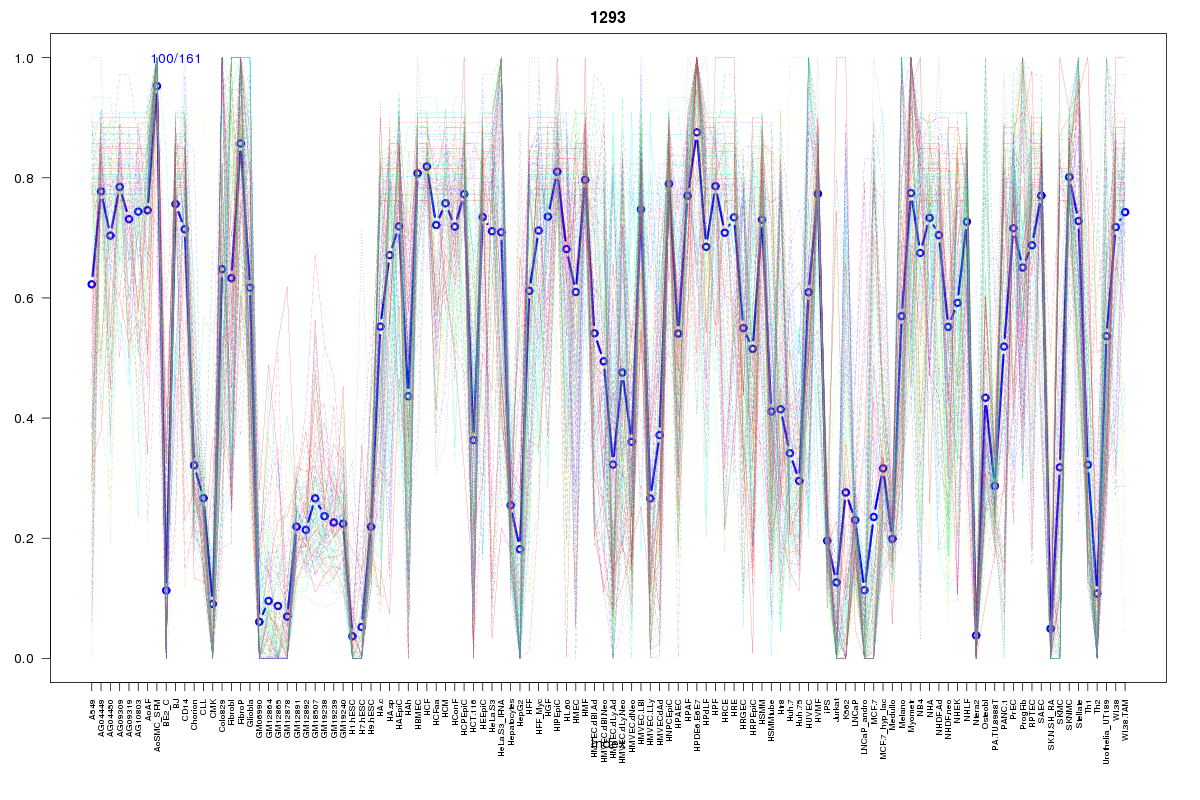 | 1293 | 1 |
 | 1974 | 1 |
 | 2434 | 1 |
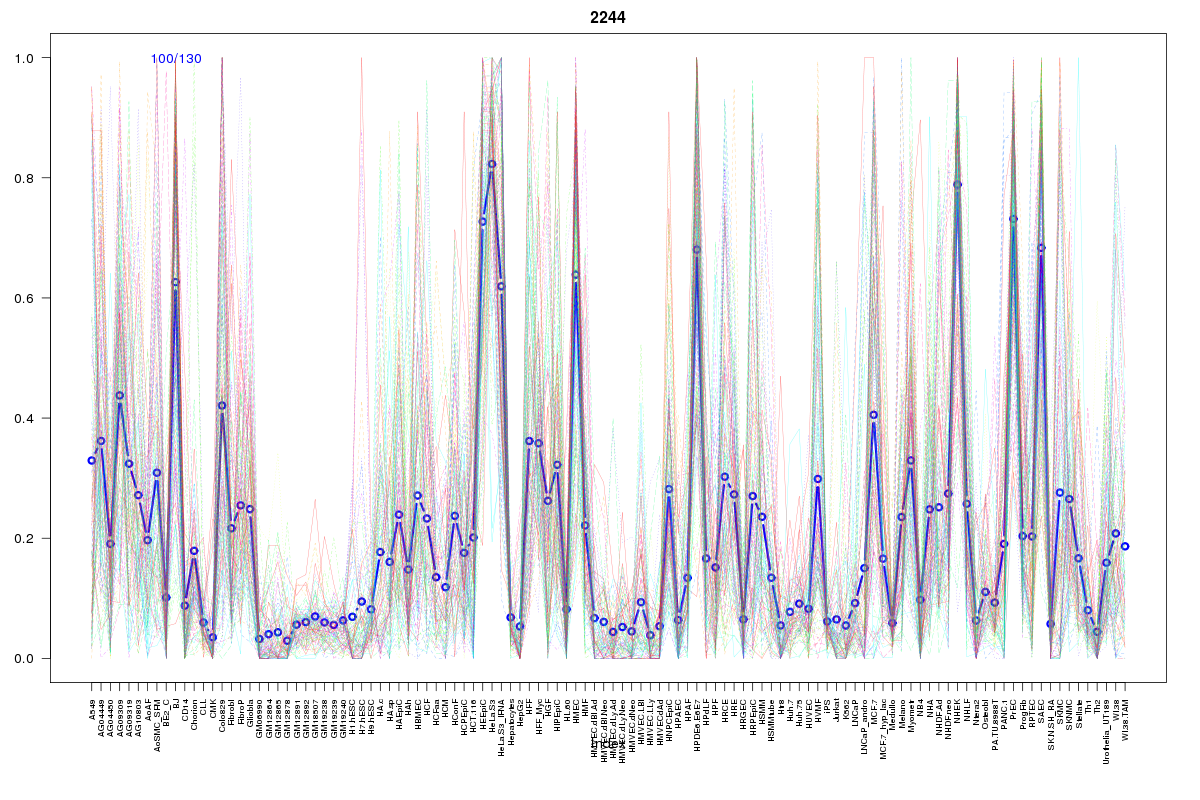 | 2244 | 1 |
 | 1078 | 1 |
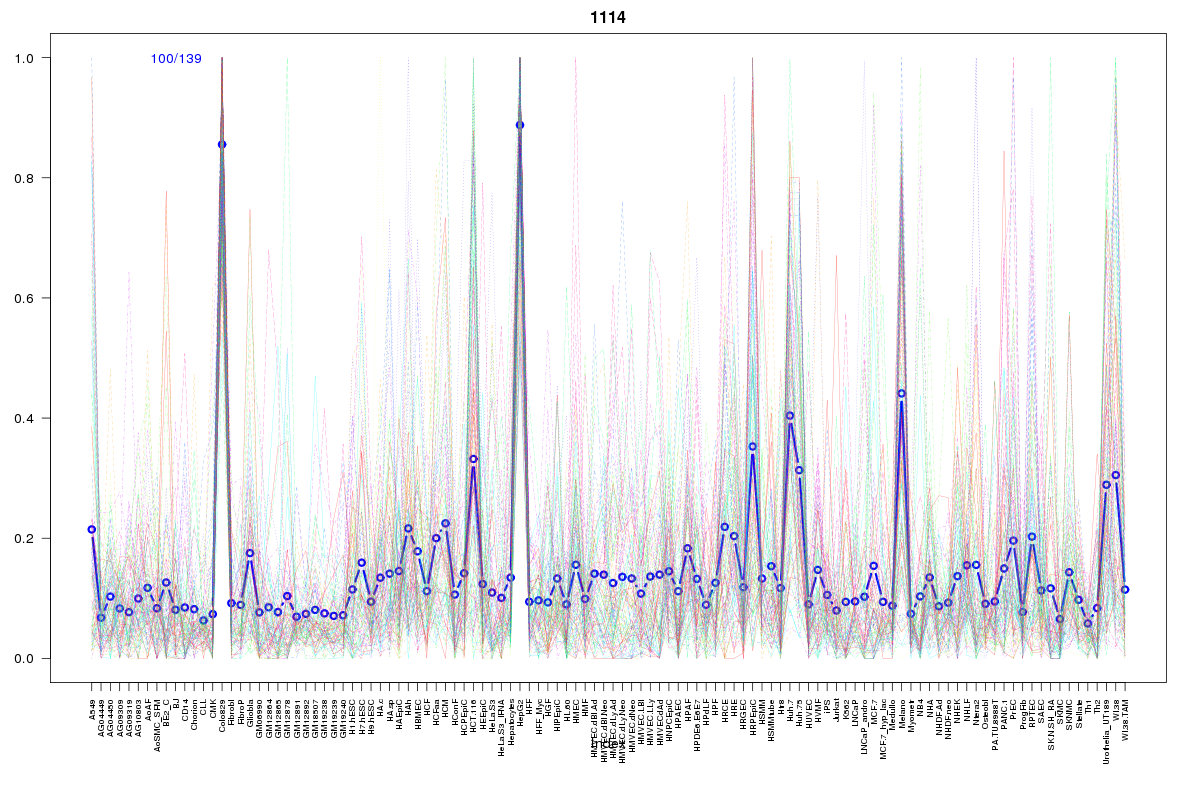 | 1114 | 1 |
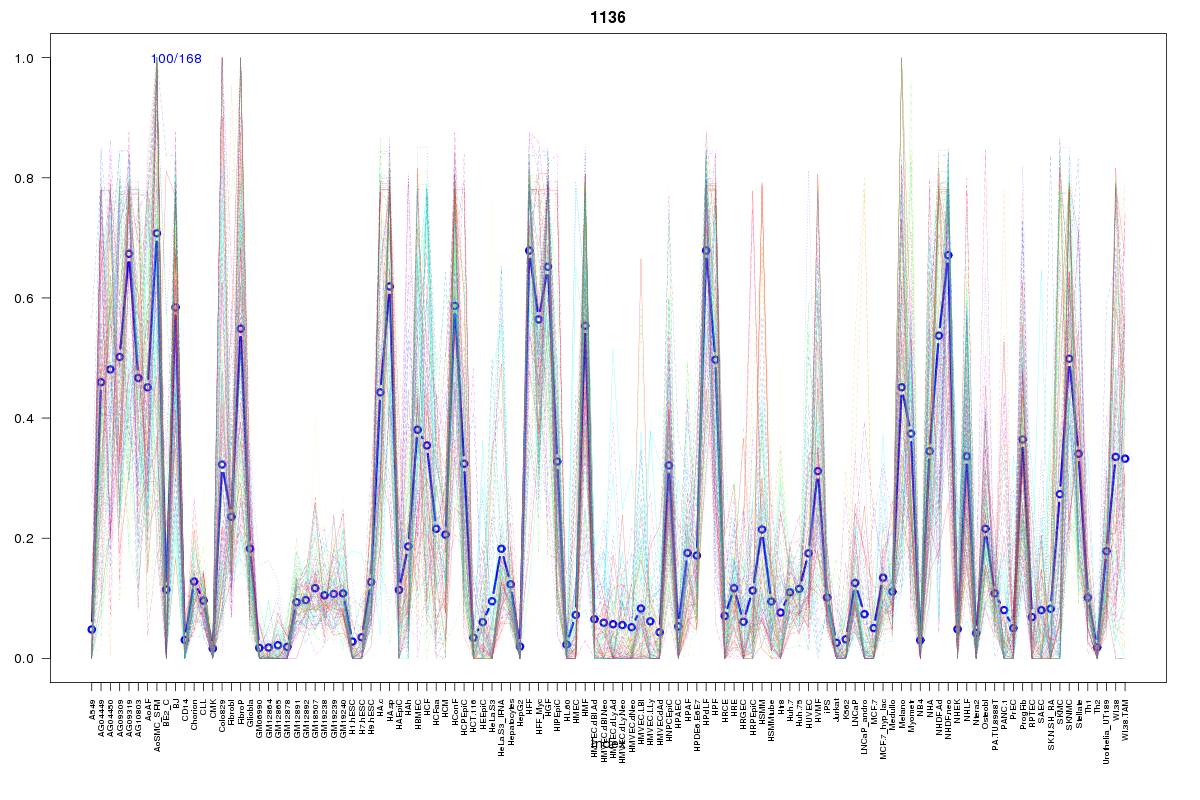 | 1136 | 1 |
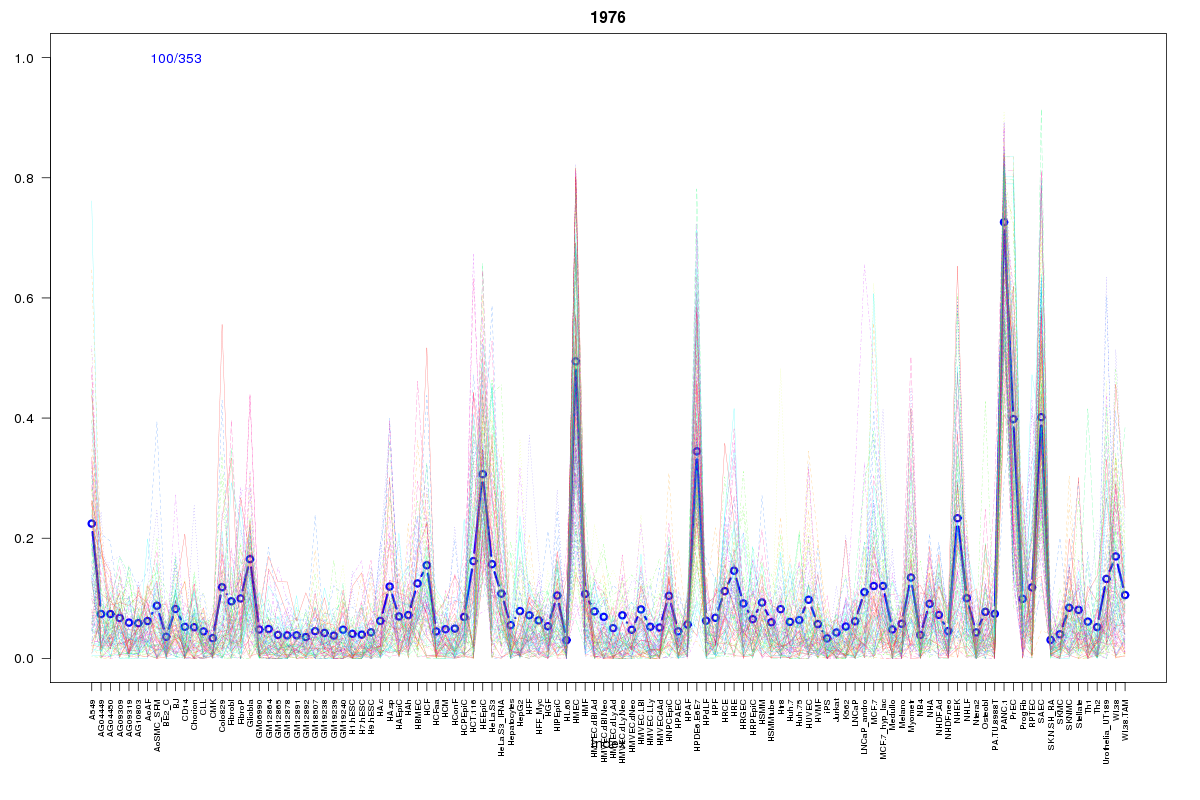 | 1976 | 1 |
 | 1755 | 1 |
 | 550 | 1 |
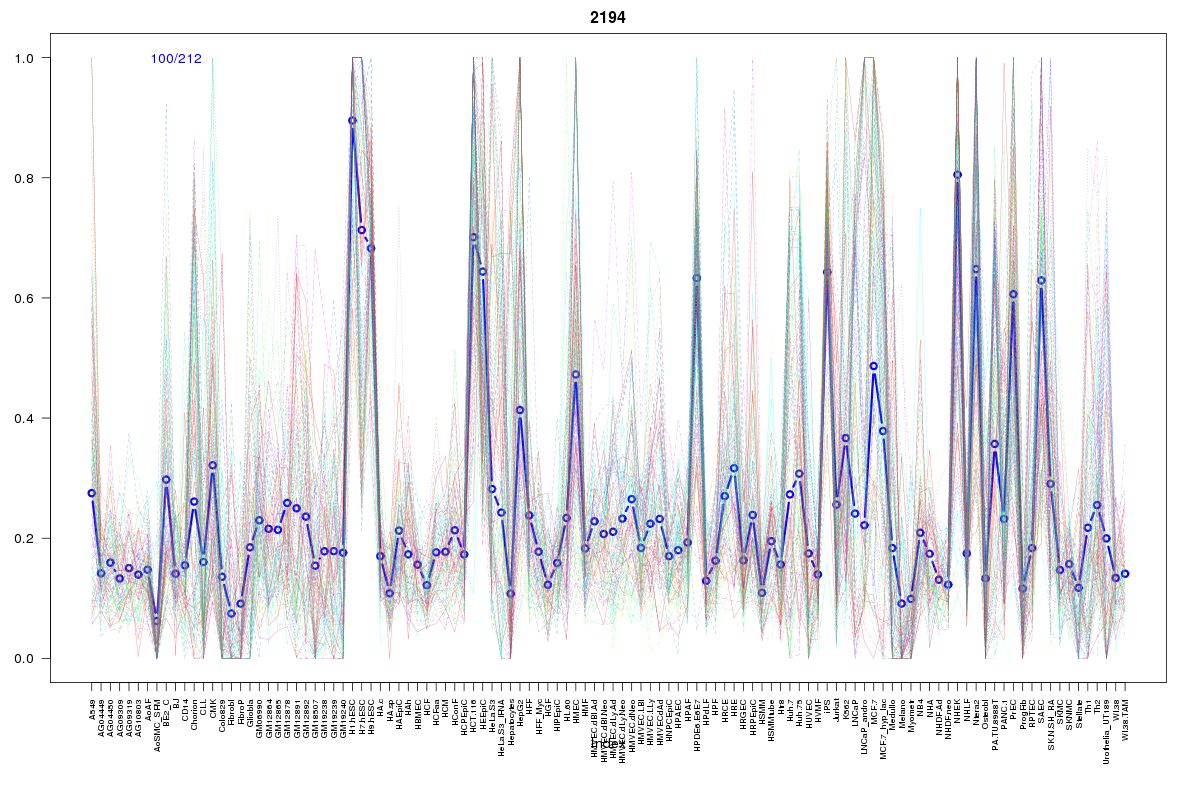 | 2194 | 1 |
 | 10 | 1 |
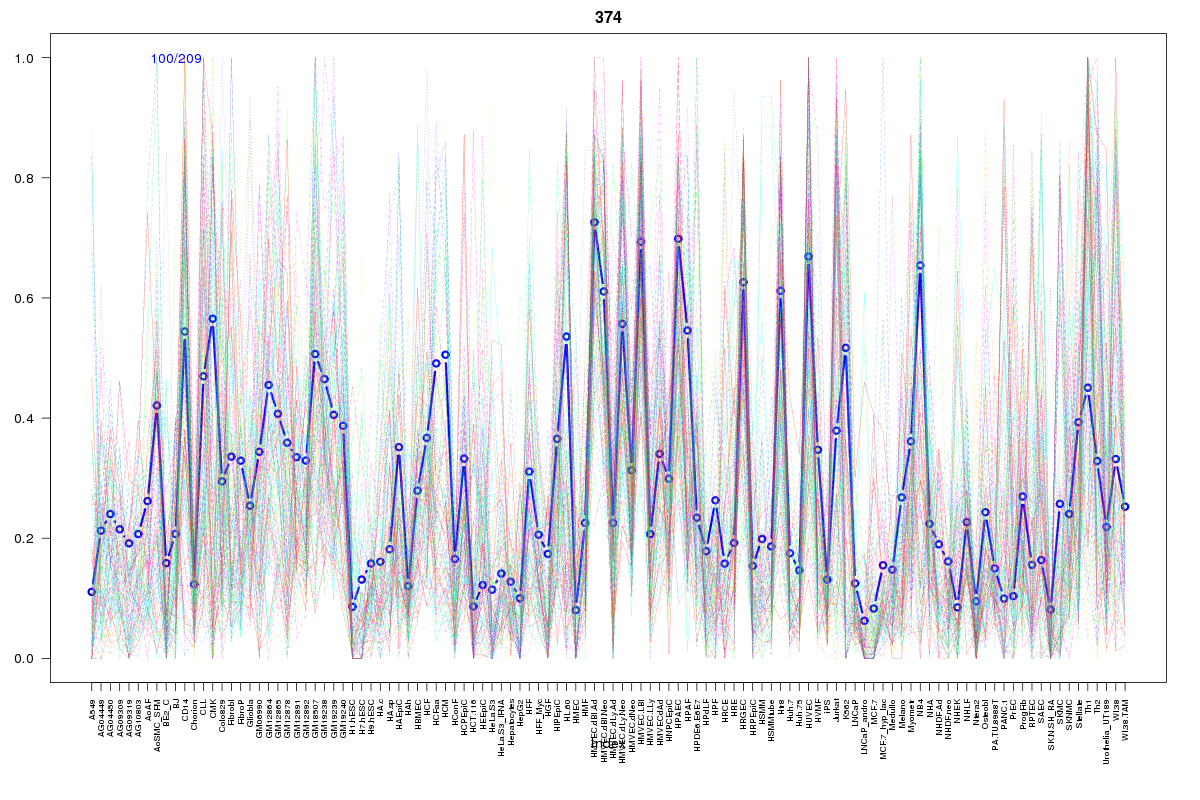 | 374 | 1 |
 | 1970 | 1 |
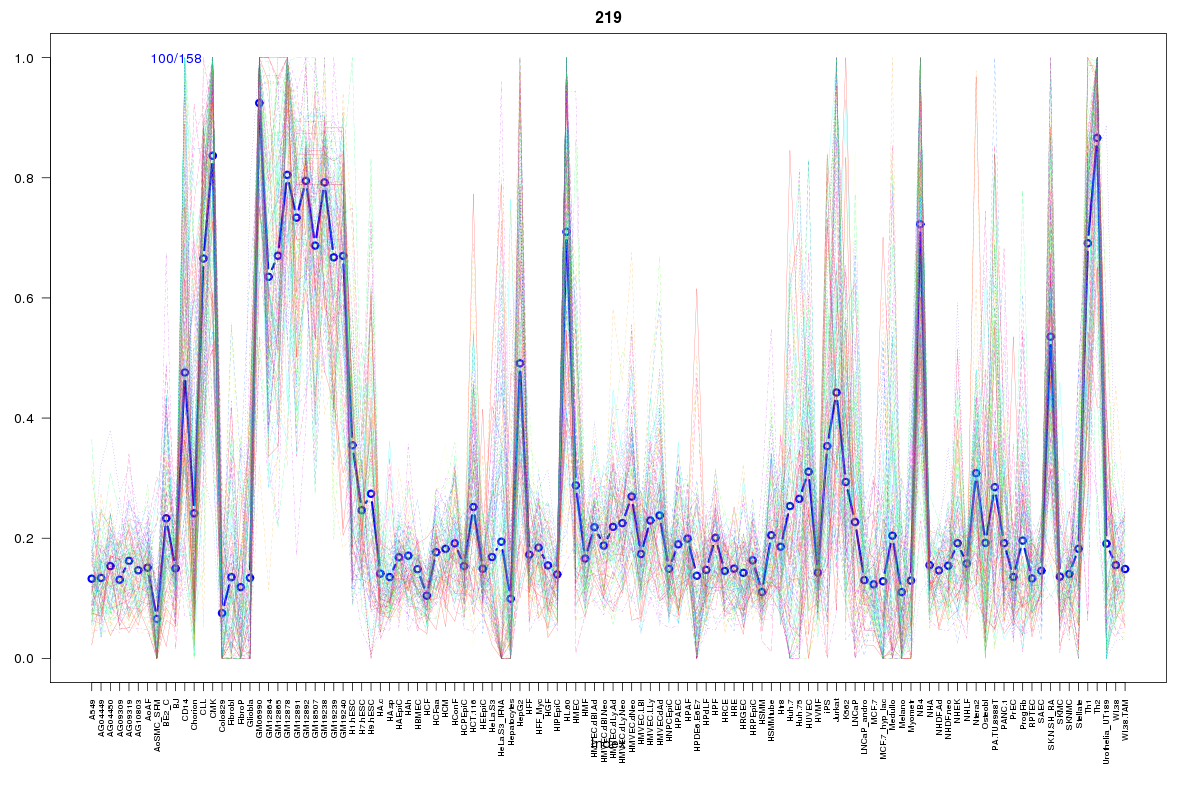 | 219 | 1 |
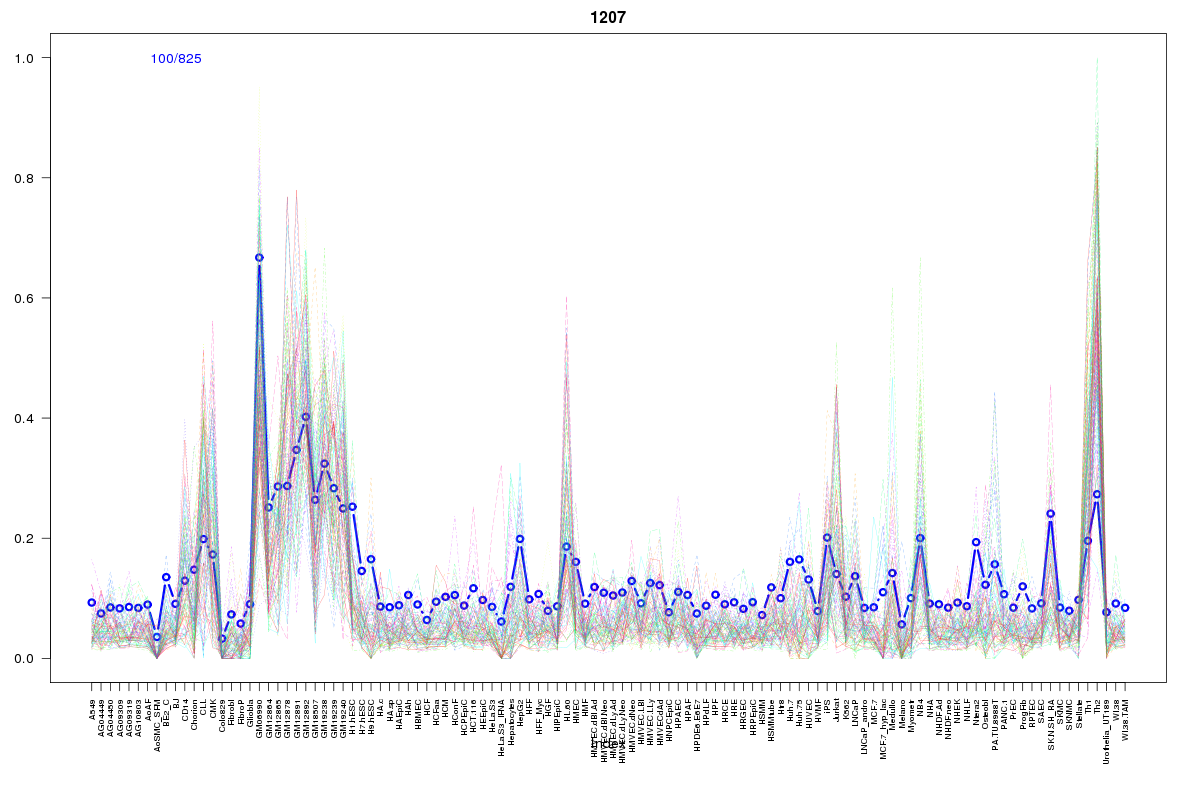 | 1207 | 1 |
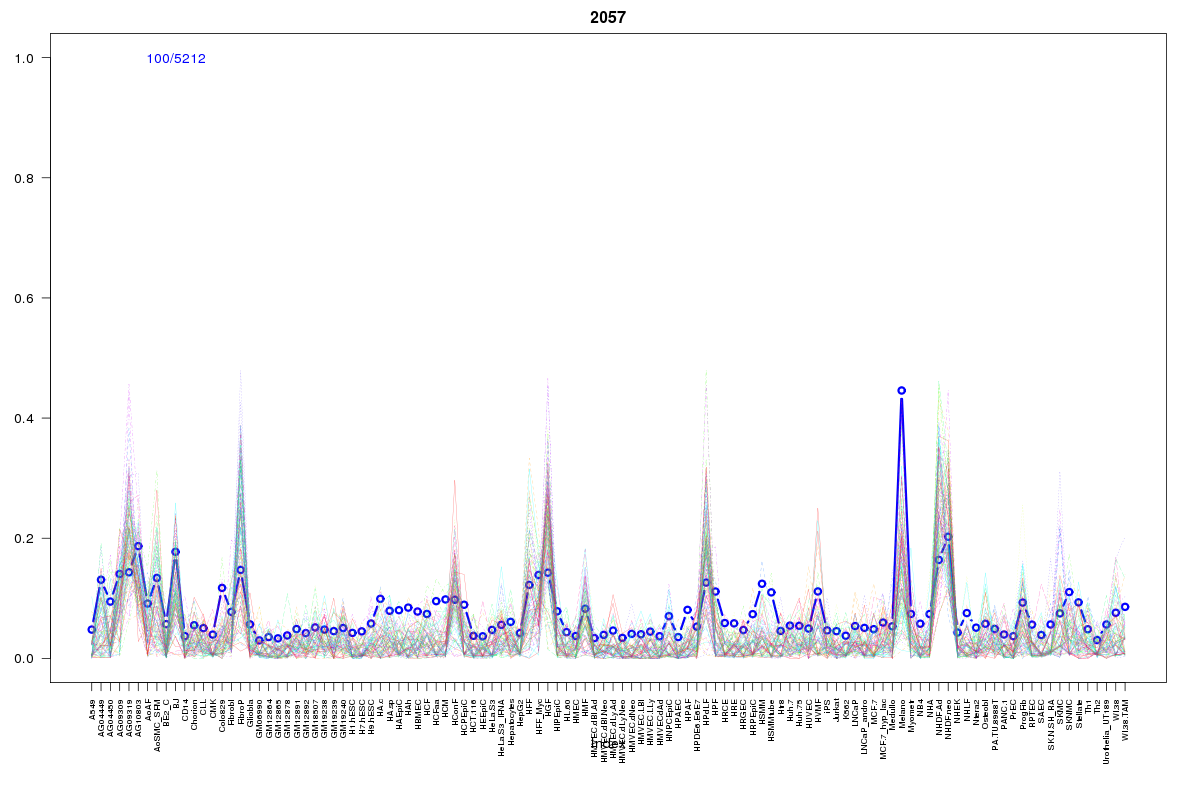 | 2057 | 1 |
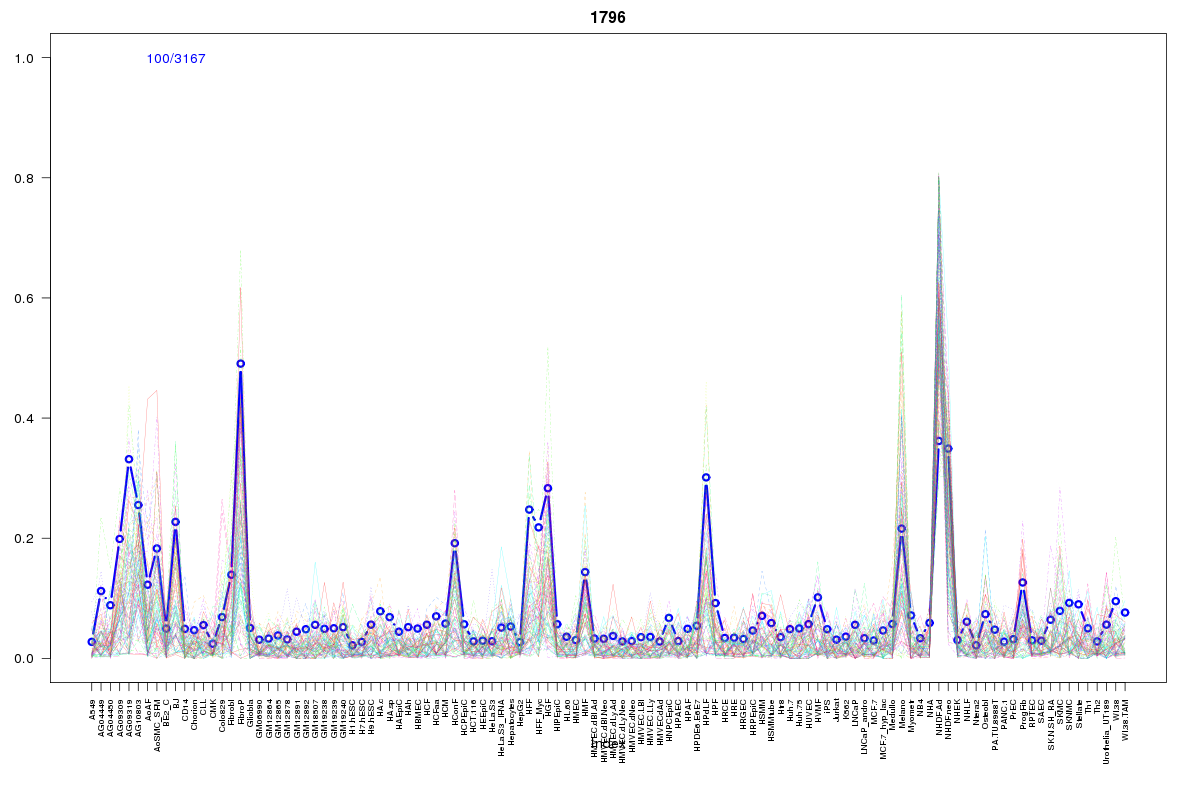 | 1796 | 1 |
Resources
BED file downloads
Connects to 19 DHS sitesTop 10 Correlated DHS Sites
p-values indiciate significant higher or lower correlation| Location | Cluster | P-value |
|---|---|---|
| chr1:8000880-8001030 | 374 | 0 |
| chr1:8009545-8009695 | 1970 | 0.004 |
| chr1:7931265-7931415 | 1755 | 0.014 |
| chr1:8013965-8014115 | 219 | 0.015 |
| chr1:8014505-8014655 | 1207 | 0.017 |
| chr1:7887225-7887375 | 1078 | 0.022 |
| chr1:7907800-7907950 | 1136 | 0.024 |
| chr1:8063100-8063250 | 1796 | 0.024 |
| chr1:7998220-7998370 | 10 | 0.022 |
| chr1:8078120-8078270 | 1114 | 0.022 |
| chr1:7945725-7945875 | 2194 | 0.018 |
External Databases
UCSCEnsembl (ENSG00000049249)