Gene: ATP11B
chr3: 182511287-182639423Expression Profile
(log scale)
Graphical Connections
Distribution of linked clusters:
You may find it interesting if many of the connected DHS sites belong to the same cluster.| Cluster Profile | Cluster ID | Number of DHS sites in this cluster |
|---|---|---|
 | 568 | 2 |
 | 2110 | 2 |
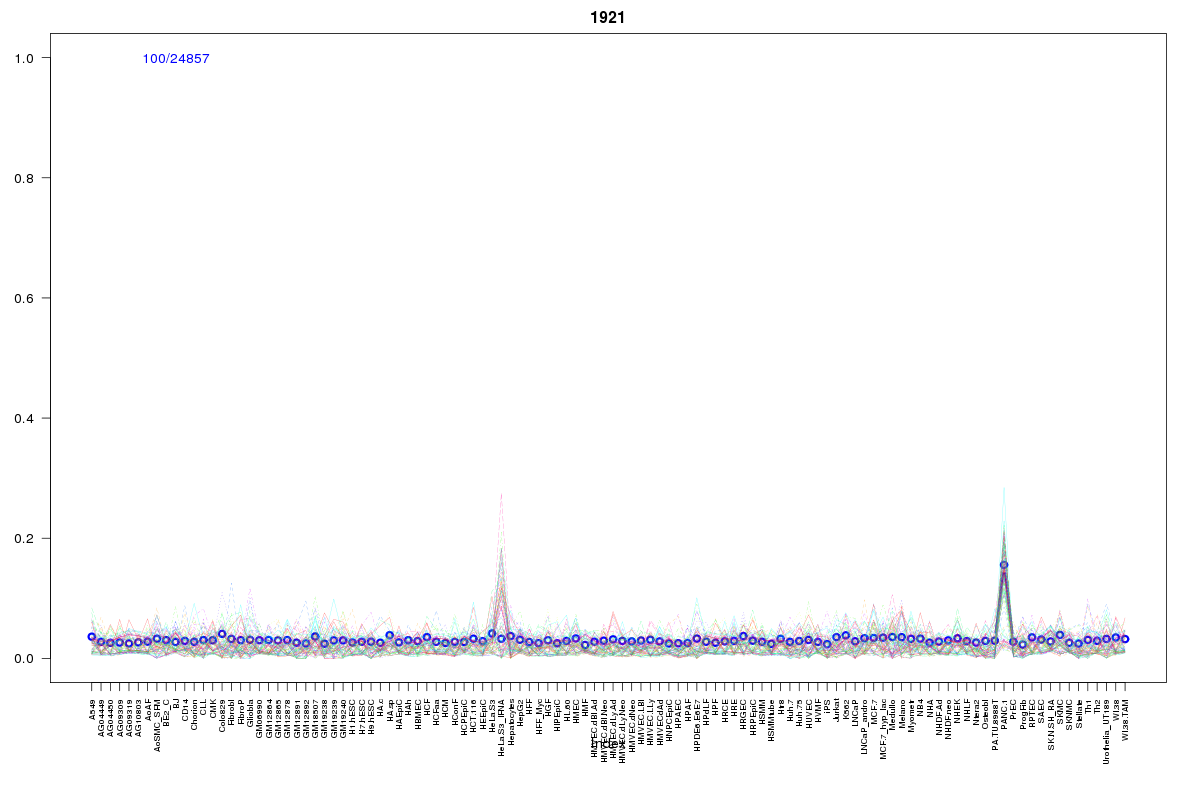 | 1921 | 1 |
 | 2063 | 1 |
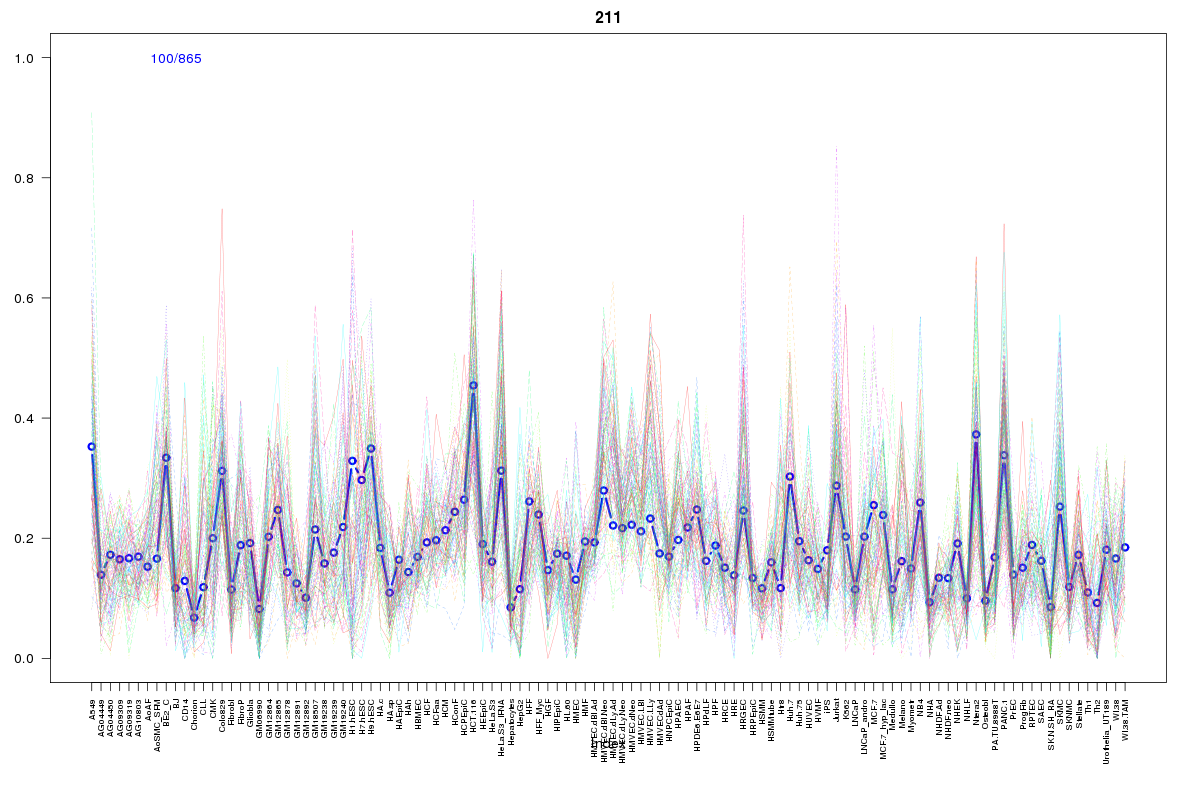 | 211 | 1 |
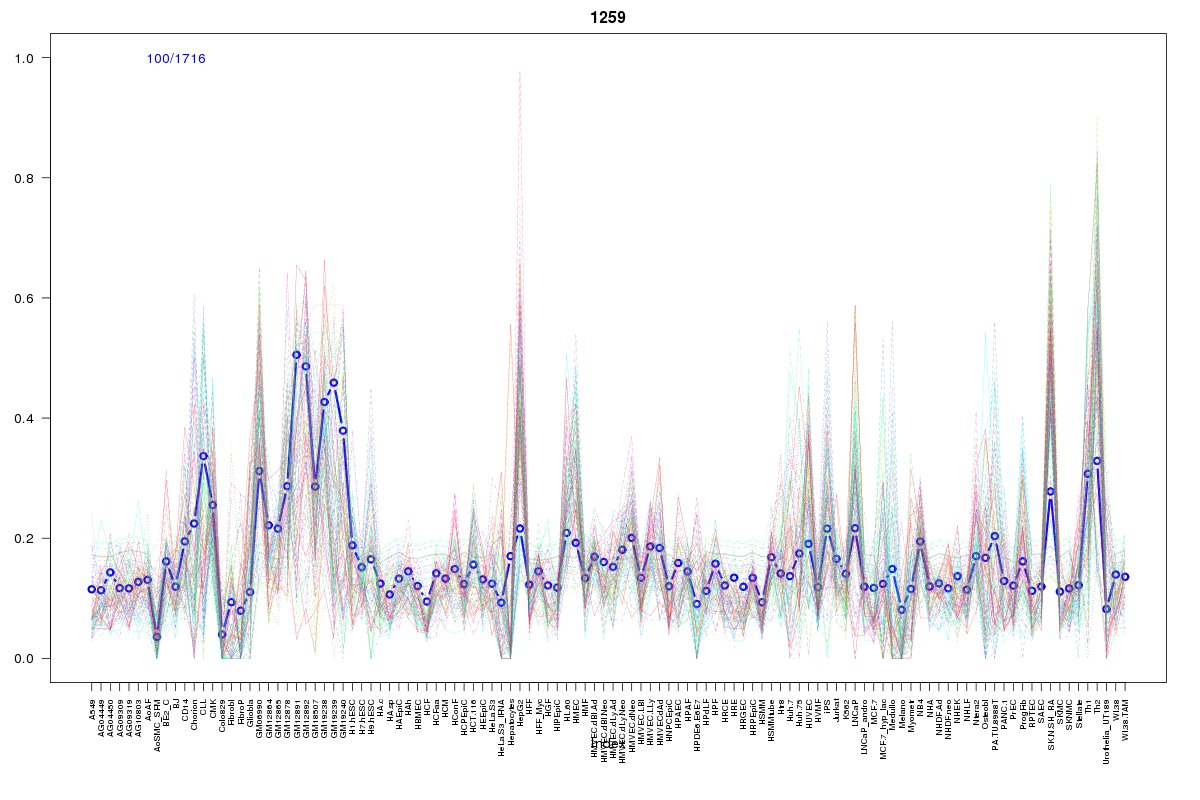 | 1259 | 1 |
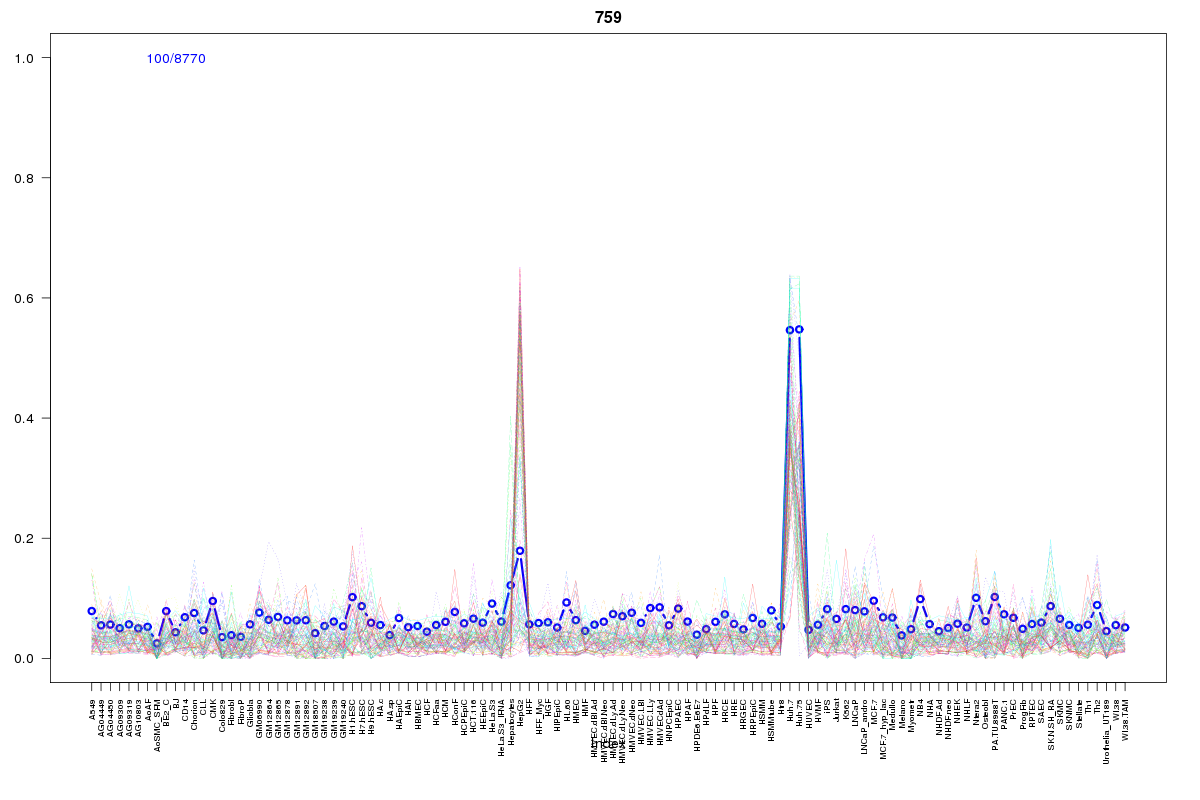 | 759 | 1 |
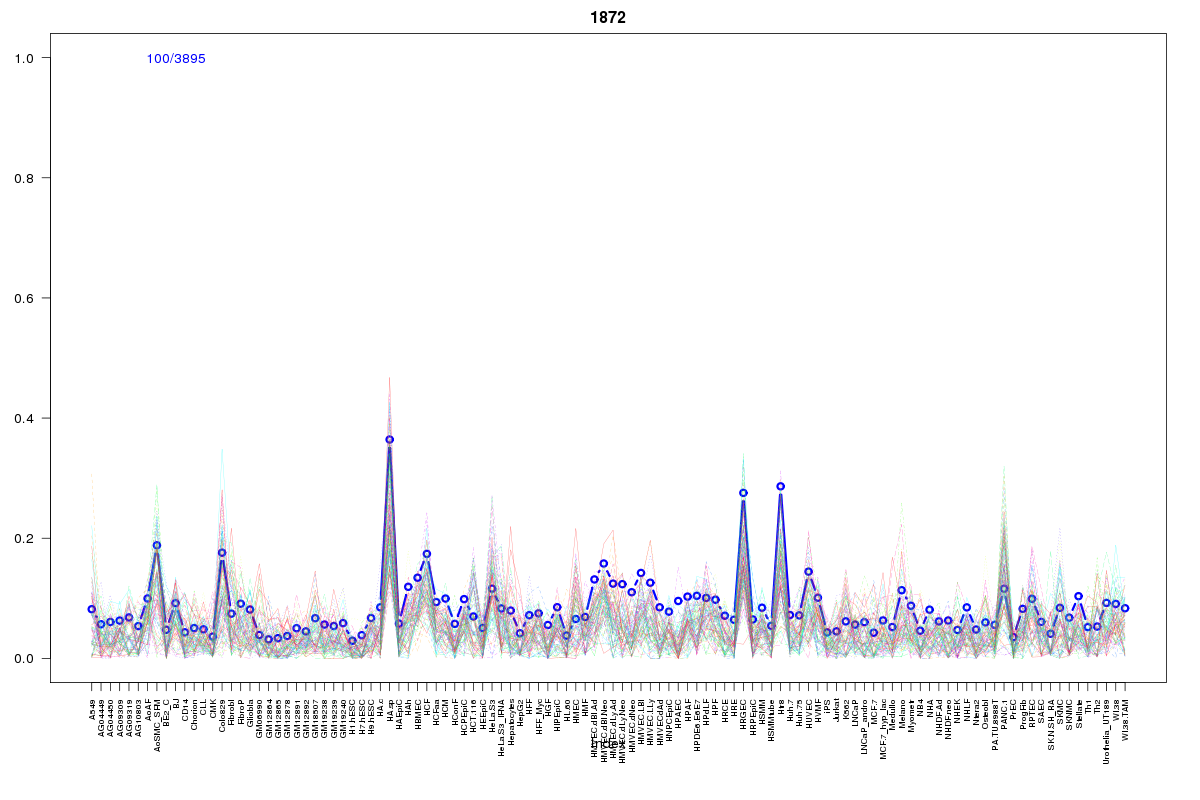 | 1872 | 1 |
 | 935 | 1 |
 | 934 | 1 |
 | 2059 | 1 |
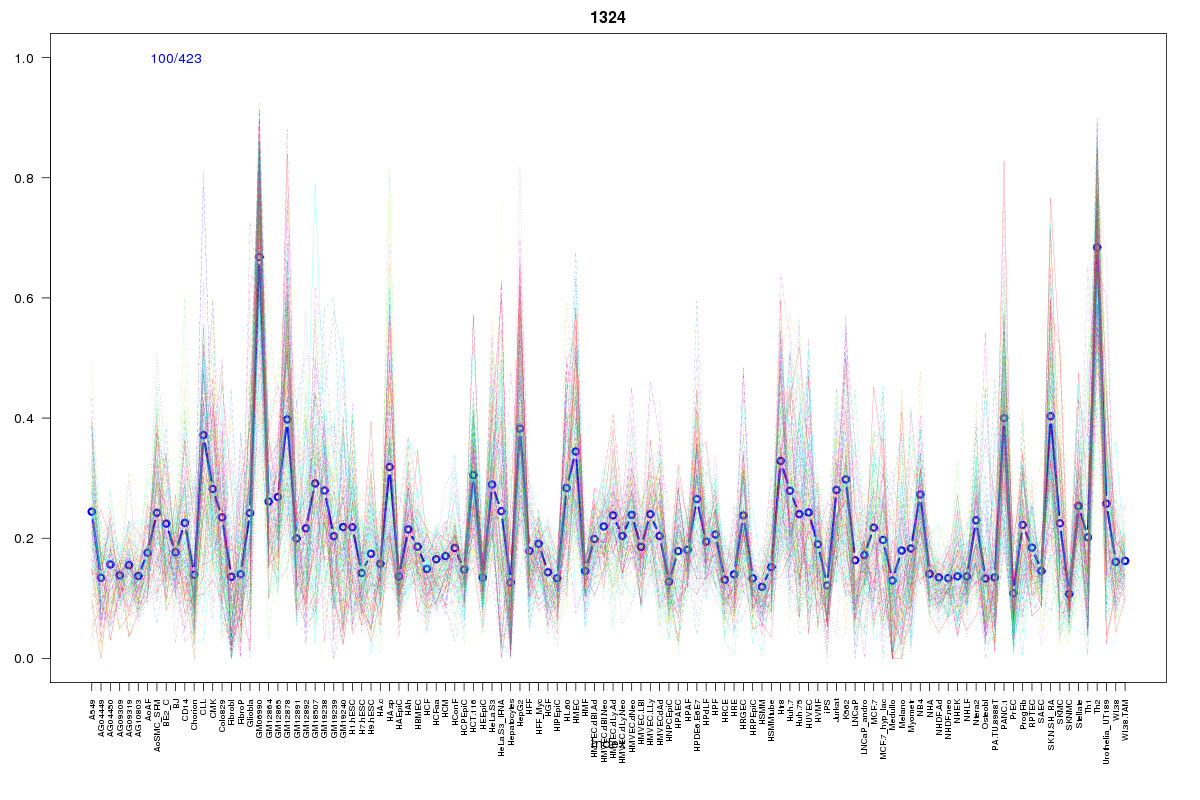 | 1324 | 1 |
 | 2017 | 1 |
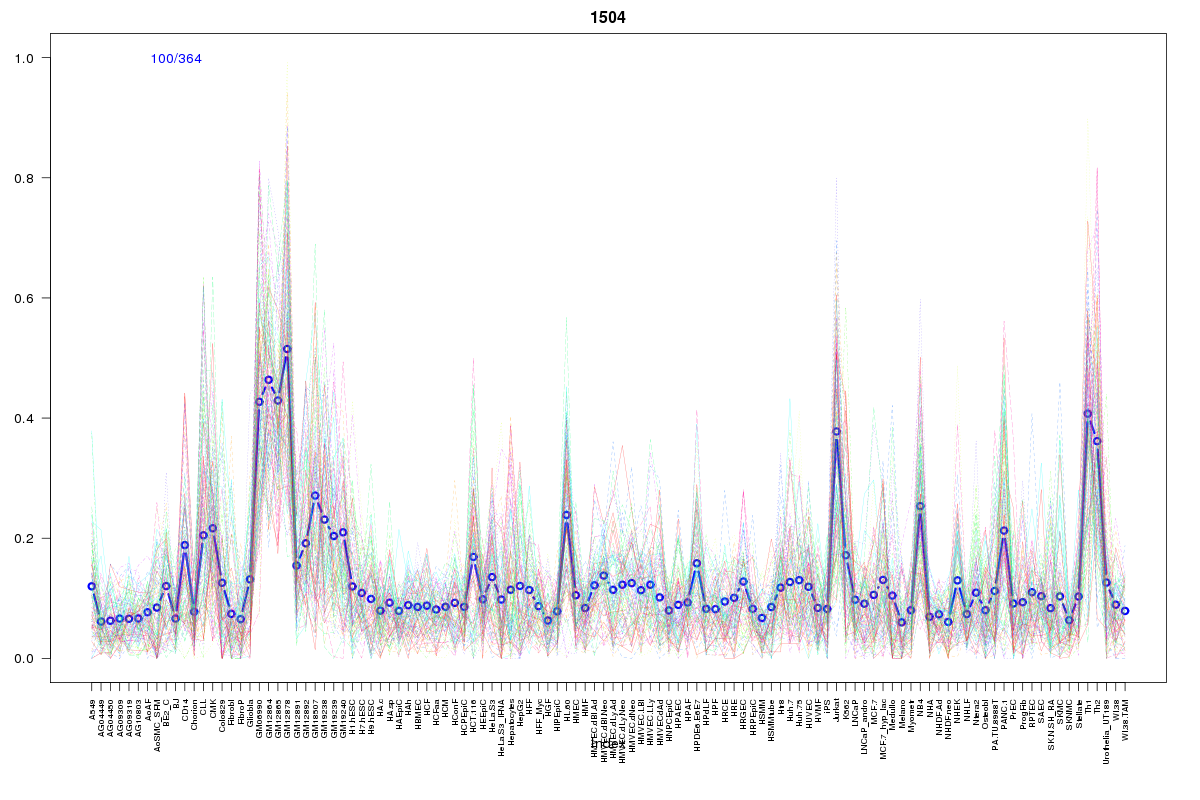 | 1504 | 1 |
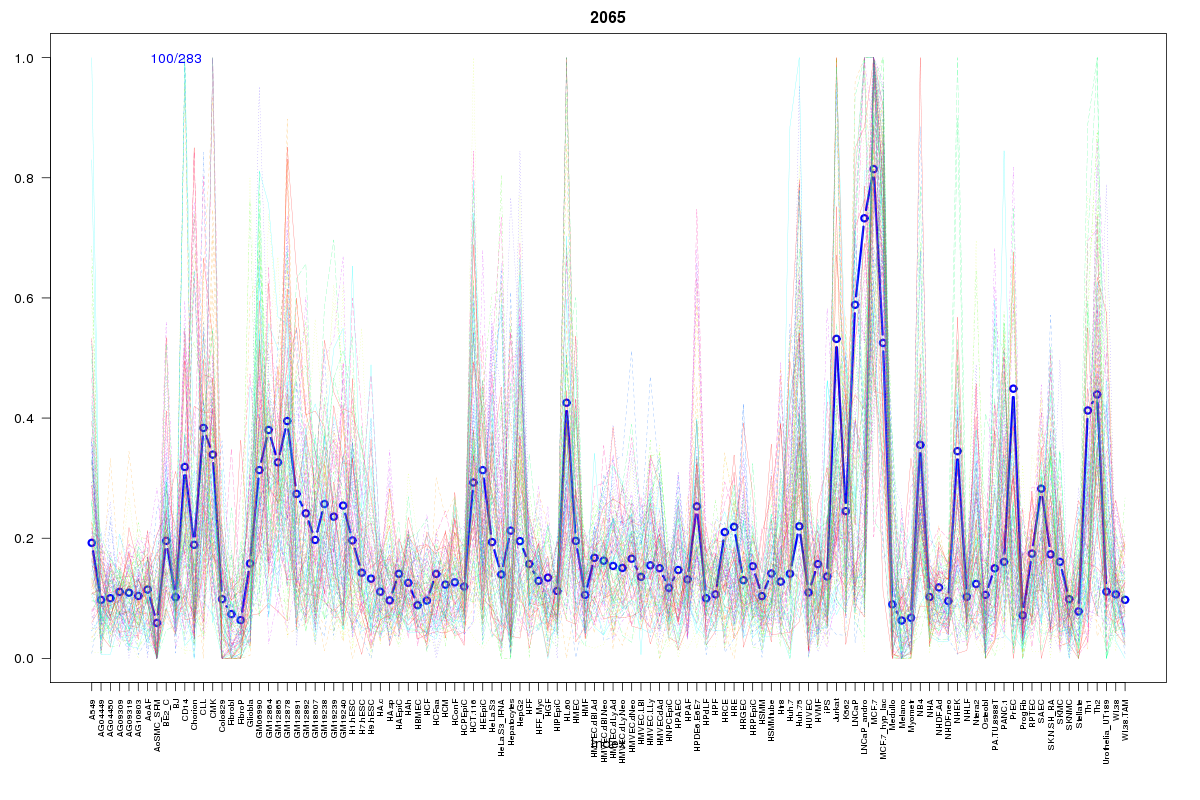 | 2065 | 1 |
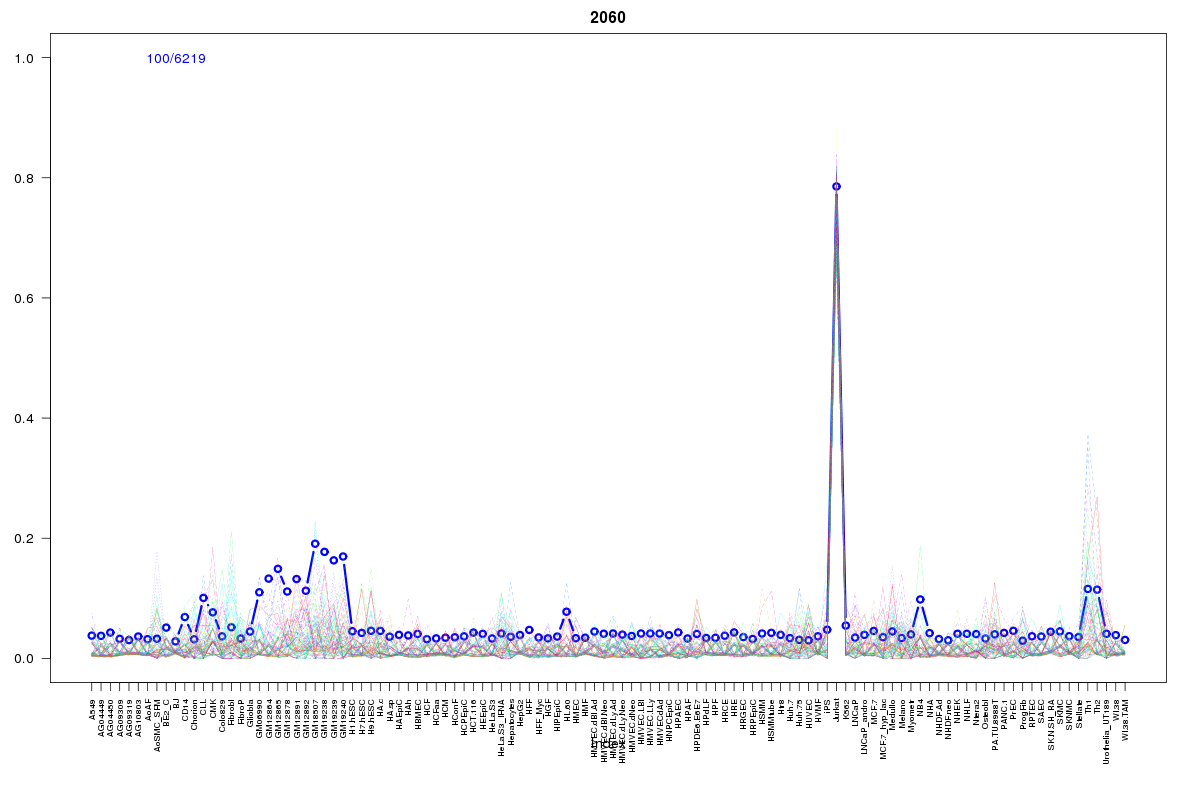 | 2060 | 1 |
 | 615 | 1 |
Resources
BED file downloads
Connects to 19 DHS sitesTop 10 Correlated DHS Sites
p-values indiciate significant higher or lower correlation| Location | Cluster | P-value |
|---|---|---|
| chr3:182513300-182513450 | 2065 | 0 |
| chr3:182628385-182628535 | 2110 | 0 |
| chr3:182432245-182432395 | 1872 | 0.002 |
| chr3:182629120-182629270 | 2060 | 0.002 |
| chr3:182513140-182513290 | 1504 | 0.002 |
| chr3:182512100-182512250 | 1324 | 0.002 |
| chr3:182685720-182685870 | 2063 | 0.002 |
| chr3:182658405-182658555 | 1921 | 0.002 |
| chr3:182510445-182510595 | 2059 | 0.007 |
| chr3:182503205-182503355 | 935 | 0.008 |
| chr3:182654560-182654710 | 2110 | 0.013 |
External Databases
UCSCEnsembl (ENSG00000058063)