Gene: GNA15
chr19: 3136190-3163767Expression Profile
(log scale)
Graphical Connections
Distribution of linked clusters:
You may find it interesting if many of the connected DHS sites belong to the same cluster.| Cluster Profile | Cluster ID | Number of DHS sites in this cluster |
|---|---|---|
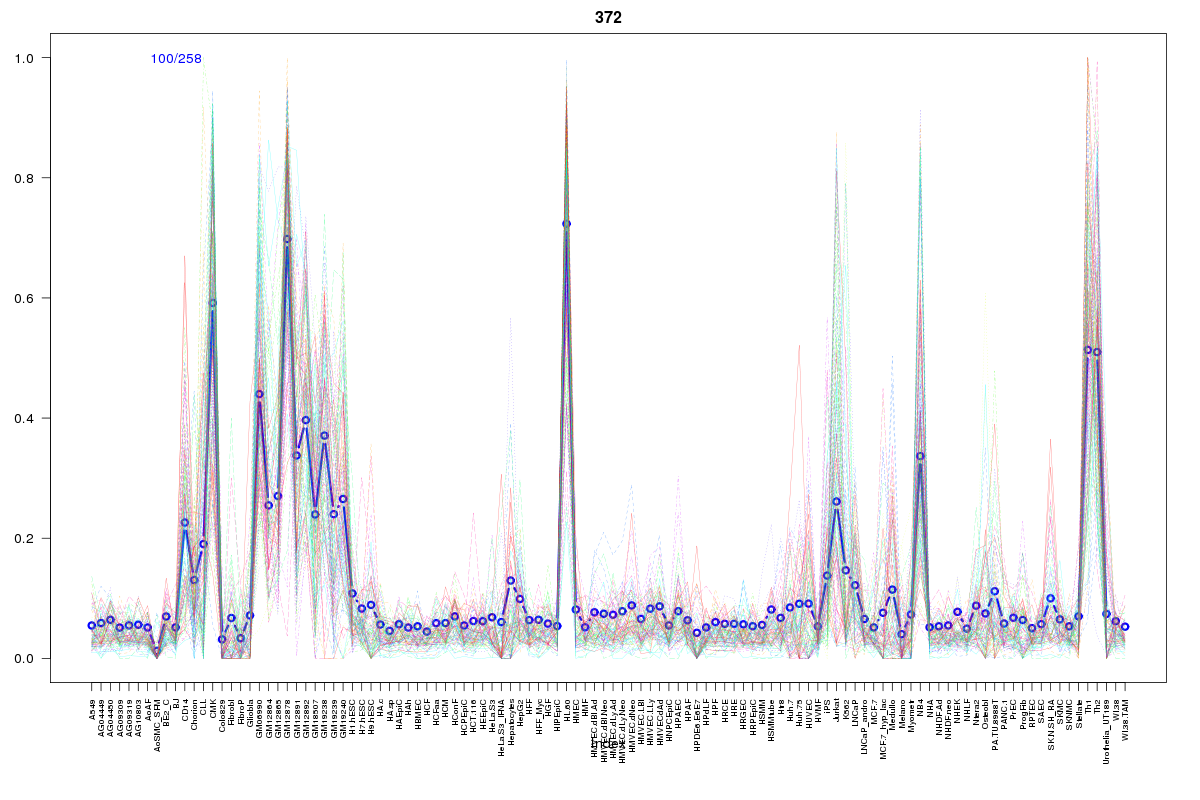 | 372 | 5 |
 | 570 | 2 |
 | 579 | 2 |
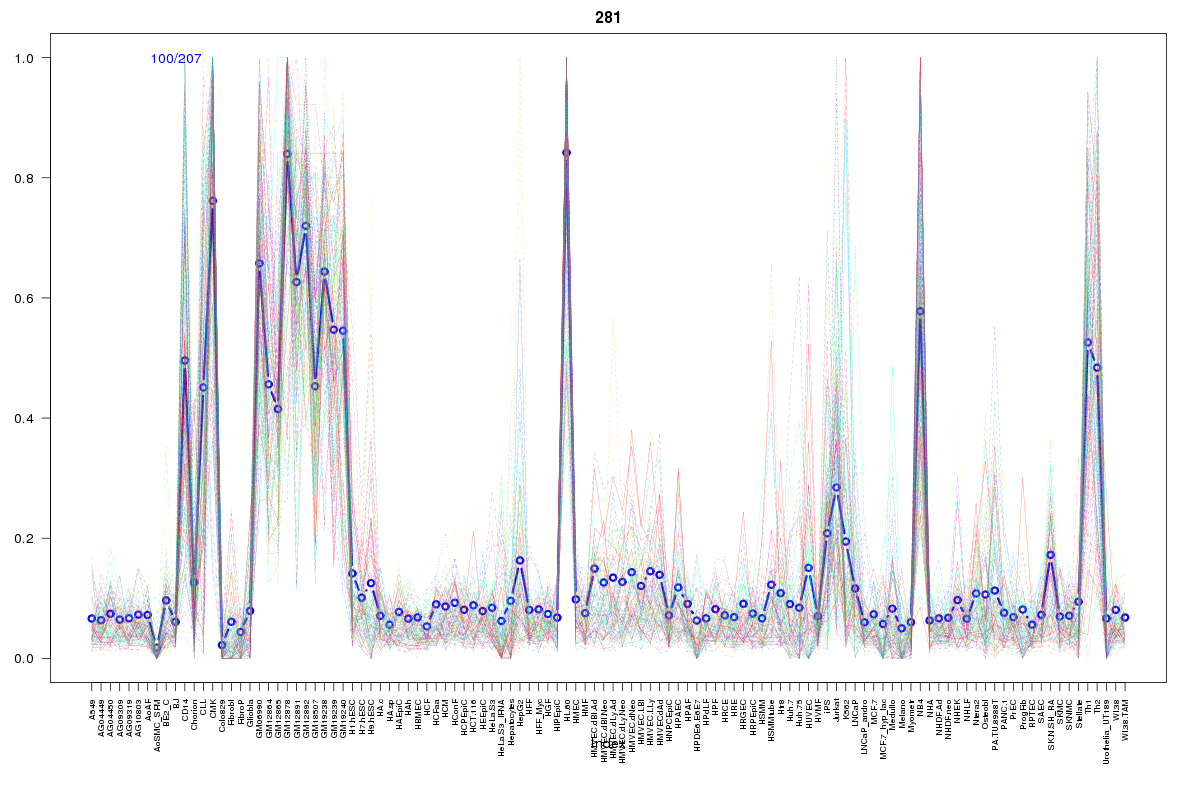 | 281 | 2 |
 | 569 | 2 |
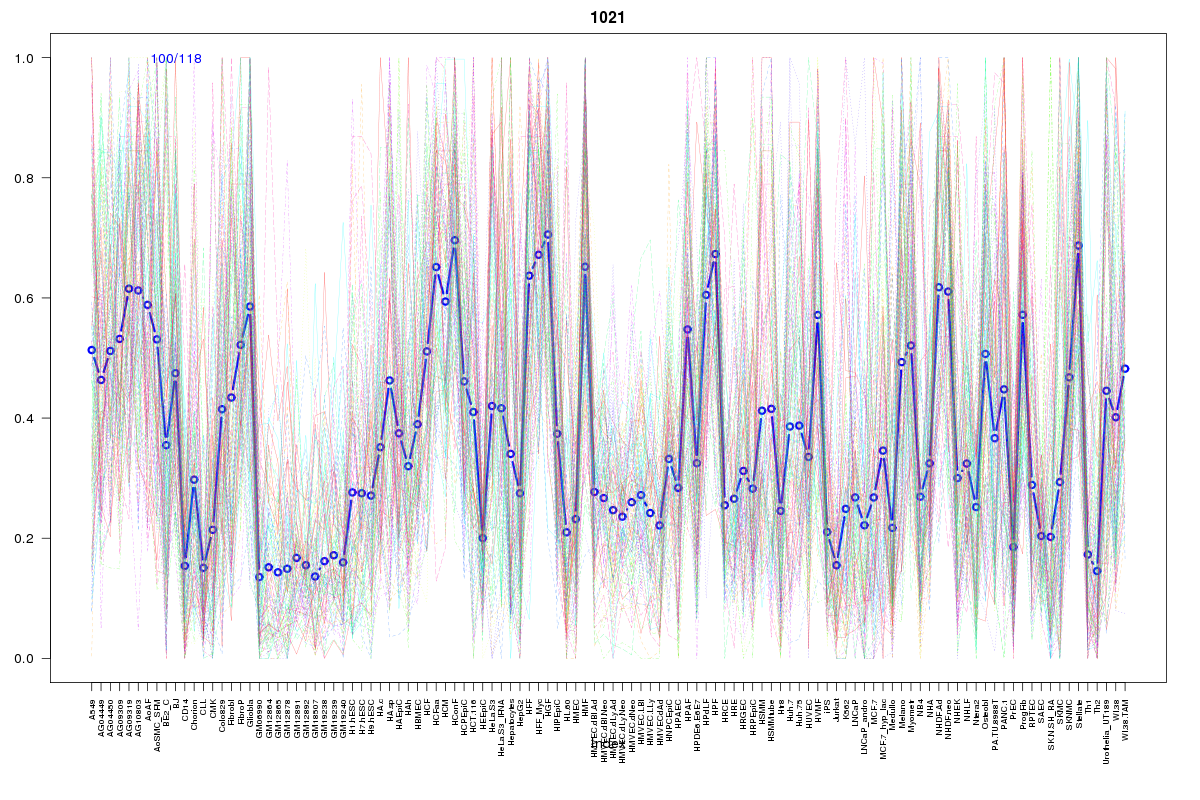 | 1021 | 1 |
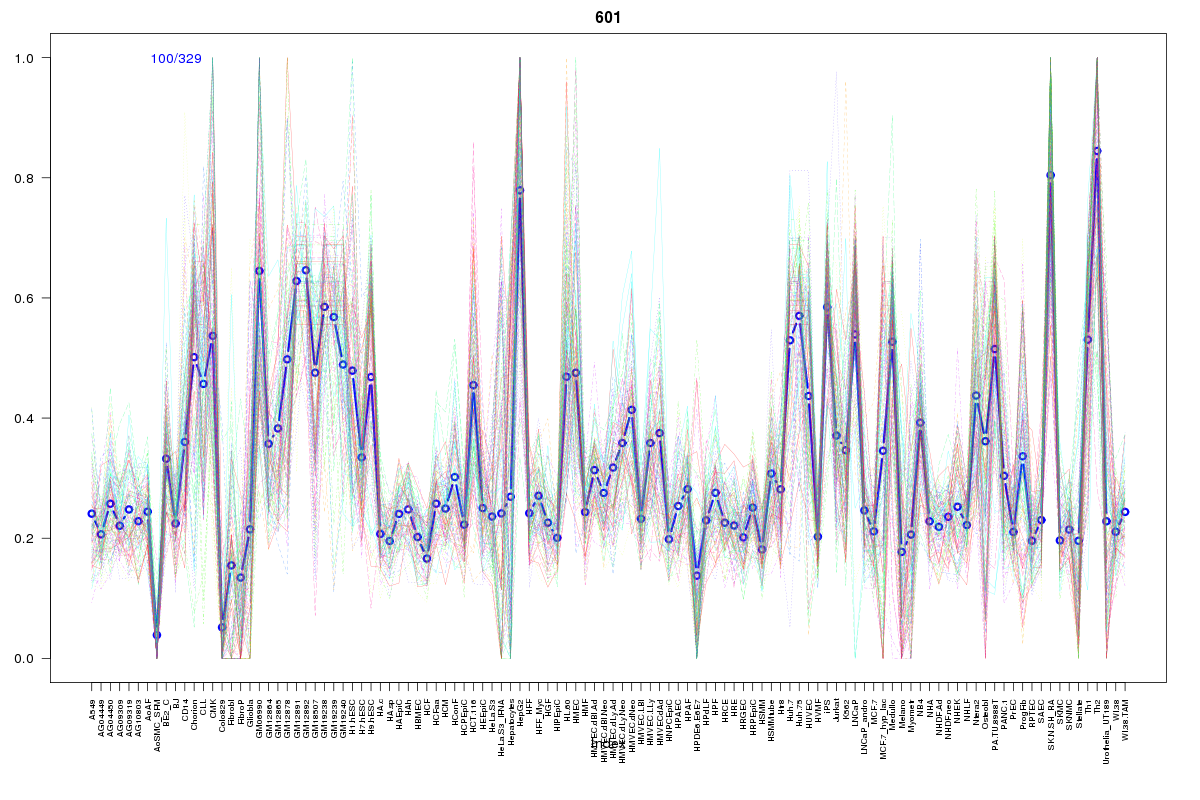 | 601 | 1 |
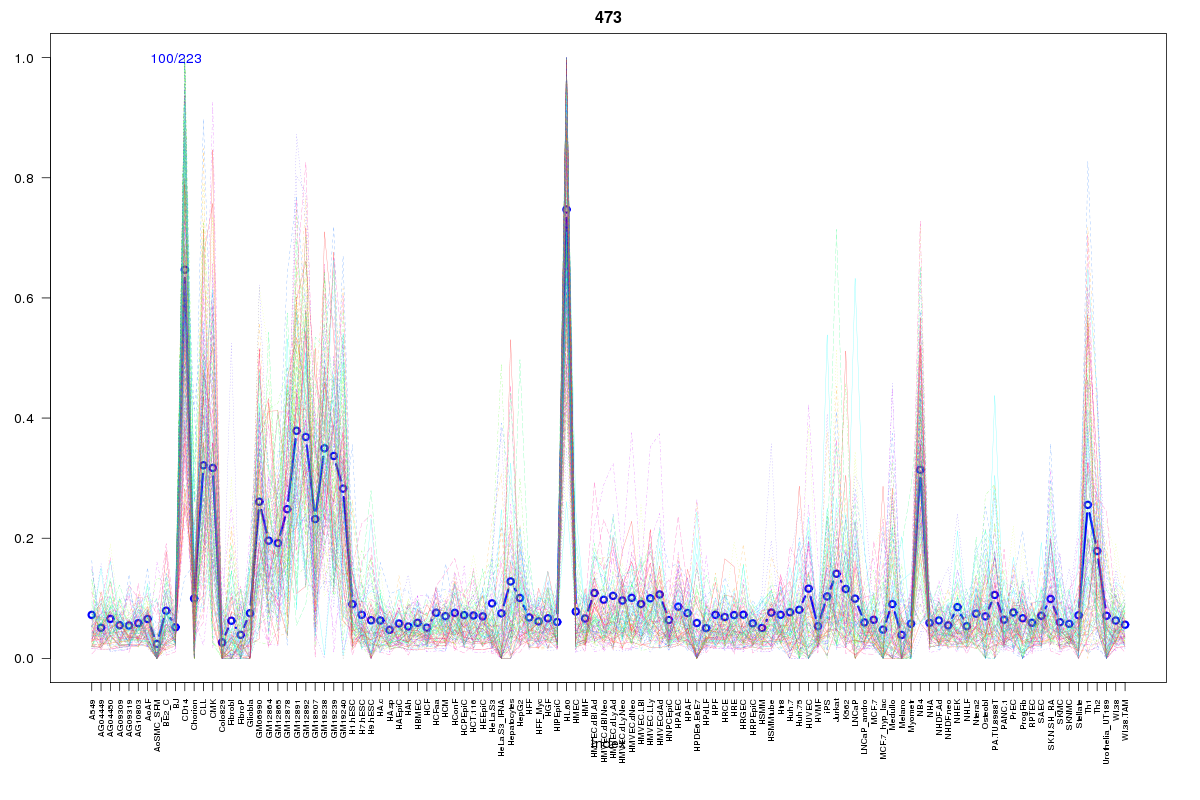 | 473 | 1 |
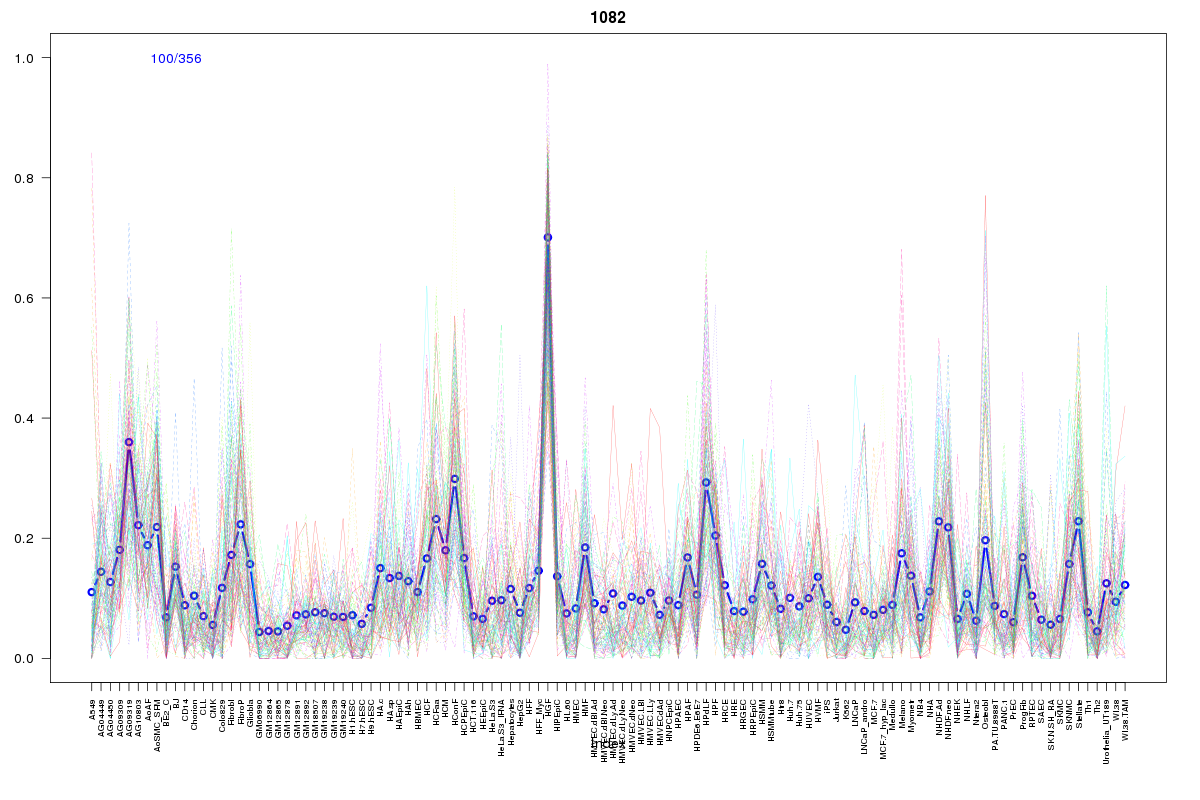 | 1082 | 1 |
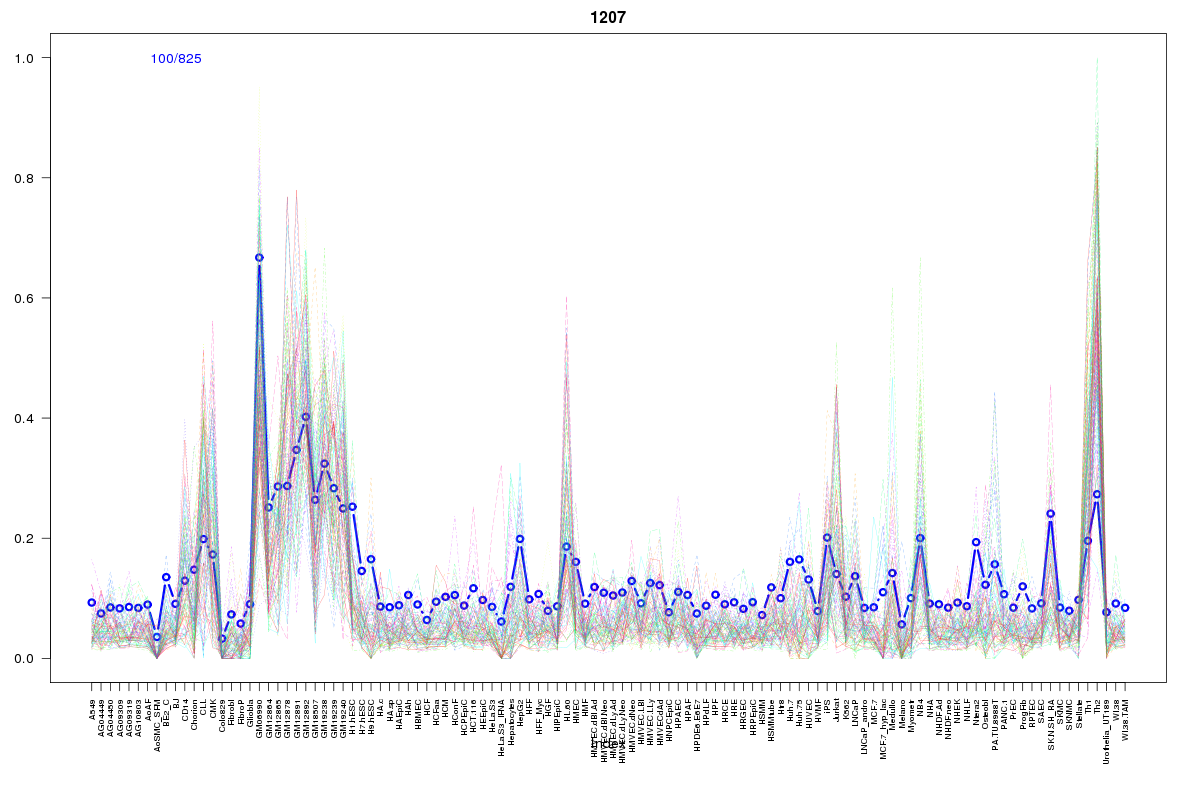 | 1207 | 1 |
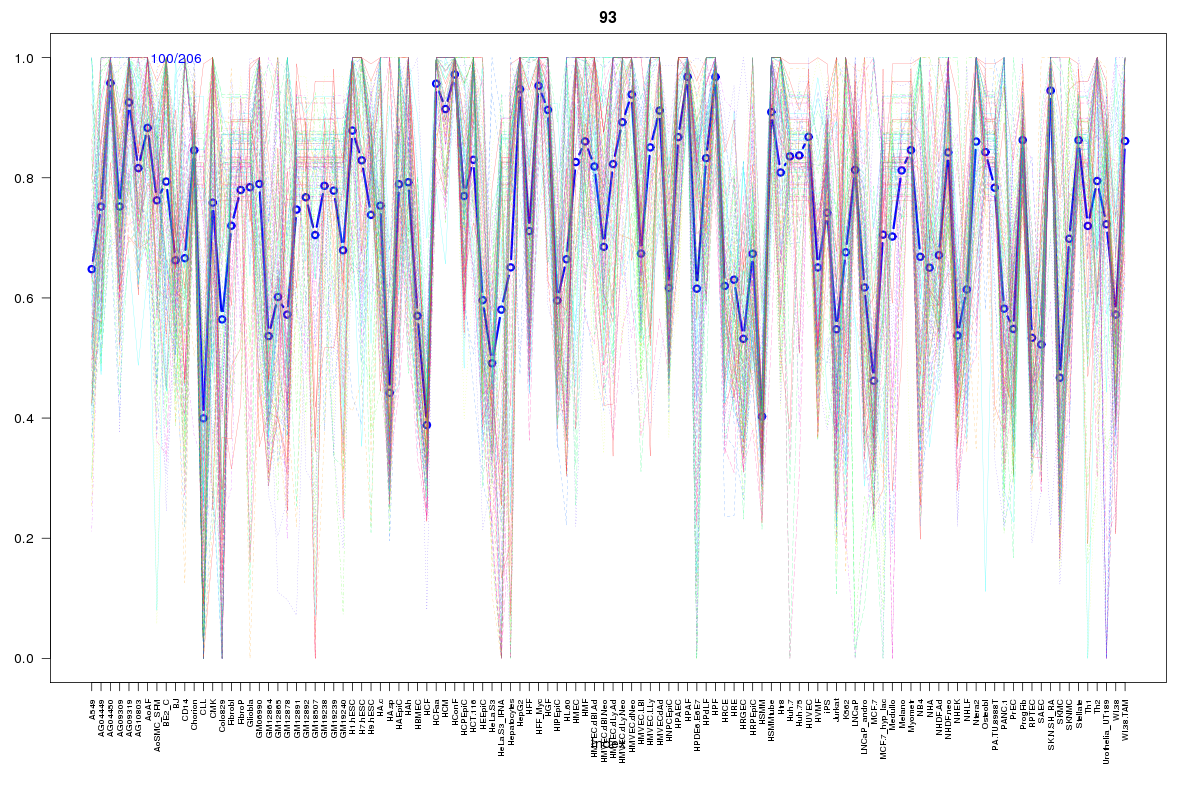 | 93 | 1 |
 | 1755 | 1 |
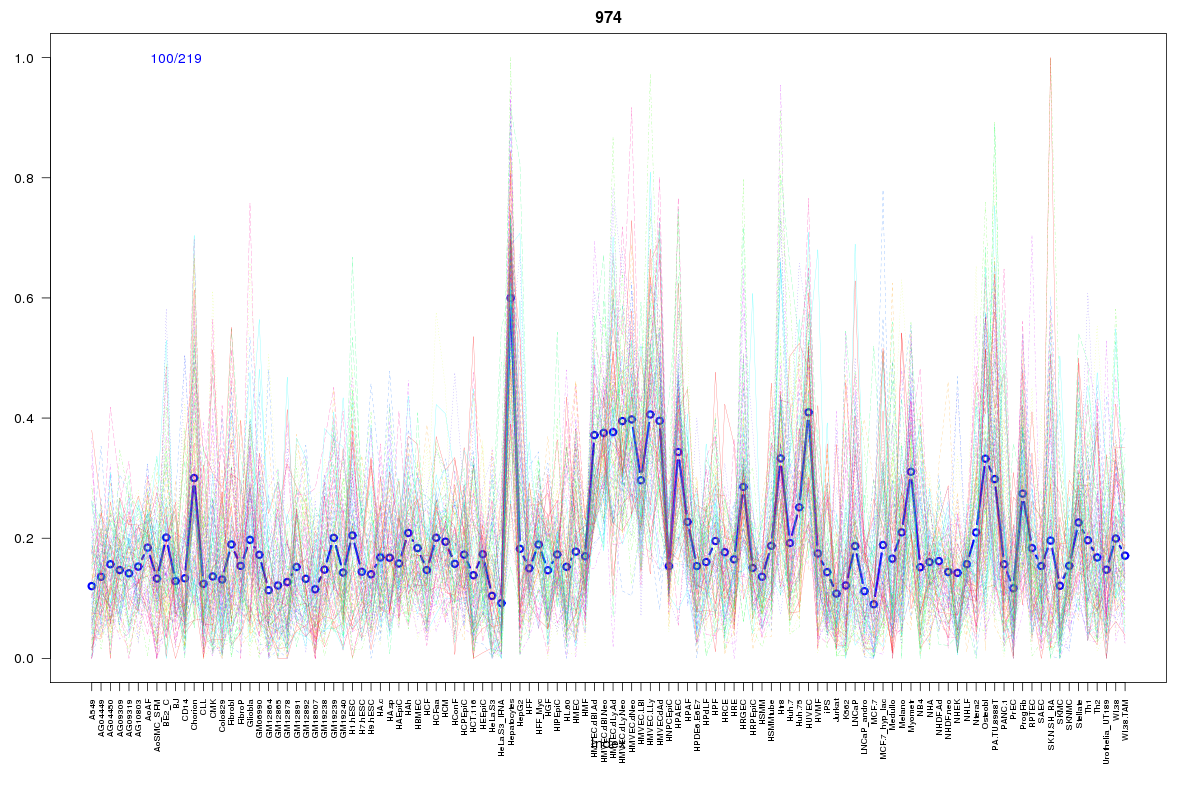 | 974 | 1 |
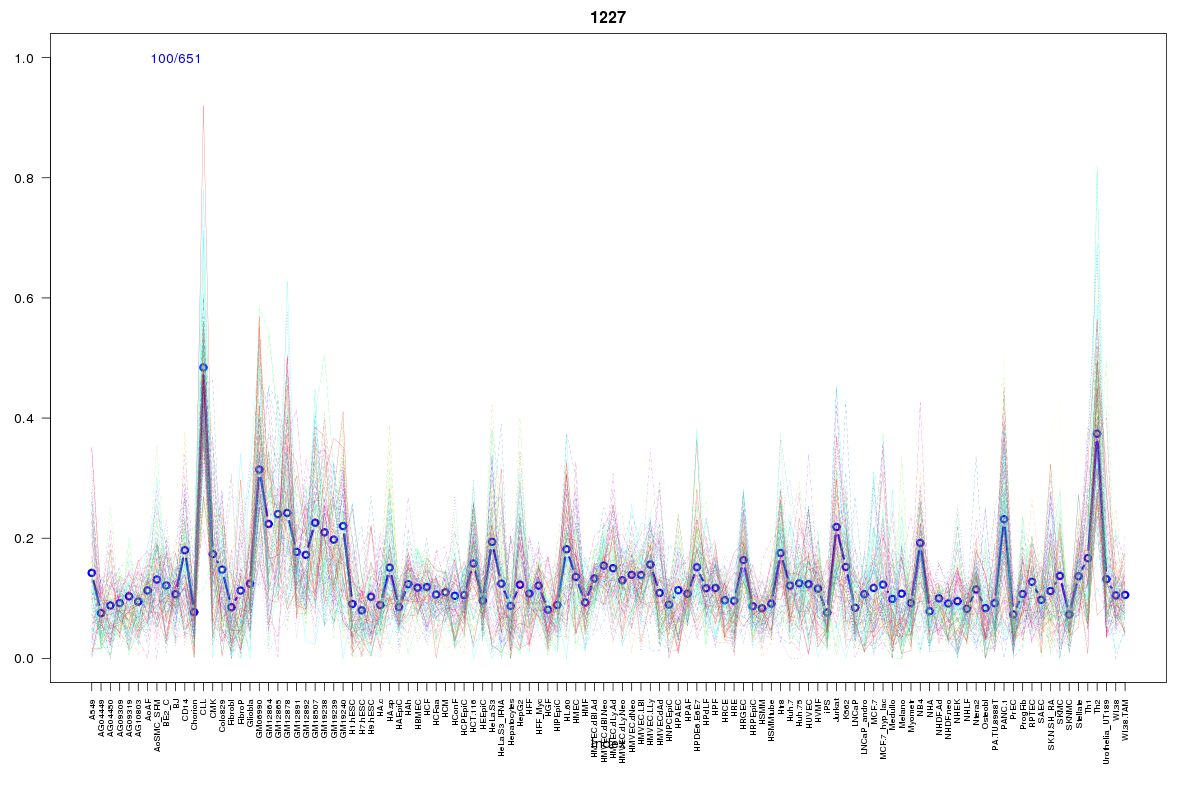 | 1227 | 1 |
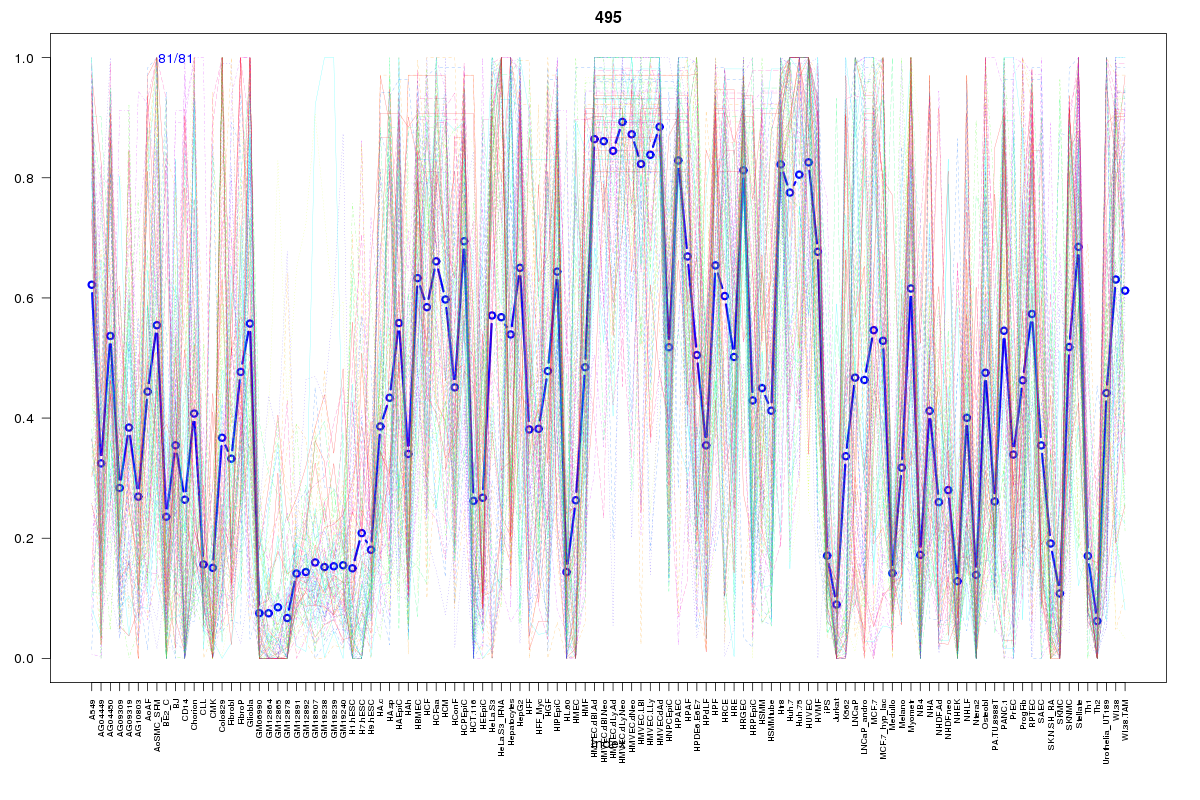 | 495 | 1 |
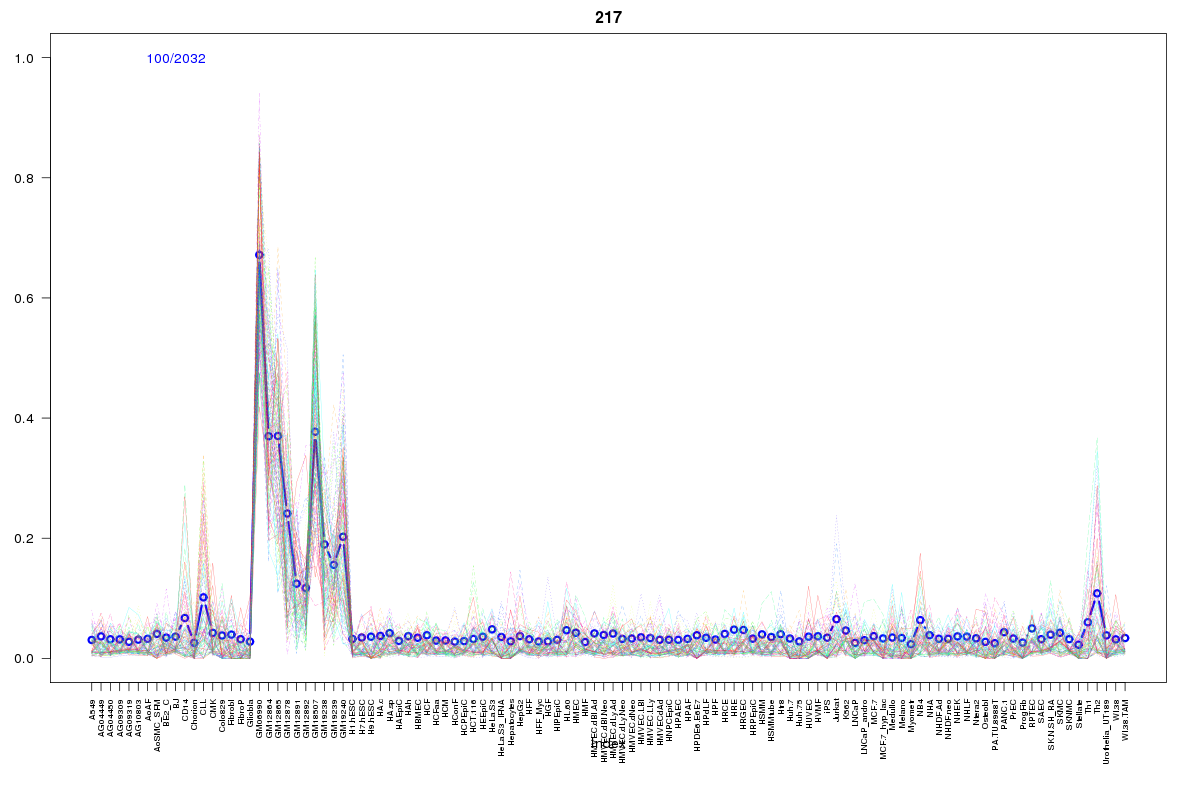 | 217 | 1 |
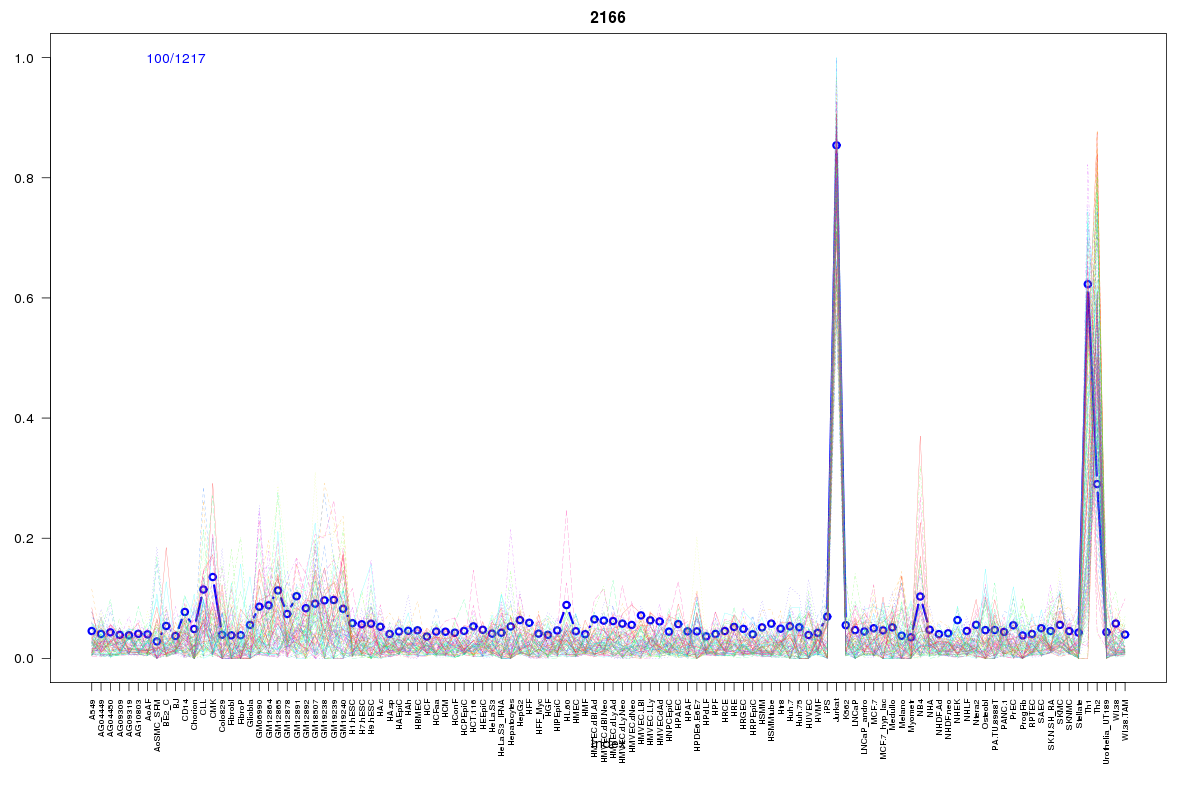 | 2166 | 1 |
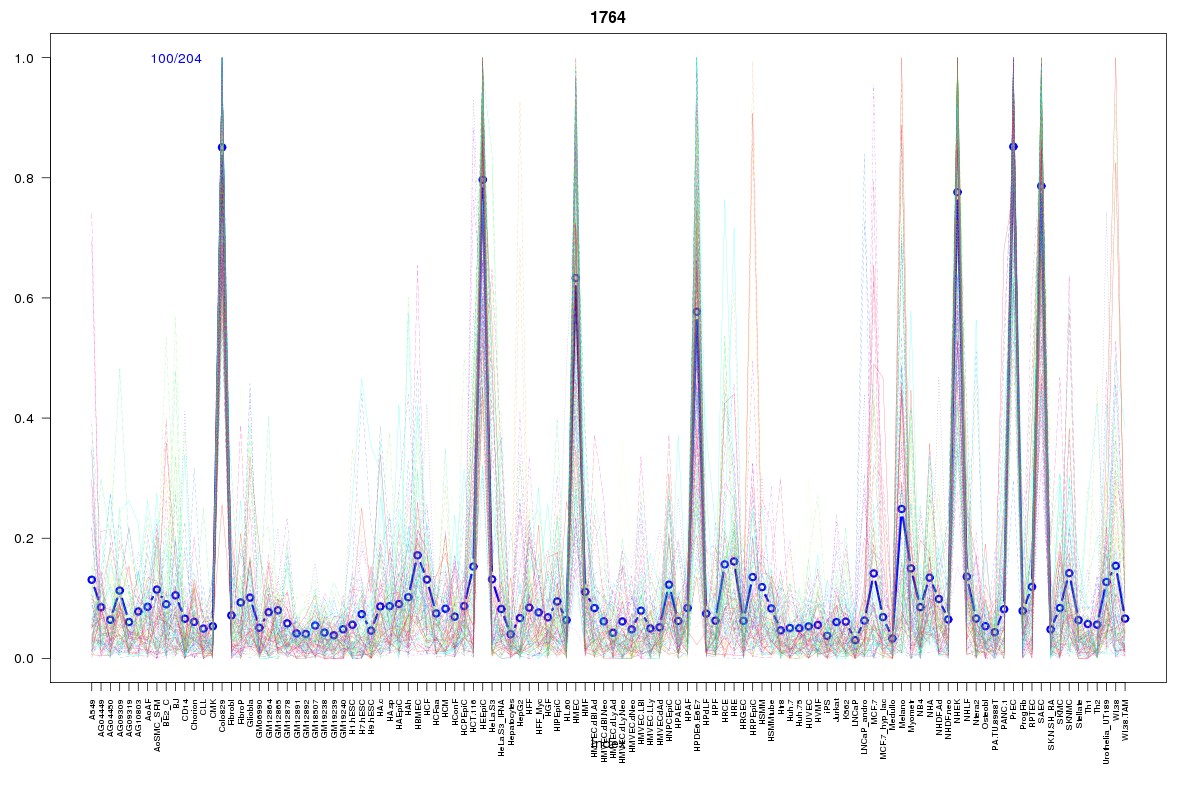 | 1764 | 1 |
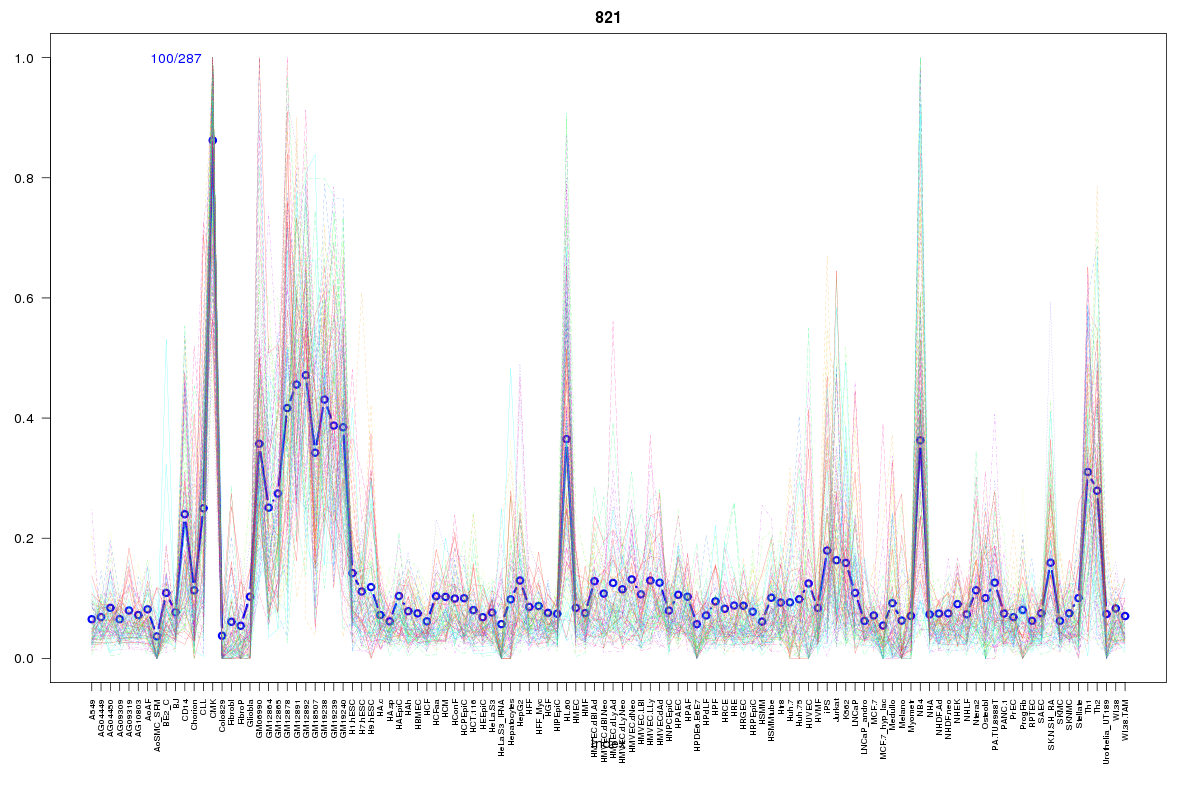 | 821 | 1 |
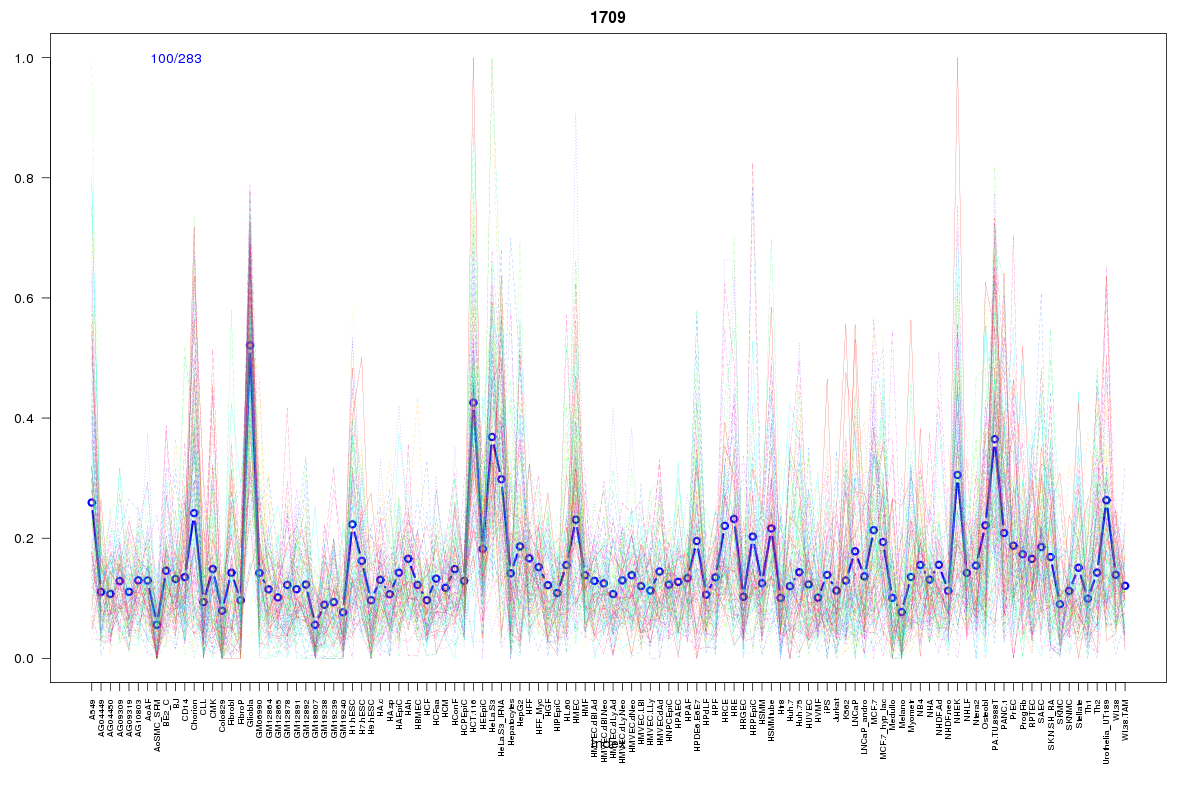 | 1709 | 1 |
 | 130 | 1 |
 | 2062 | 1 |
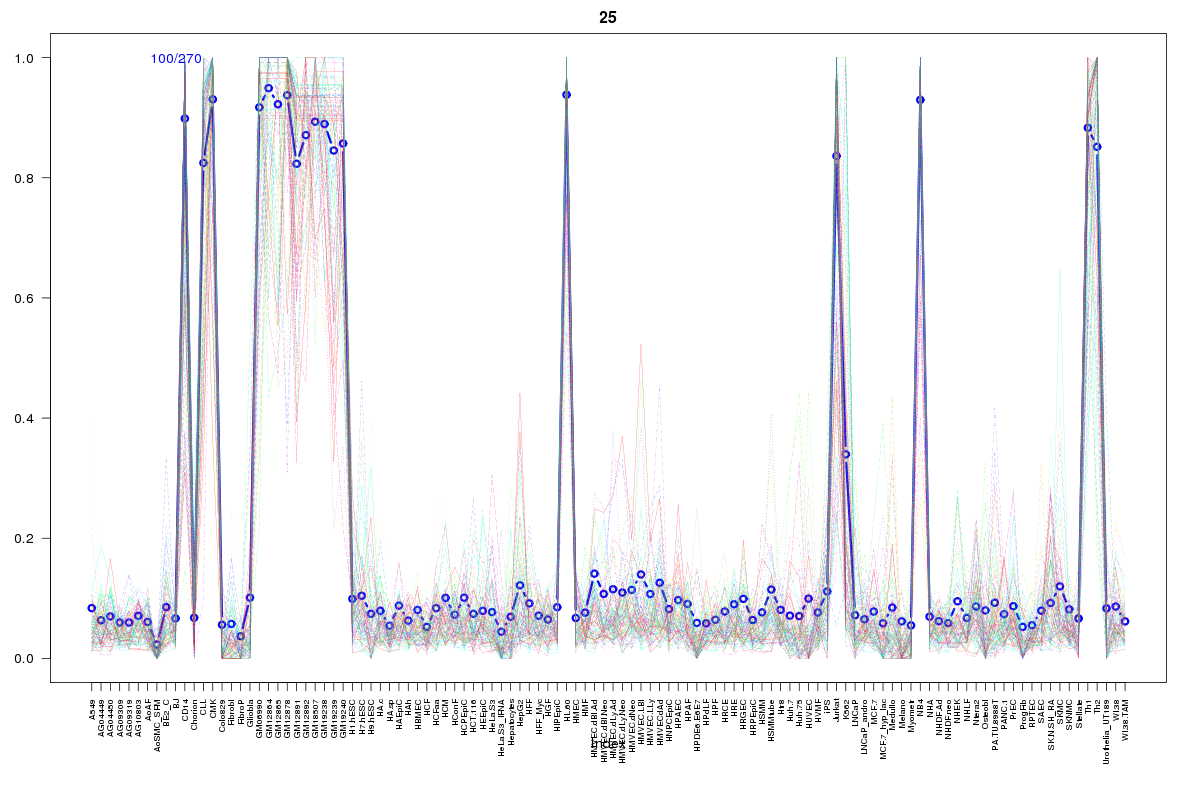 | 25 | 1 |
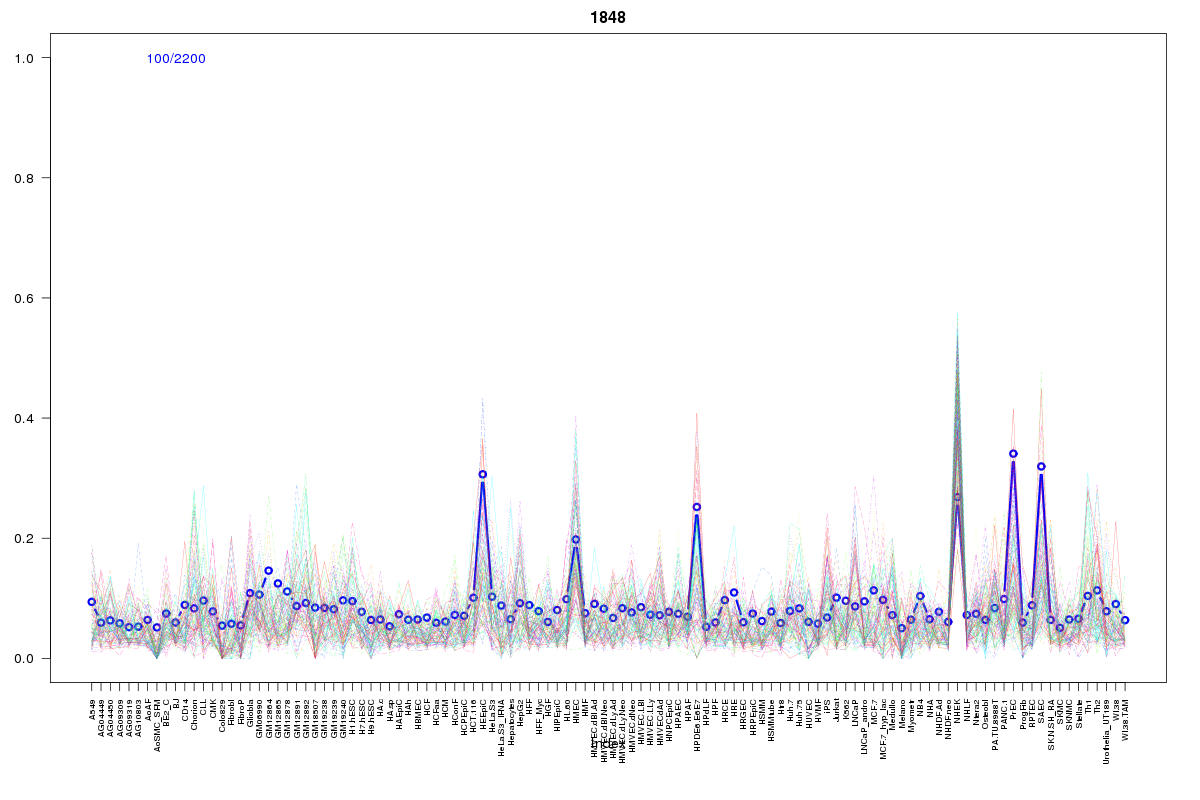 | 1848 | 1 |
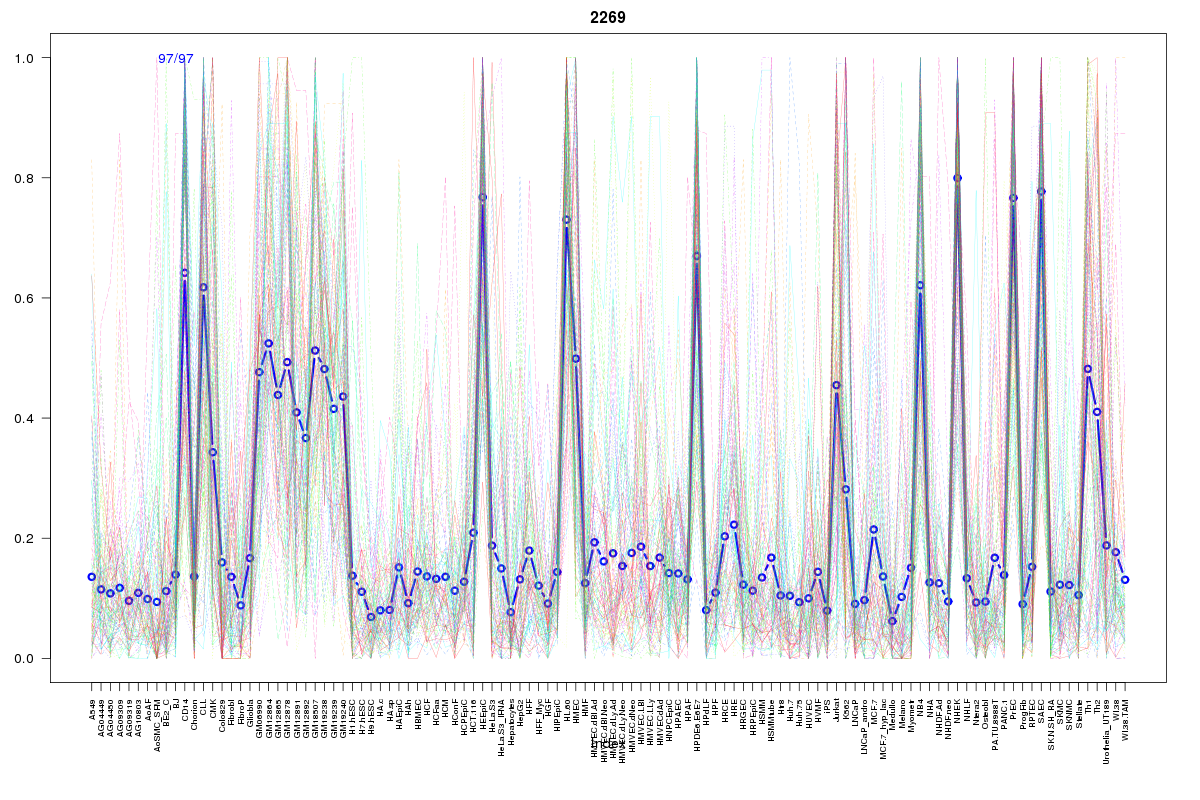 | 2269 | 1 |
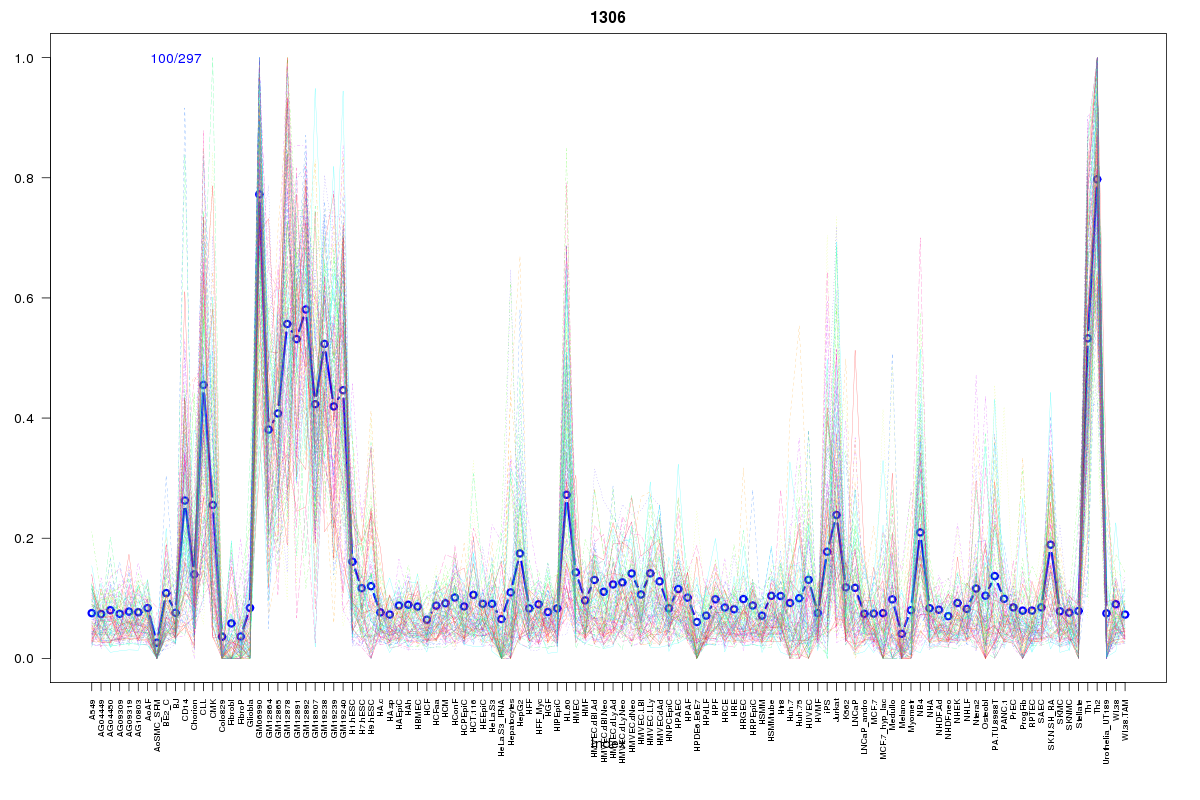 | 1306 | 1 |
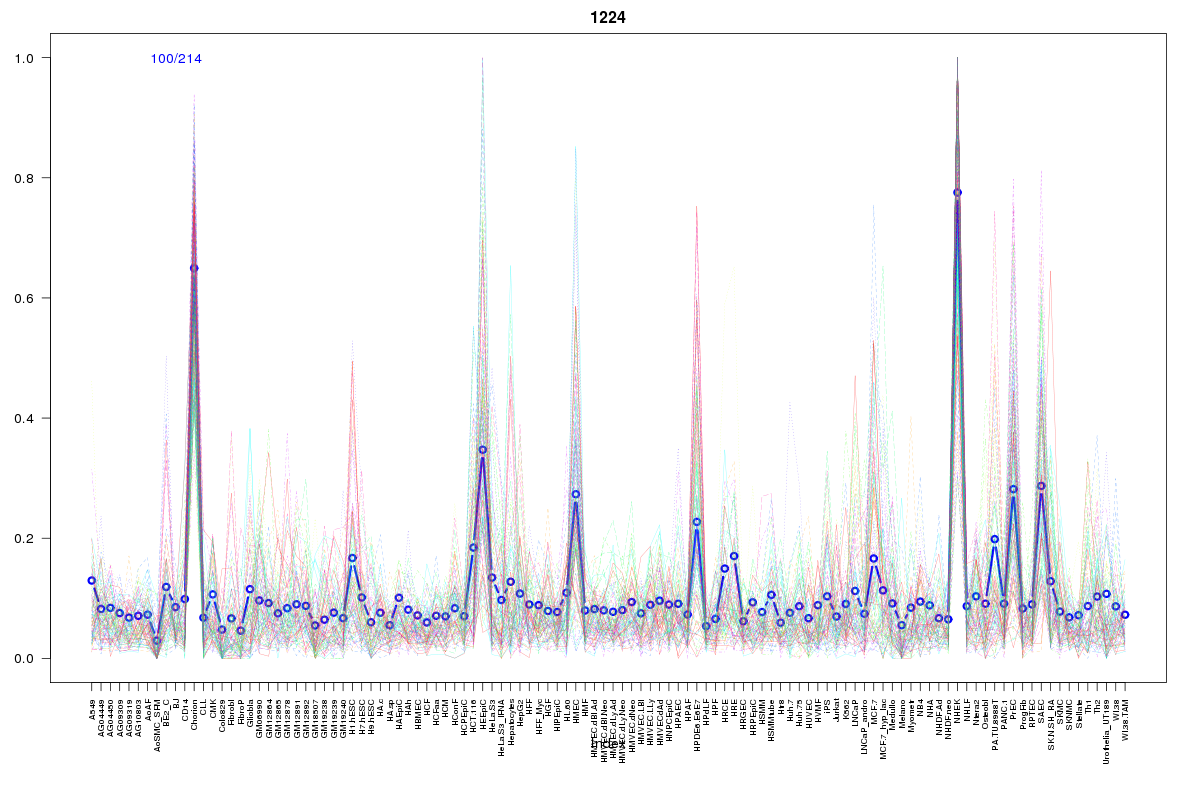 | 1224 | 1 |
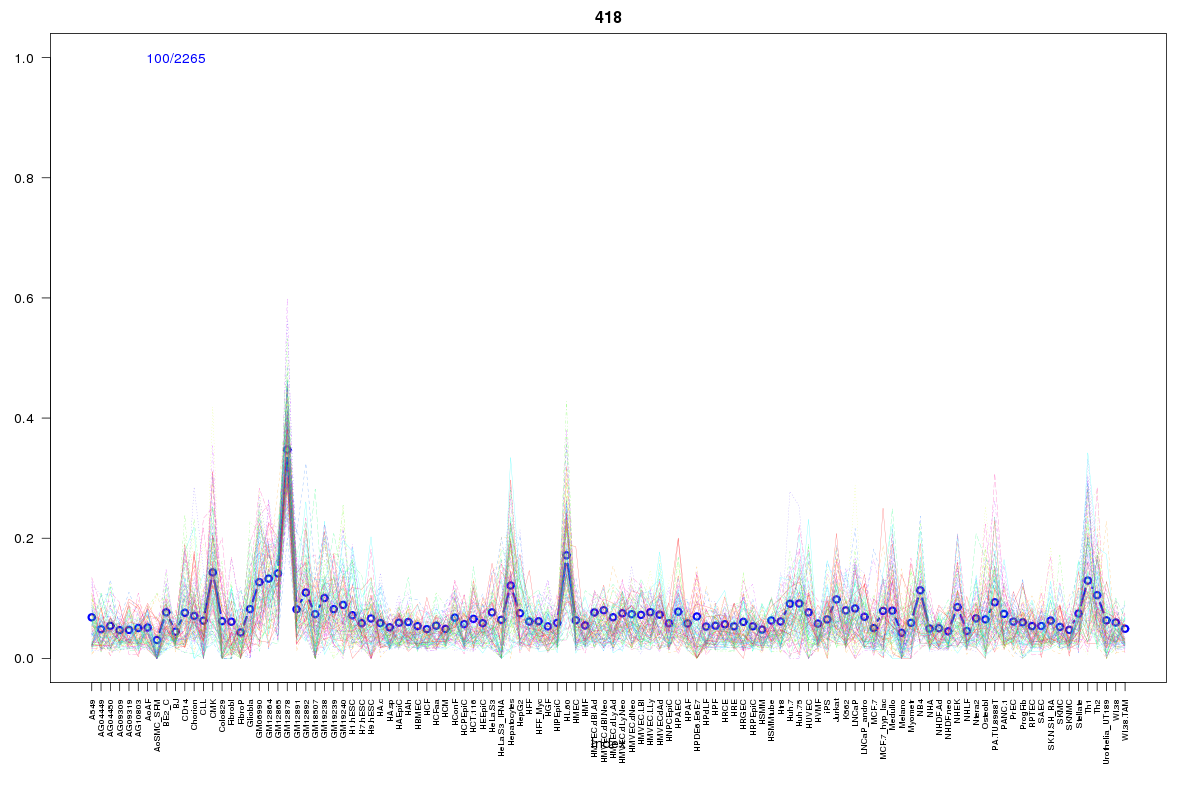 | 418 | 1 |
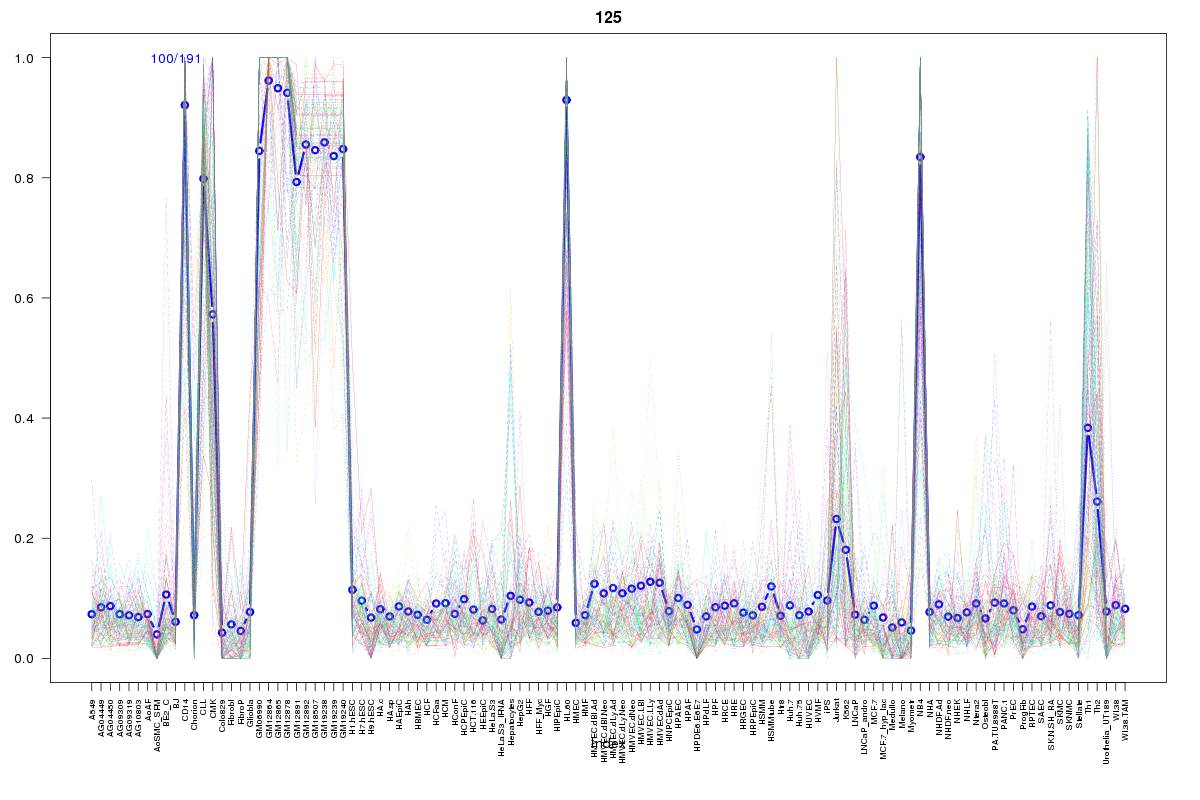 | 125 | 1 |
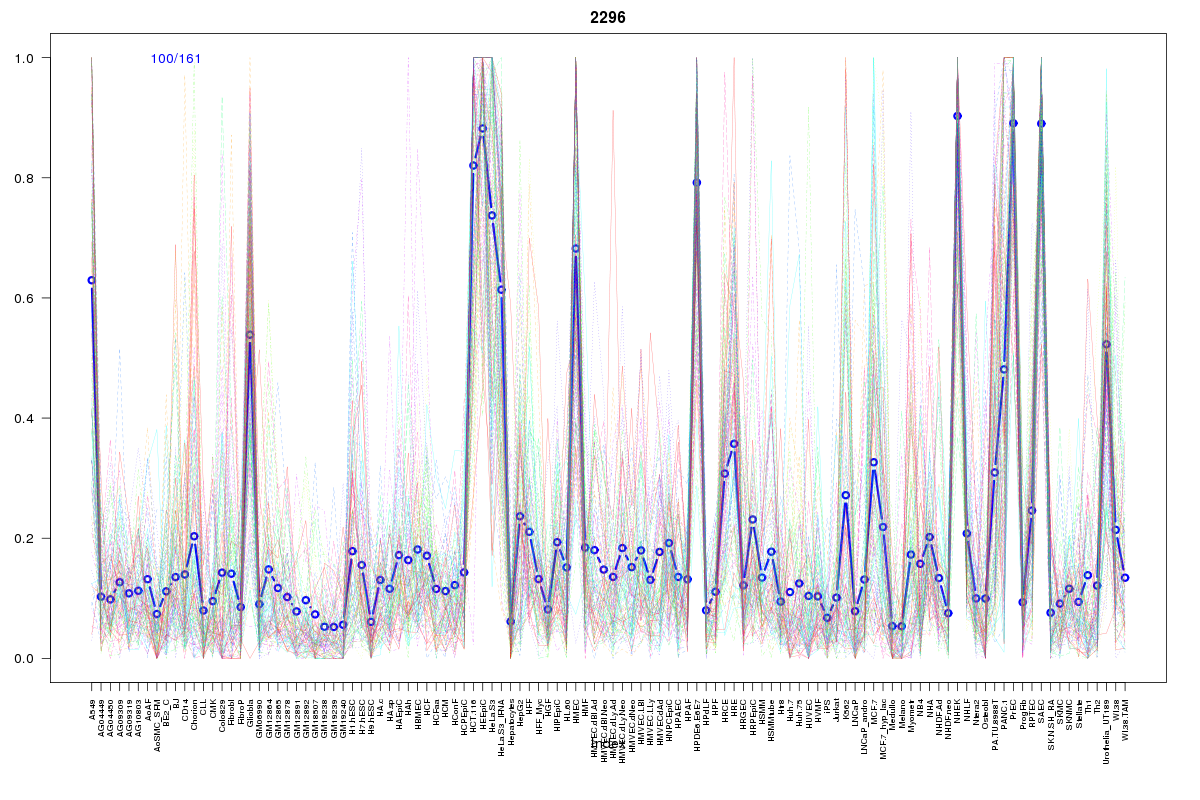 | 2296 | 1 |
 | 2298 | 1 |
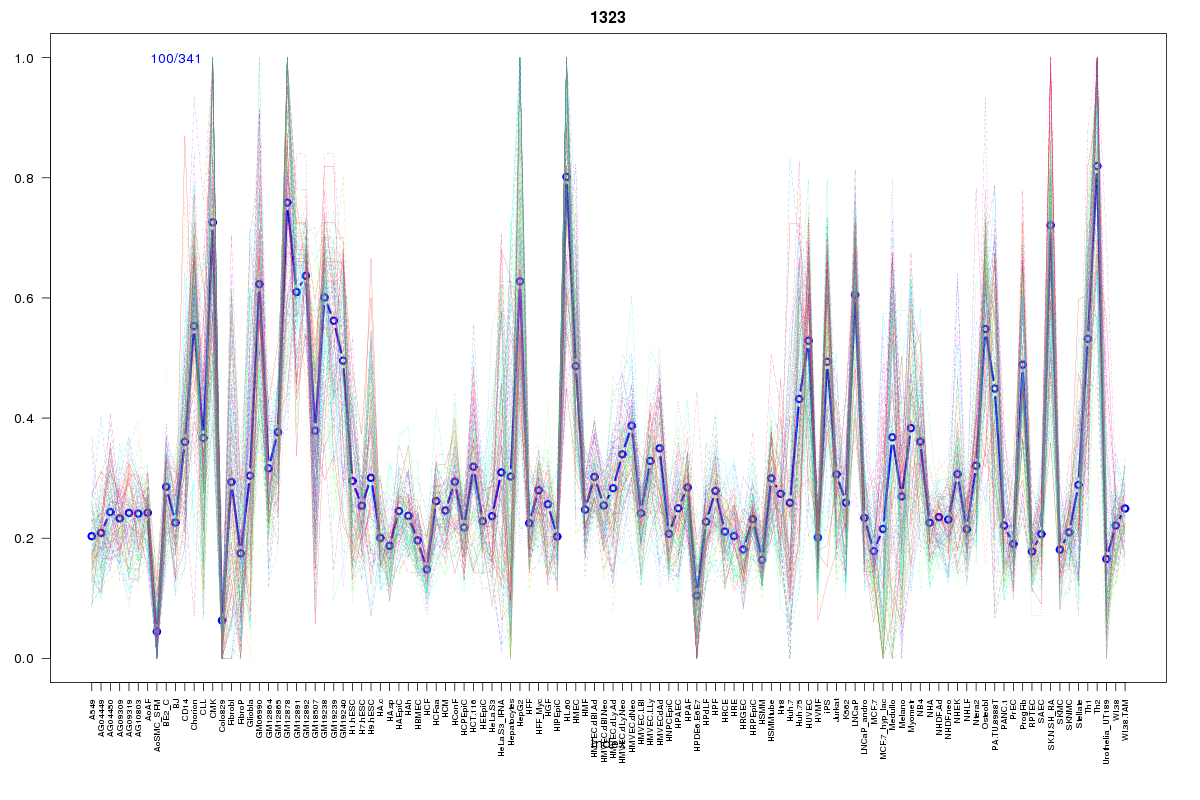 | 1323 | 1 |
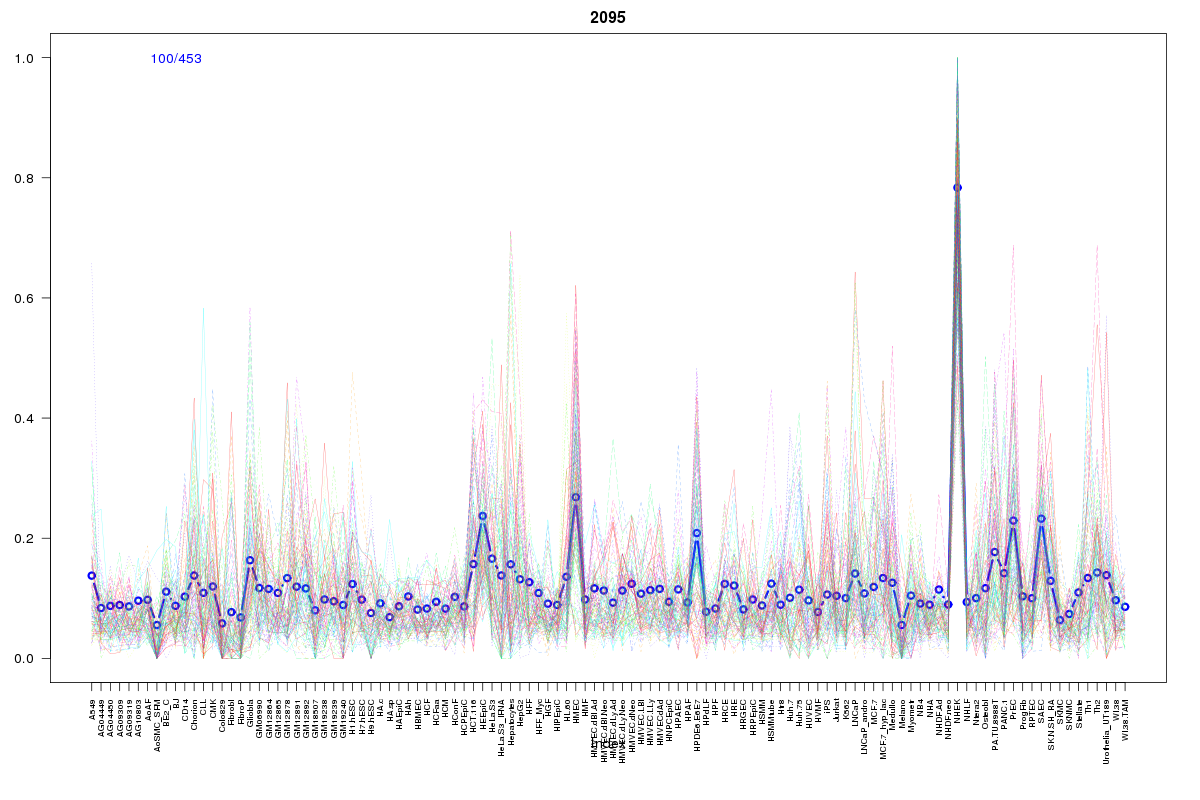 | 2095 | 1 |
 | 430 | 1 |
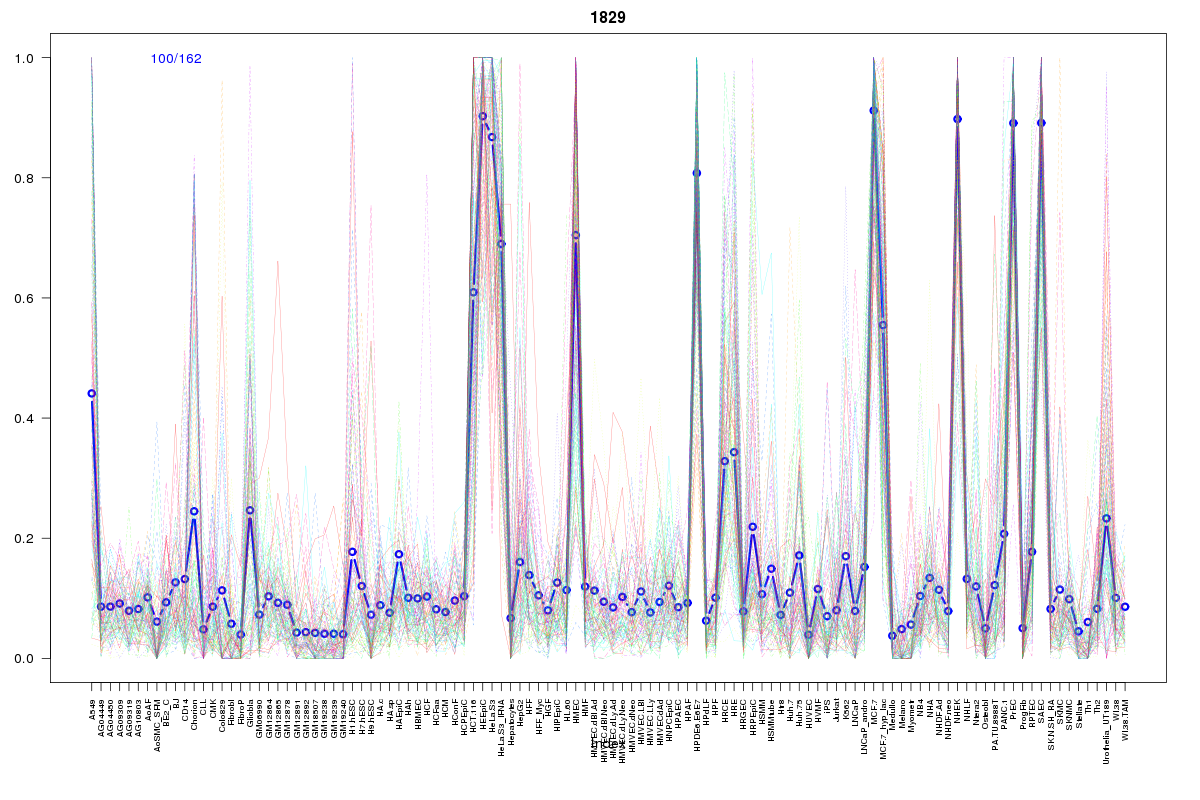 | 1829 | 1 |
 | 2116 | 1 |
Resources
BED file downloads
Connects to 44 DHS sitesTop 10 Correlated DHS Sites
p-values indiciate significant higher or lower correlation| Location | Cluster | P-value |
|---|---|---|
| chr19:3135980-3136130 | 281 | 0 |
| chr19:3136140-3136290 | 2269 | 0 |
| chr19:3136420-3136570 | 418 | 0 |
| chr19:3136820-3136970 | 2298 | 0 |
| chr19:3180000-3180150 | 372 | 0.005 |
| chr19:3146505-3146655 | 1207 | 0.005 |
| chr19:3179765-3179915 | 372 | 0.005 |
| chr19:3133800-3133950 | 2062 | 0.007 |
| chr19:3178400-3178550 | 281 | 0.007 |
| chr19:3146040-3146190 | 473 | 0.007 |
| chr19:3179320-3179470 | 372 | 0.007 |
External Databases
UCSCEnsembl (ENSG00000060558)