Gene: ACAA1
chr3: 38144619-38164574Expression Profile
(log scale)
Graphical Connections
Distribution of linked clusters:
You may find it interesting if many of the connected DHS sites belong to the same cluster.| Cluster Profile | Cluster ID | Number of DHS sites in this cluster |
|---|---|---|
 | 927 | 6 |
 | 2072 | 3 |
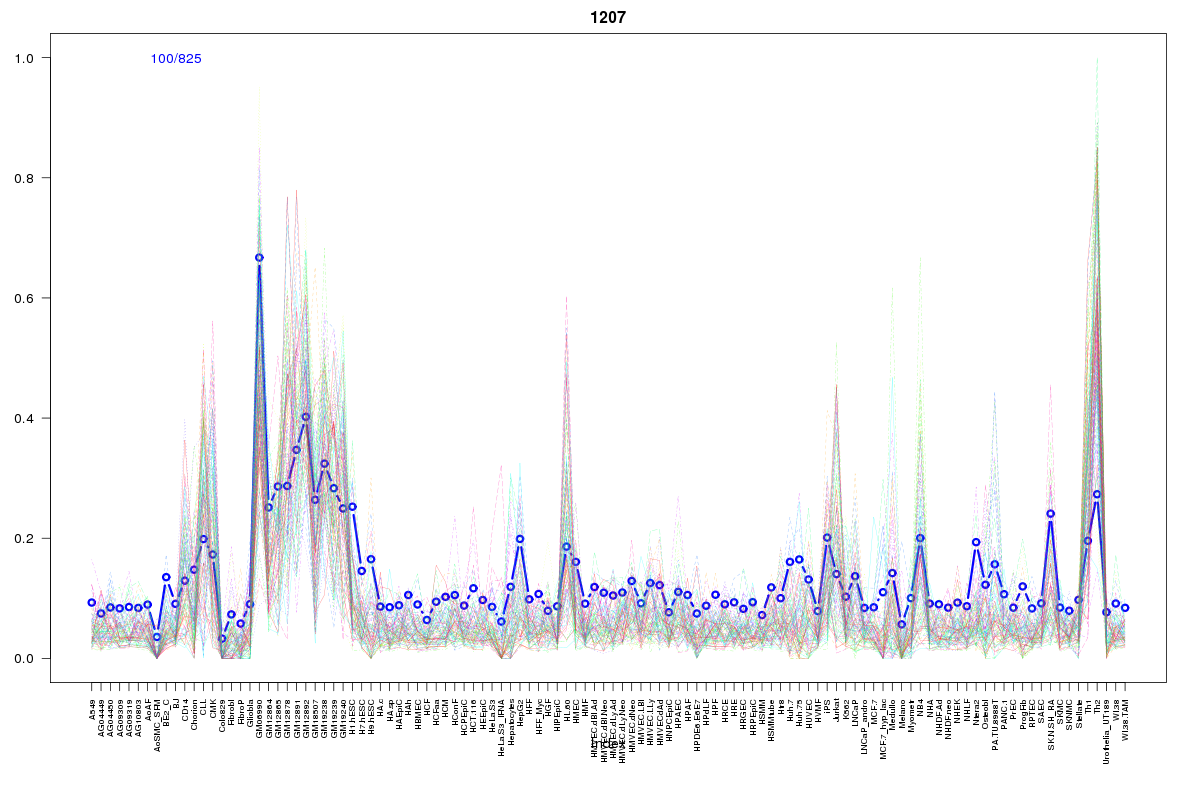 | 1207 | 2 |
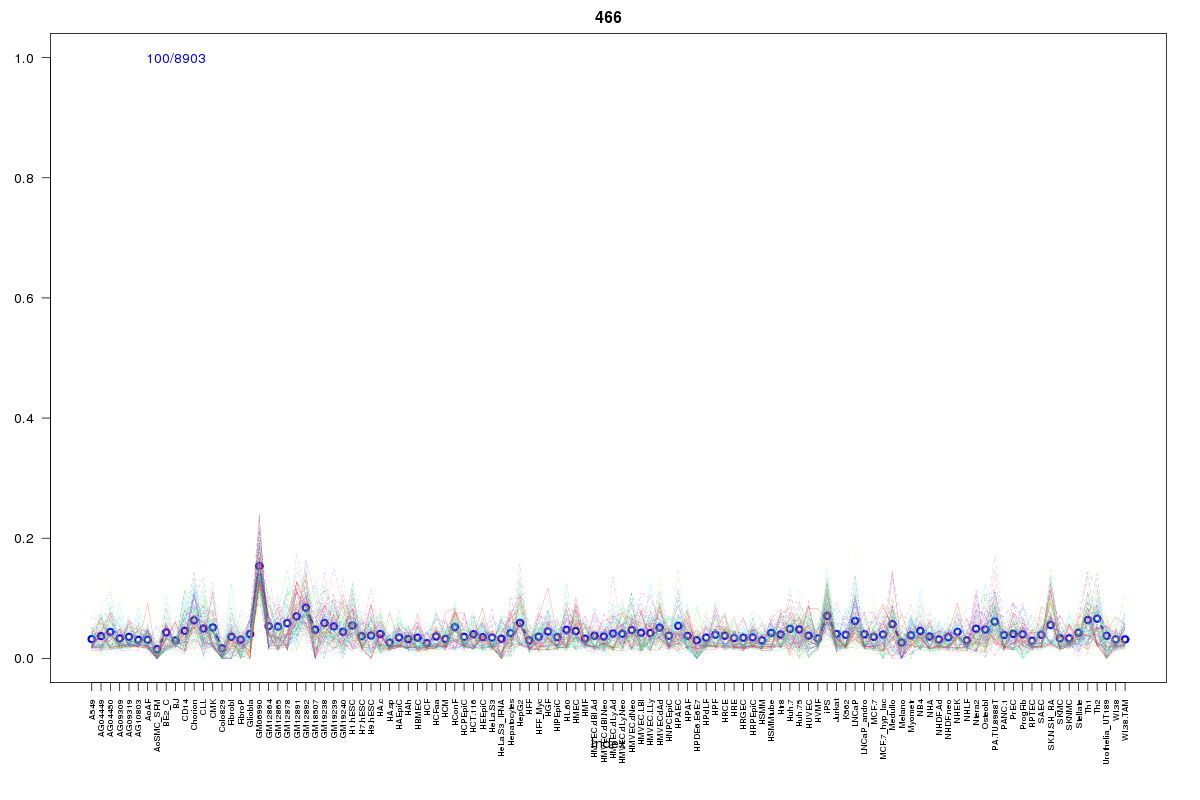 | 466 | 2 |
 | 2068 | 1 |
 | 133 | 1 |
 | 1078 | 1 |
 | 1605 | 1 |
 | 860 | 1 |
 | 66 | 1 |
 | 1056 | 1 |
 | 2211 | 1 |
 | 1755 | 1 |
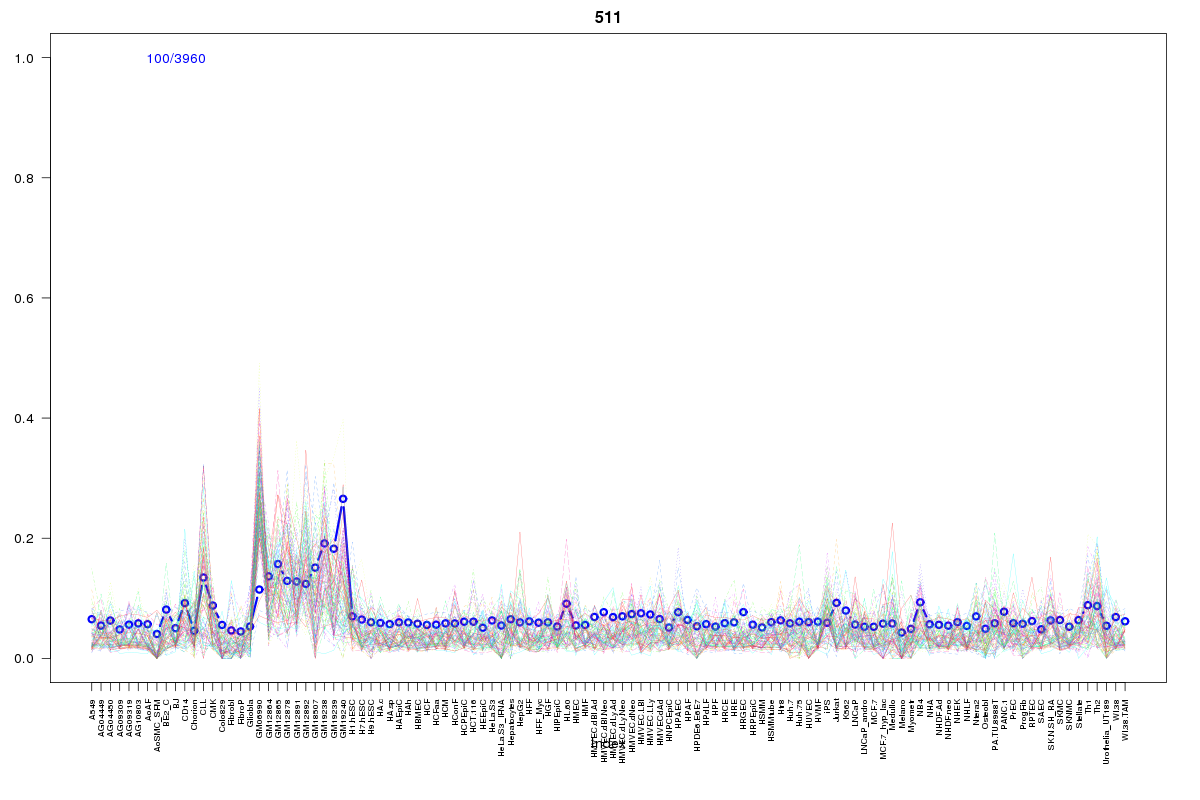 | 511 | 1 |
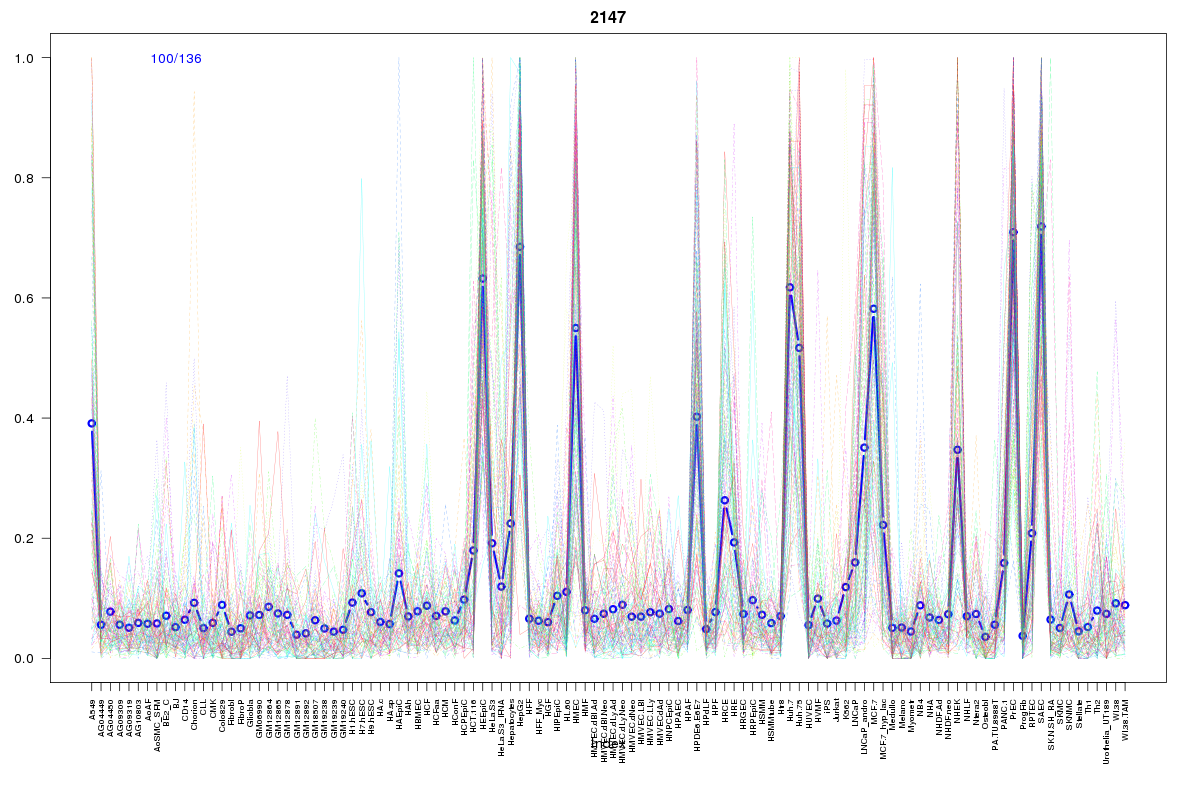 | 2147 | 1 |
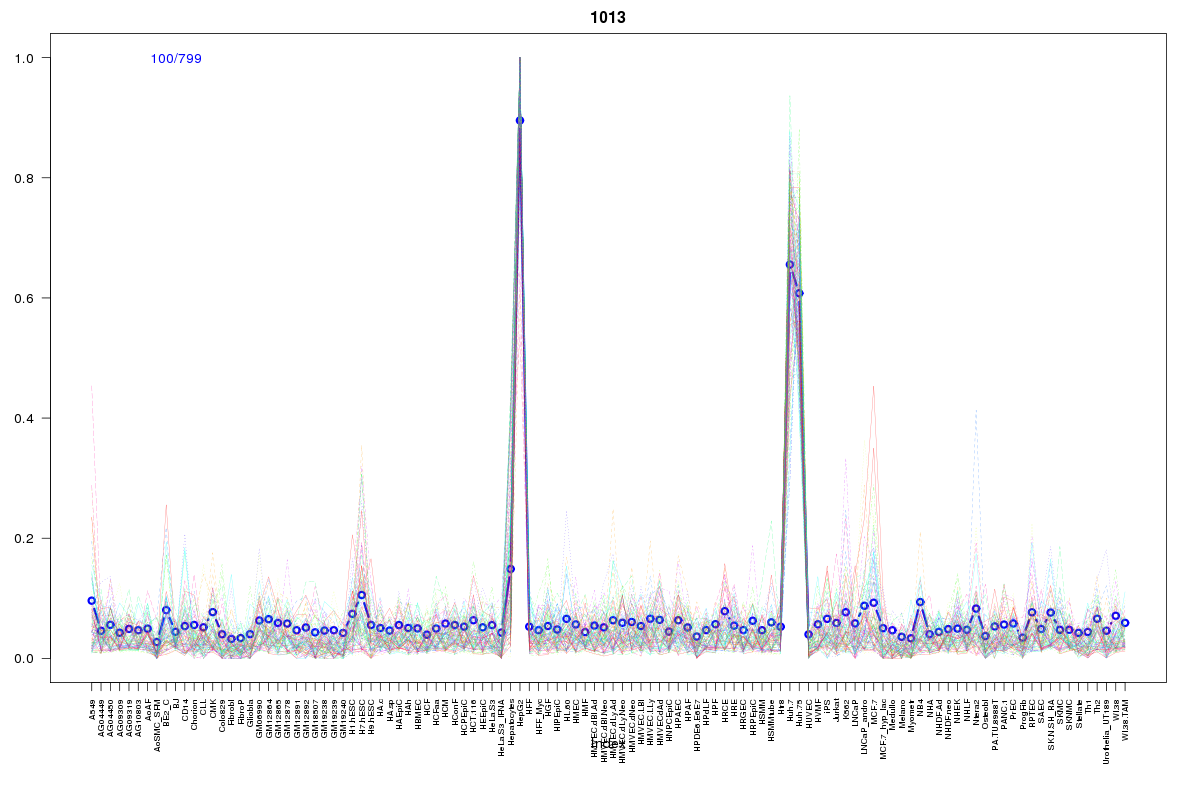 | 1013 | 1 |
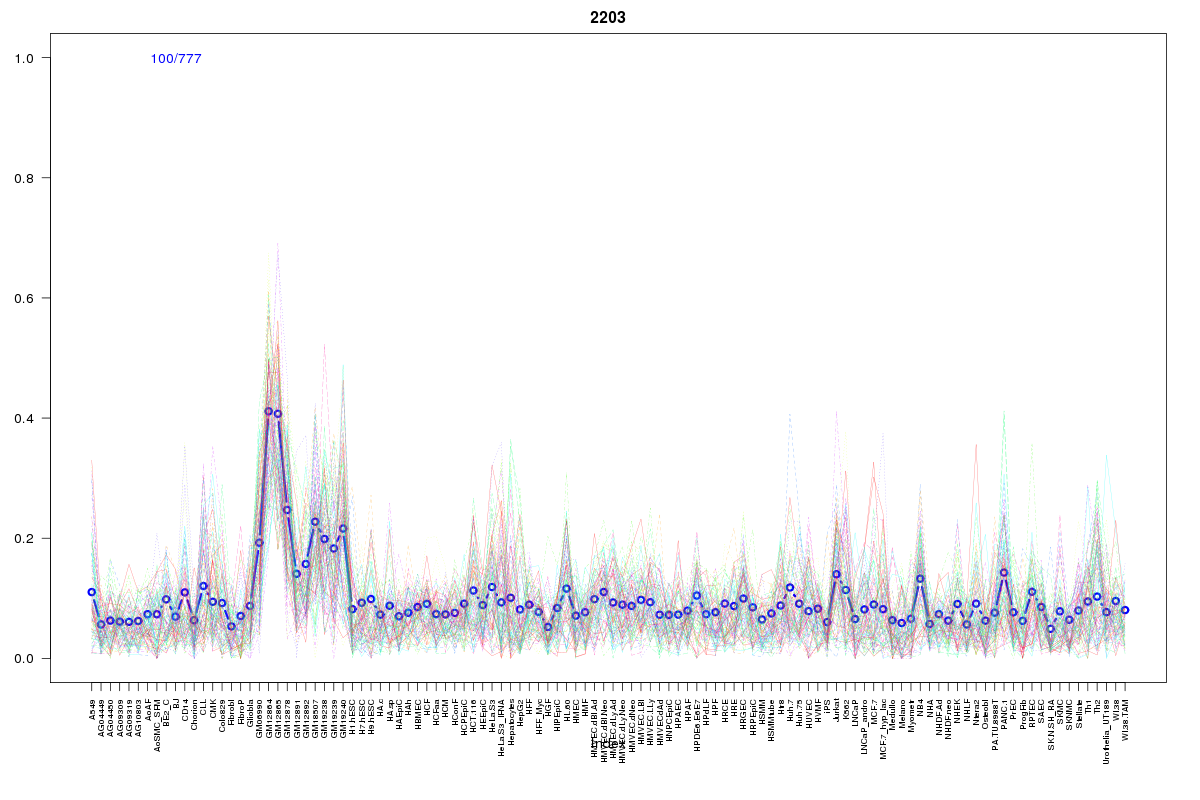 | 2203 | 1 |
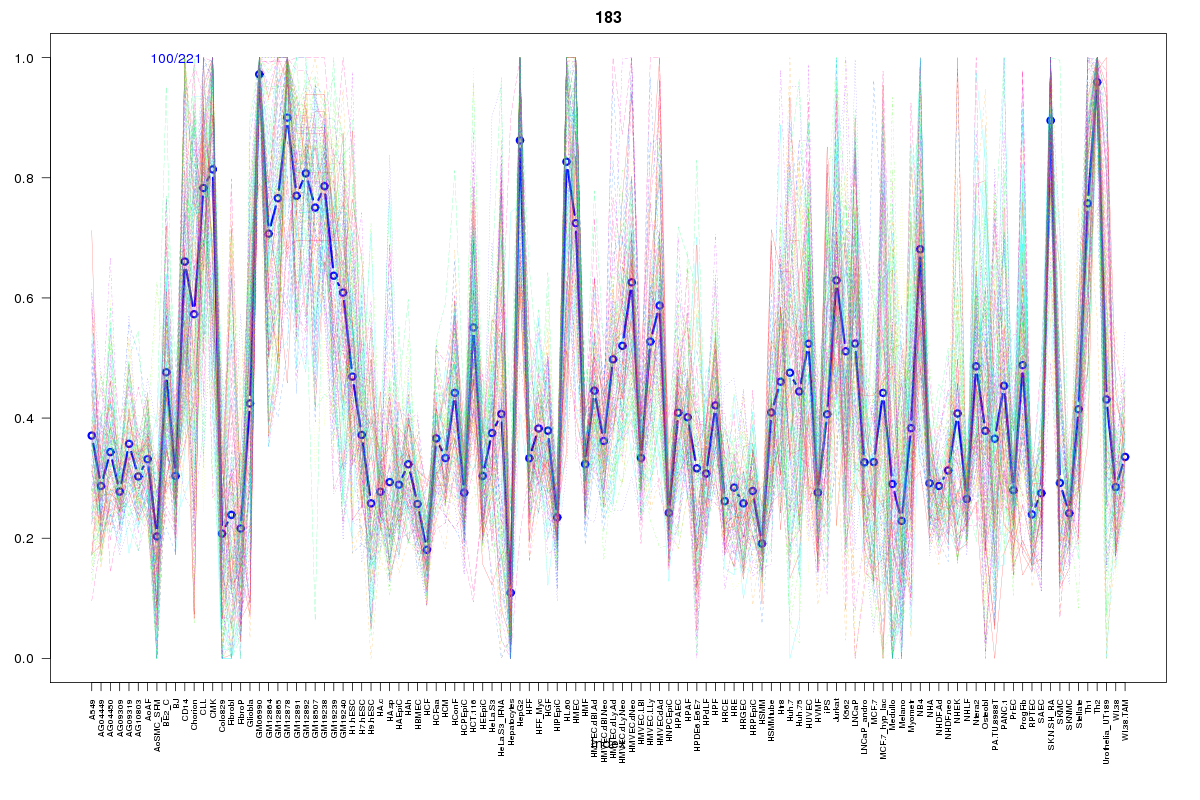 | 183 | 1 |
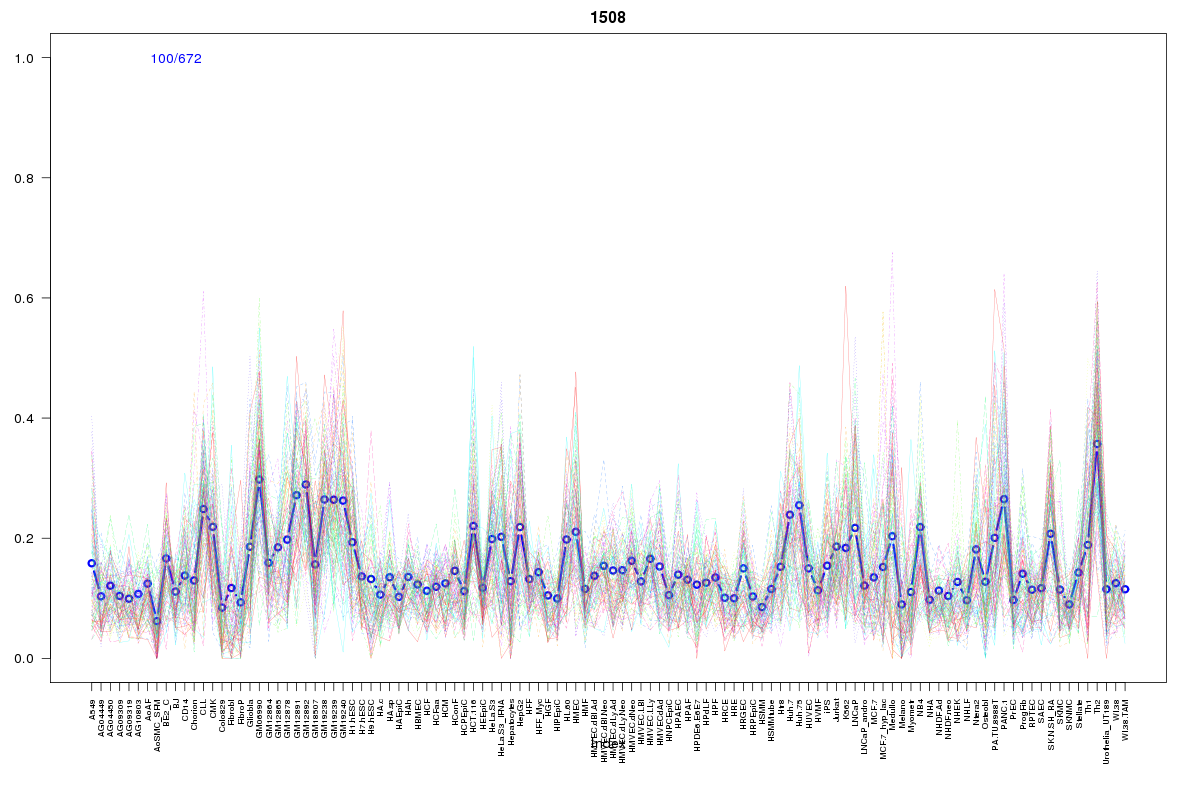 | 1508 | 1 |
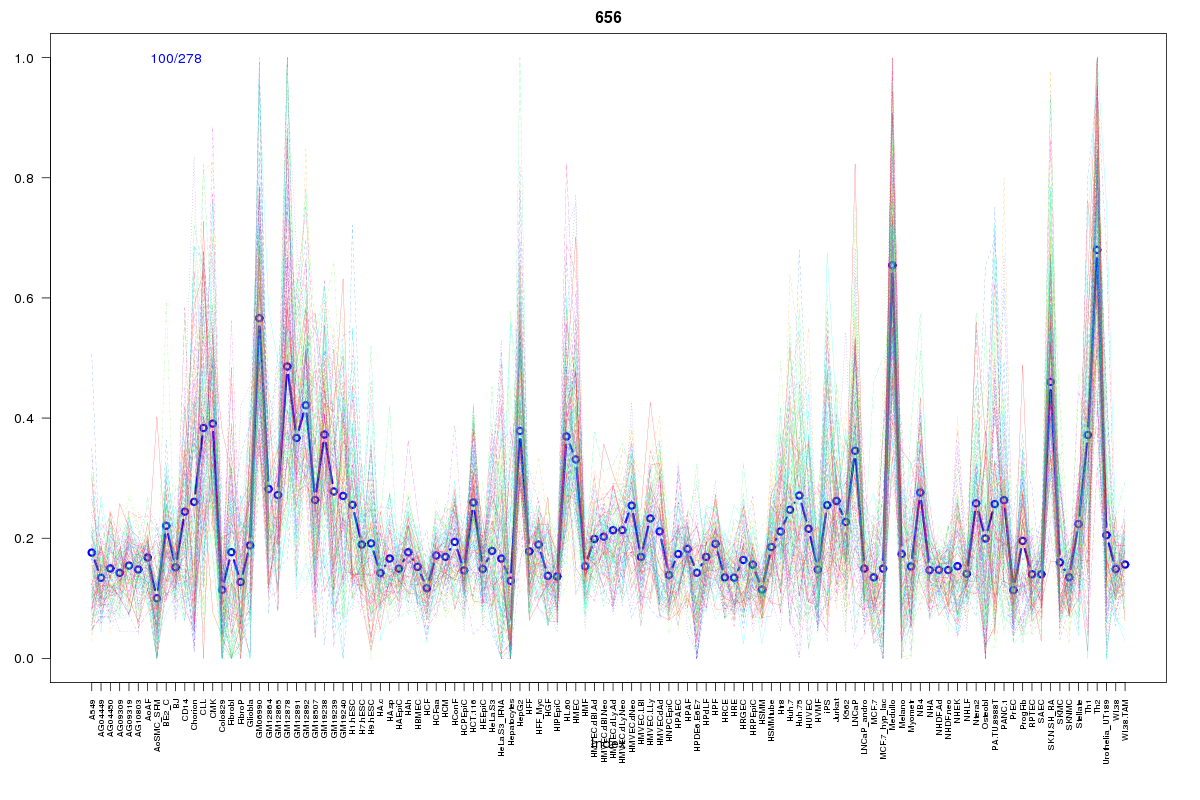 | 656 | 1 |
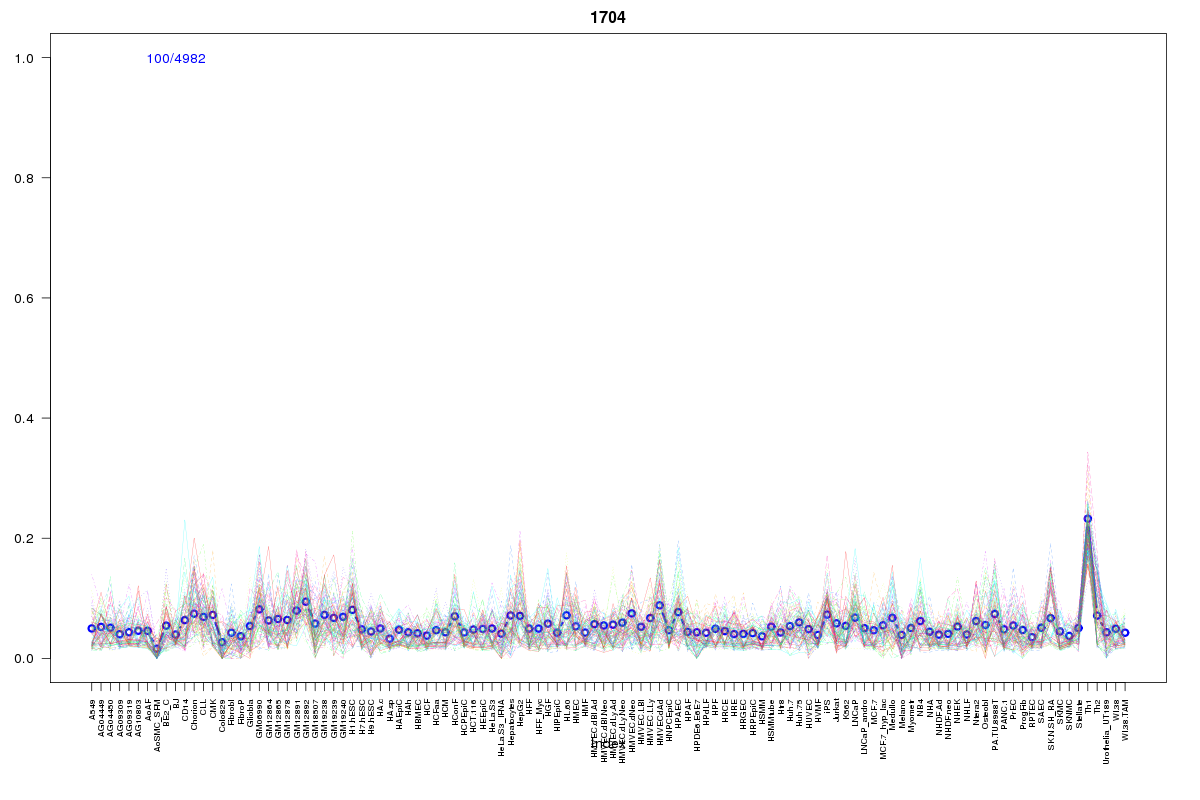 | 1704 | 1 |
 | 629 | 1 |
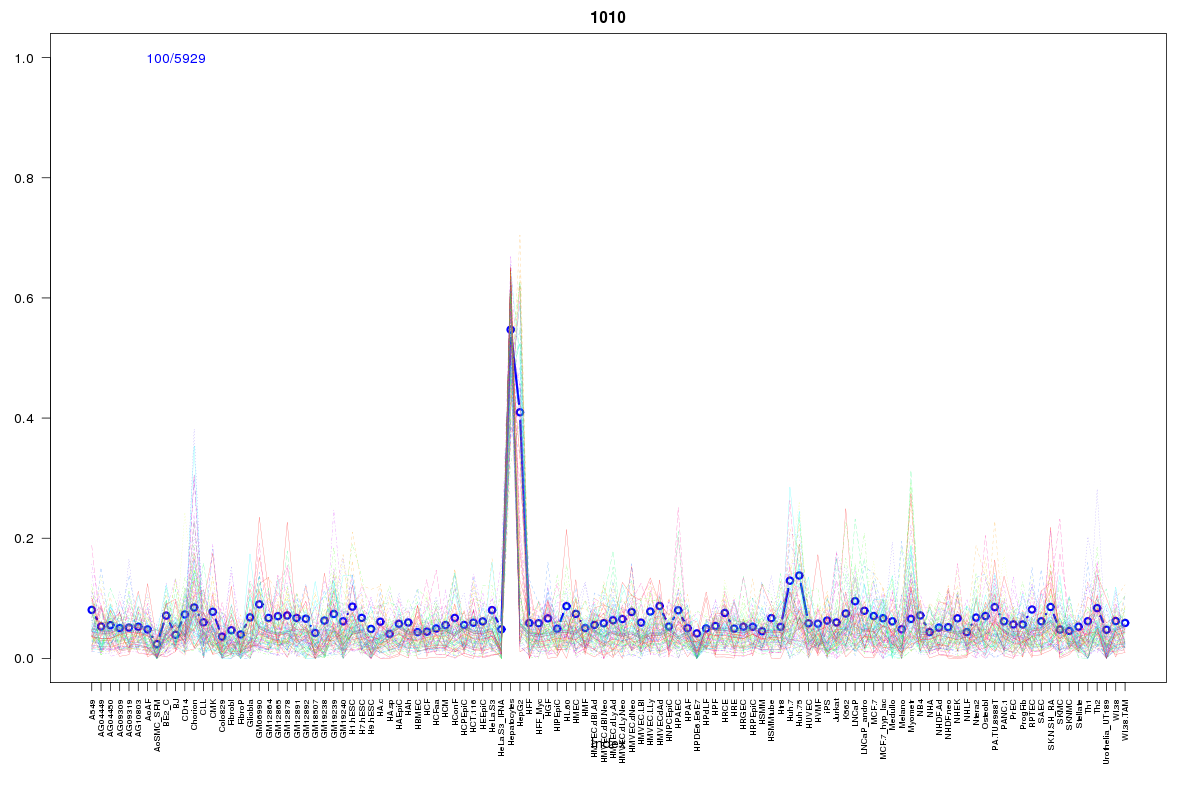 | 1010 | 1 |
 | 569 | 1 |
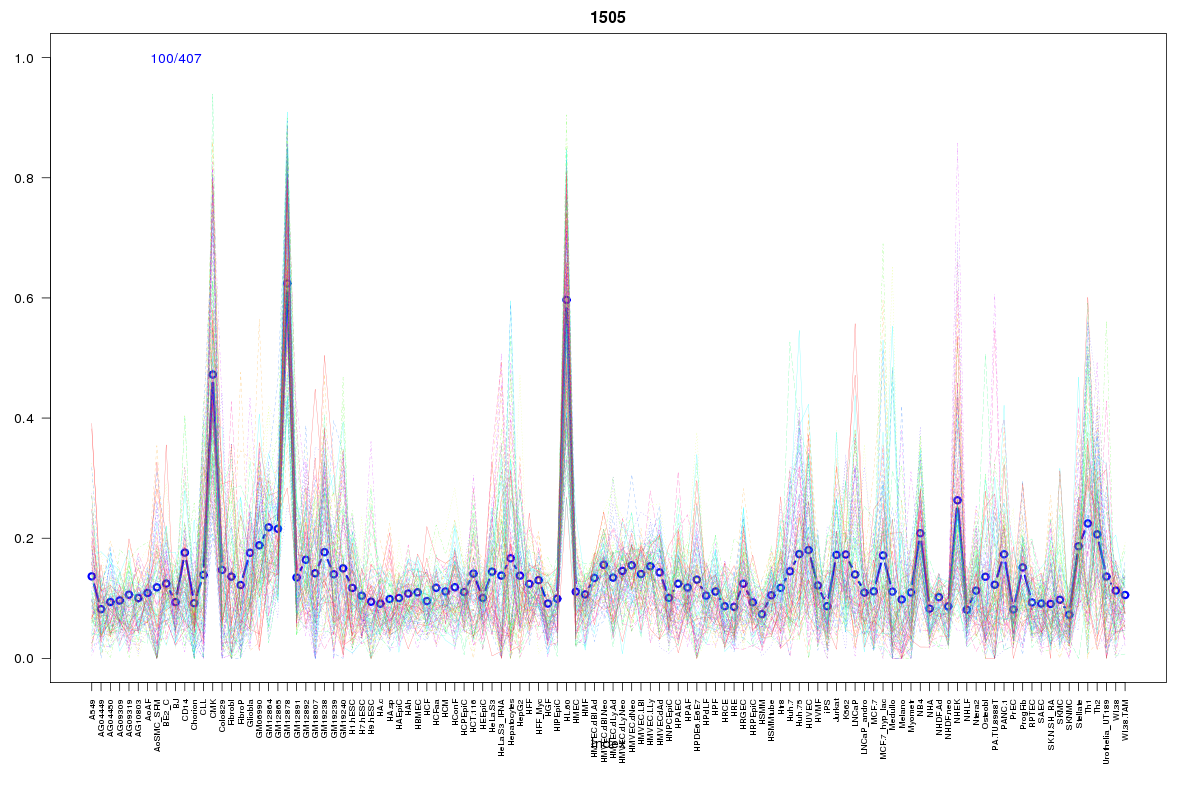 | 1505 | 1 |
 | 2017 | 1 |
Resources
BED file downloads
Connects to 35 DHS sitesTop 10 Correlated DHS Sites
p-values indiciate significant higher or lower correlation| Location | Cluster | P-value |
|---|---|---|
| chr3:38204720-38204870 | 1505 | 0 |
| chr3:38180700-38180850 | 629 | 0 |
| chr3:38205480-38205630 | 2017 | 0.001 |
| chr3:38179620-38179770 | 1207 | 0.001 |
| chr3:38179780-38179930 | 1207 | 0.002 |
| chr3:38180040-38180190 | 183 | 0.002 |
| chr3:38073665-38073935 | 1010 | 0.002 |
| chr3:38179340-38179490 | 2203 | 0.002 |
| chr3:38066980-38067130 | 1508 | 0.002 |
| chr3:38208325-38208475 | 927 | 0.003 |
| chr3:38175200-38175350 | 1013 | 0.006 |
External Databases
UCSCEnsembl (ENSG00000060971)