Gene: TMEM40
chr3: 12775023-12801038Expression Profile
(log scale)
Graphical Connections
Distribution of linked clusters:
You may find it interesting if many of the connected DHS sites belong to the same cluster.| Cluster Profile | Cluster ID | Number of DHS sites in this cluster |
|---|---|---|
 | 1605 | 7 |
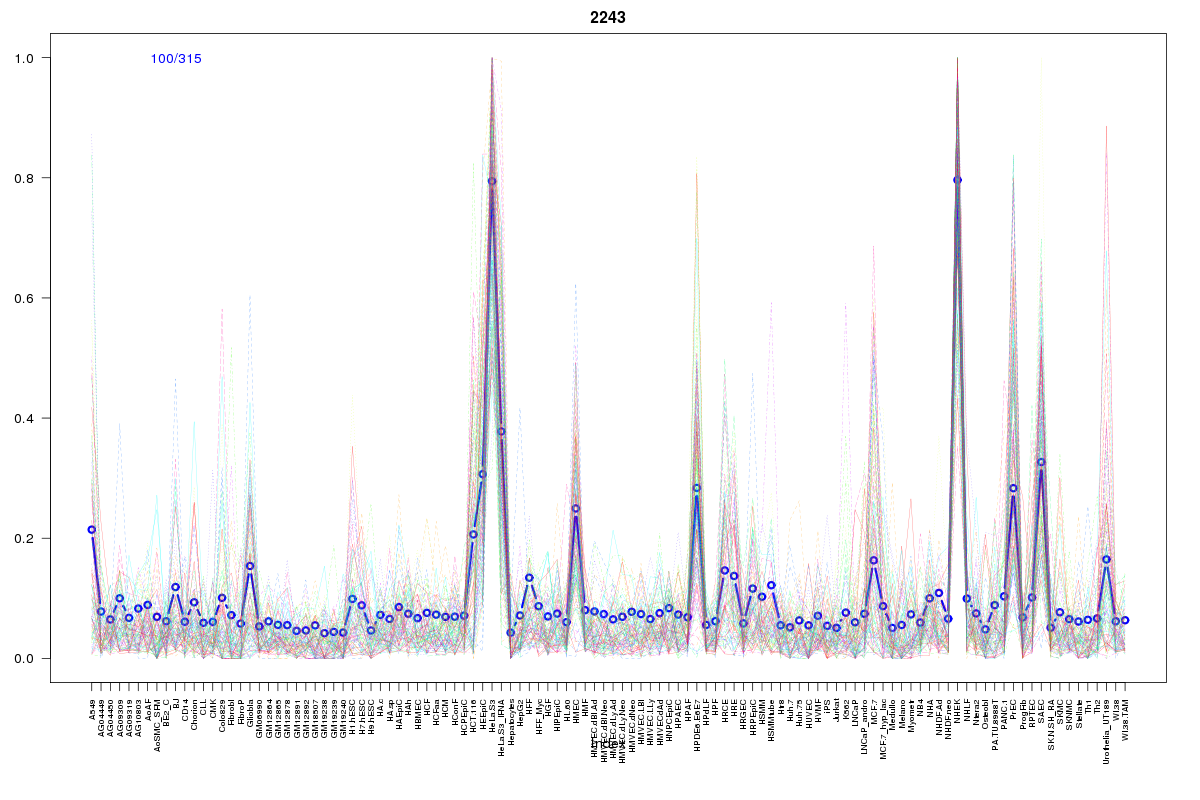 | 2243 | 2 |
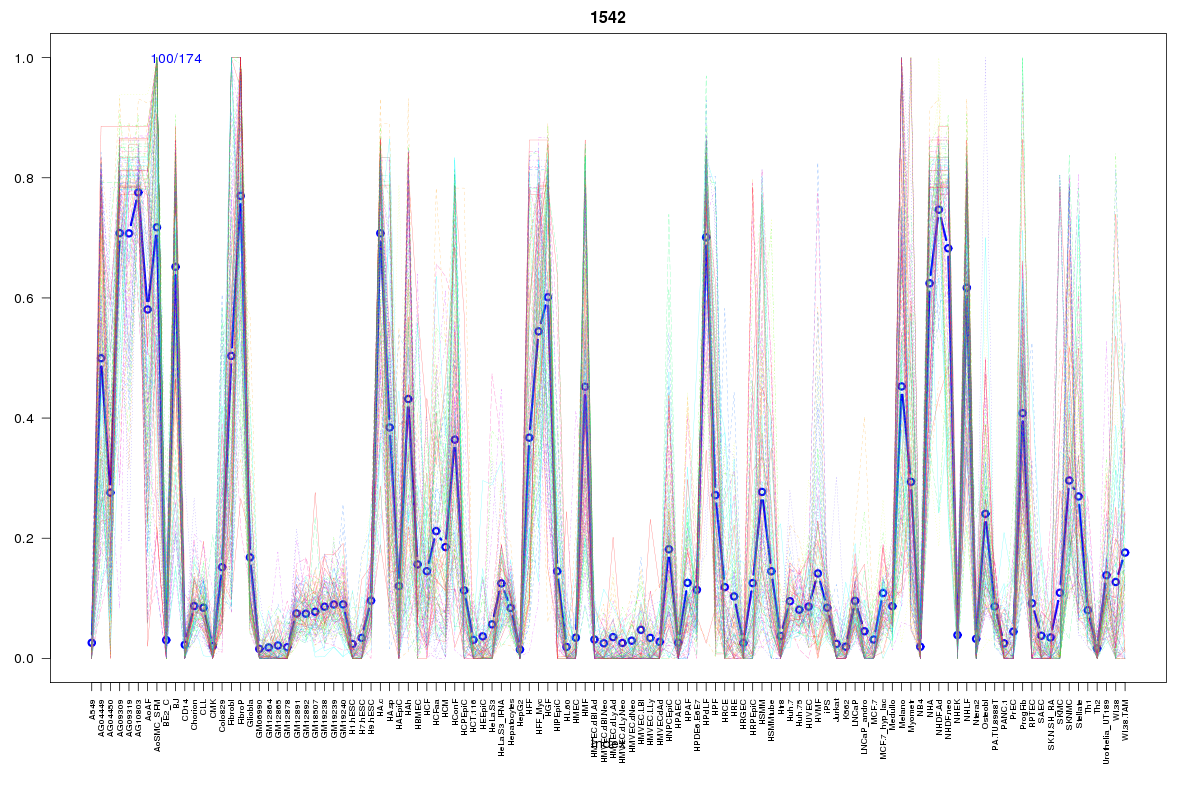 | 1542 | 2 |
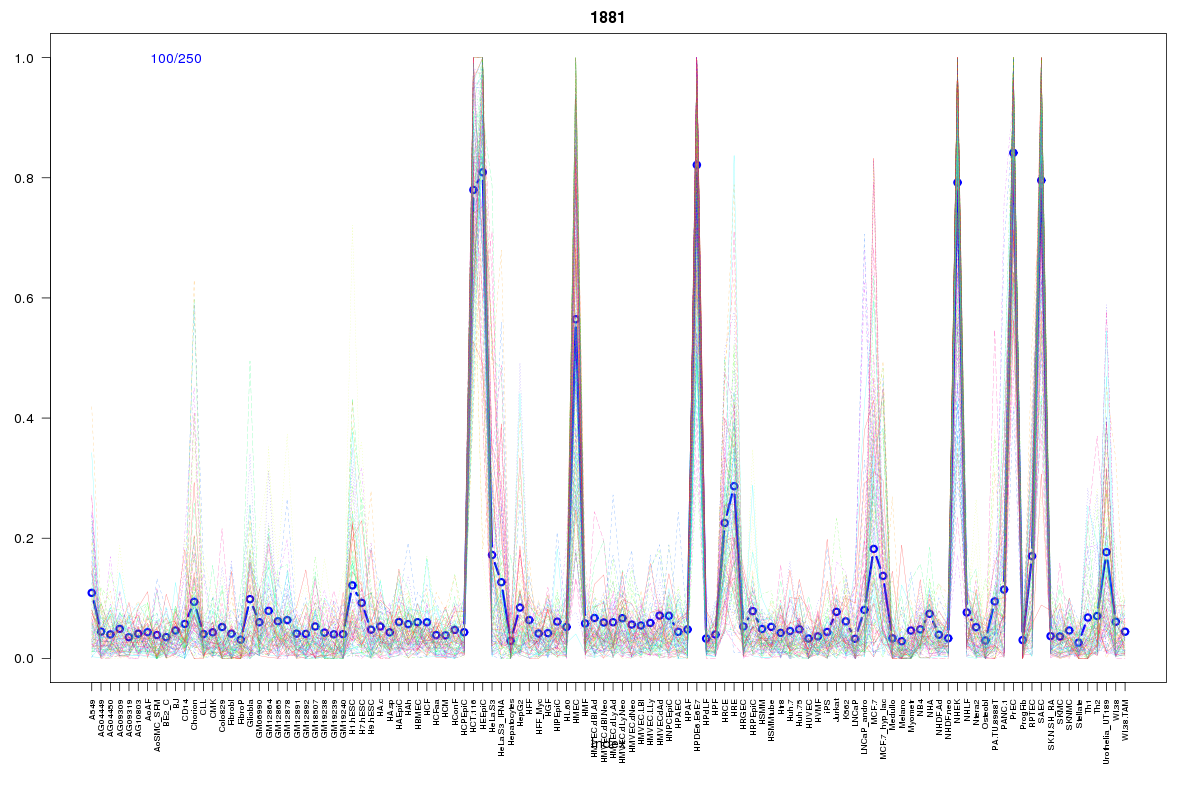 | 1881 | 2 |
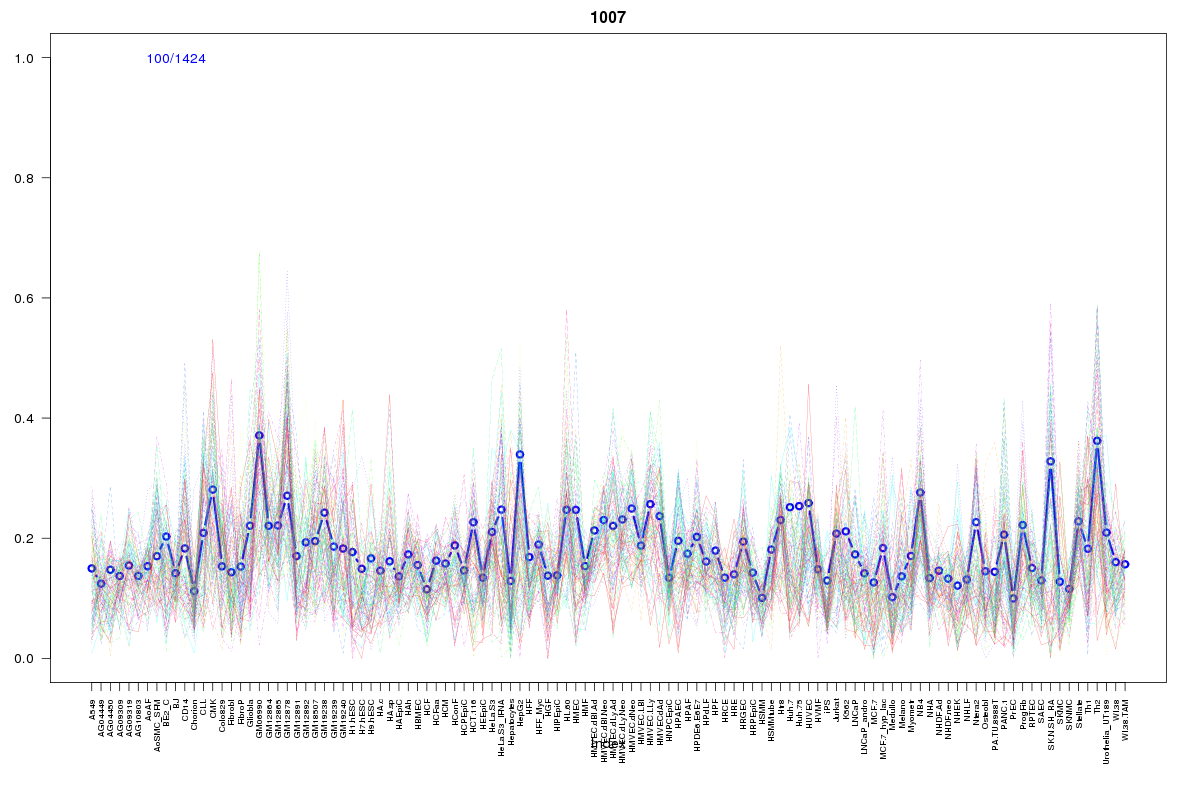 | 1007 | 1 |
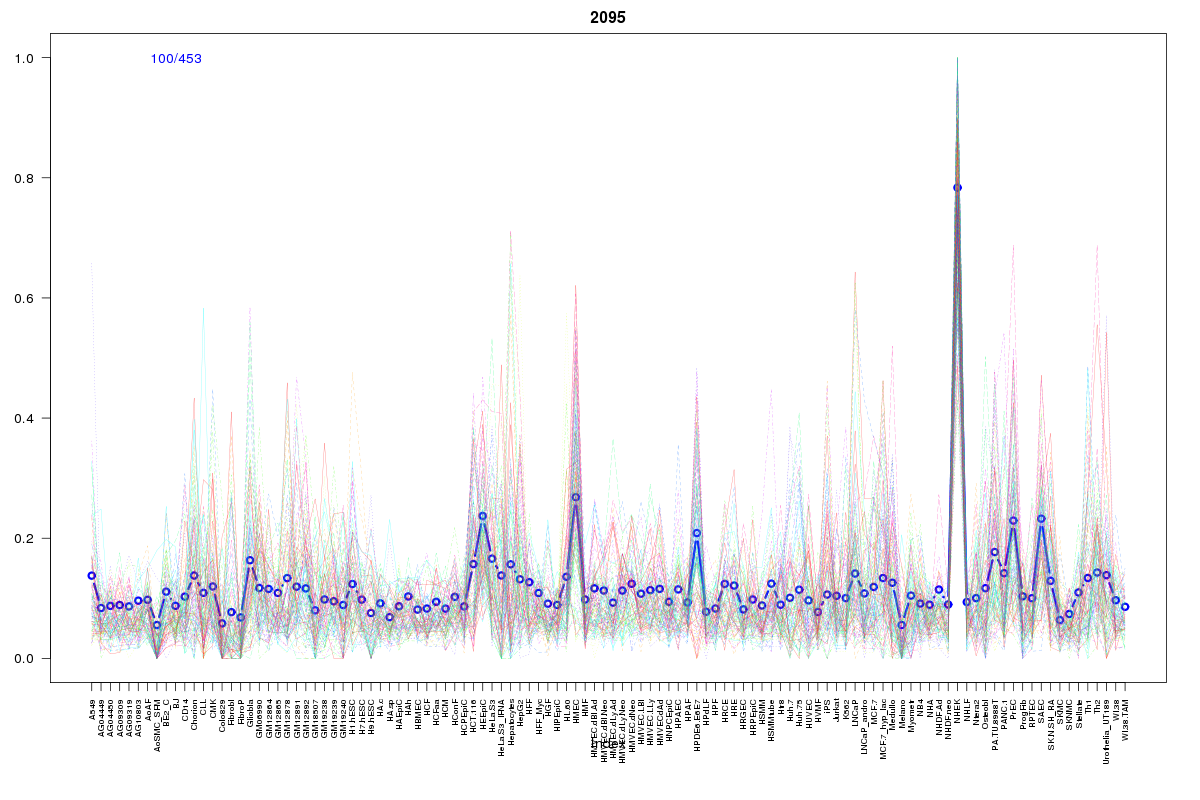 | 2095 | 1 |
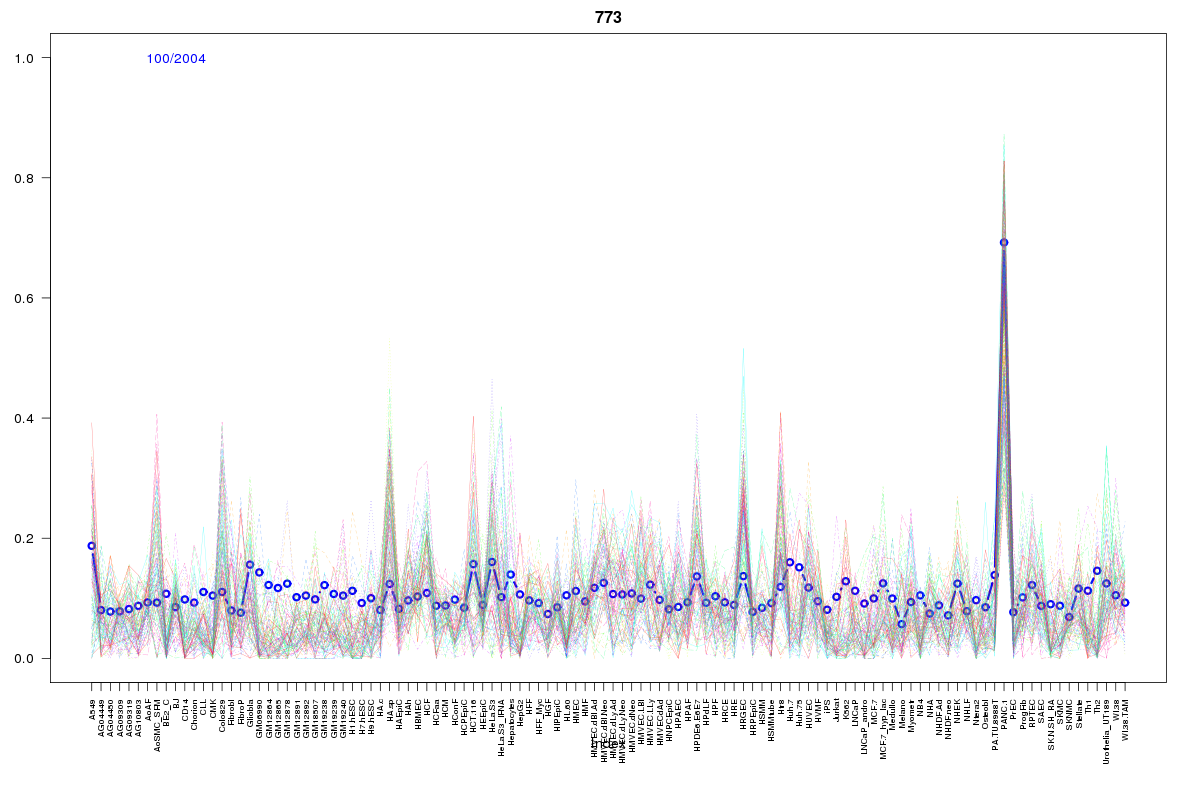 | 773 | 1 |
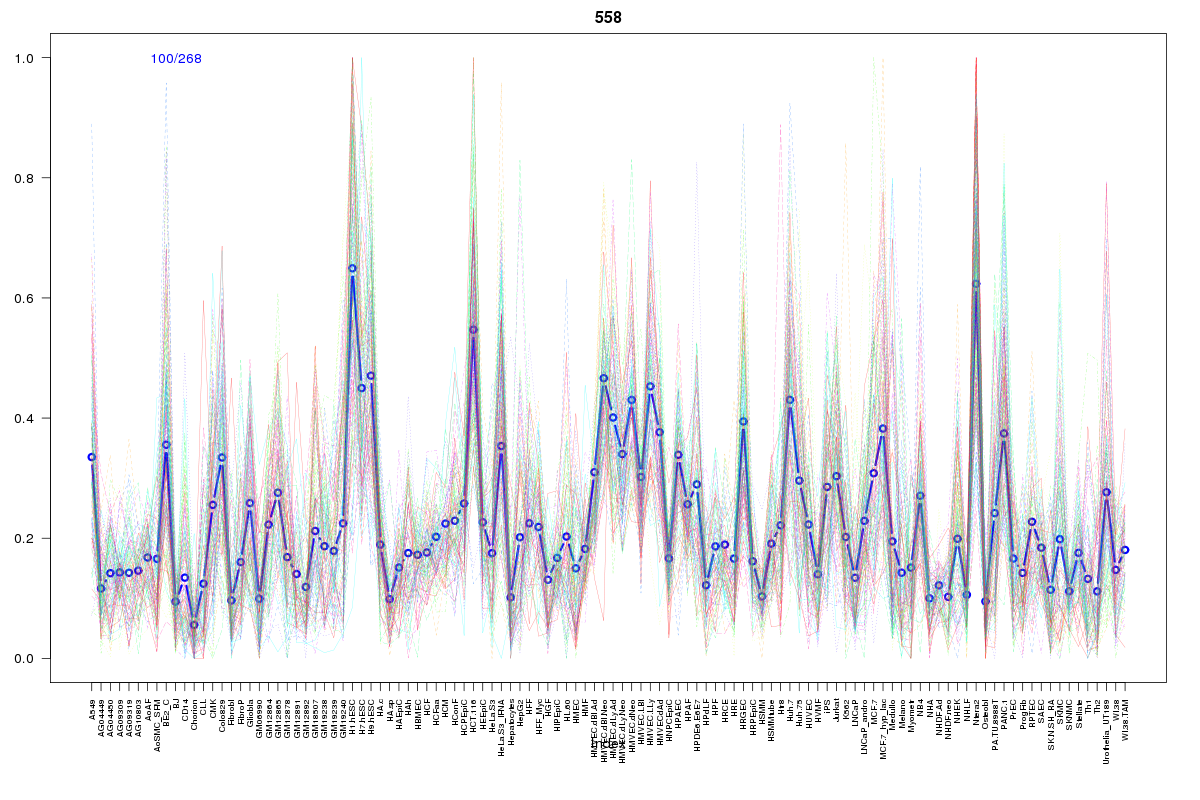 | 558 | 1 |
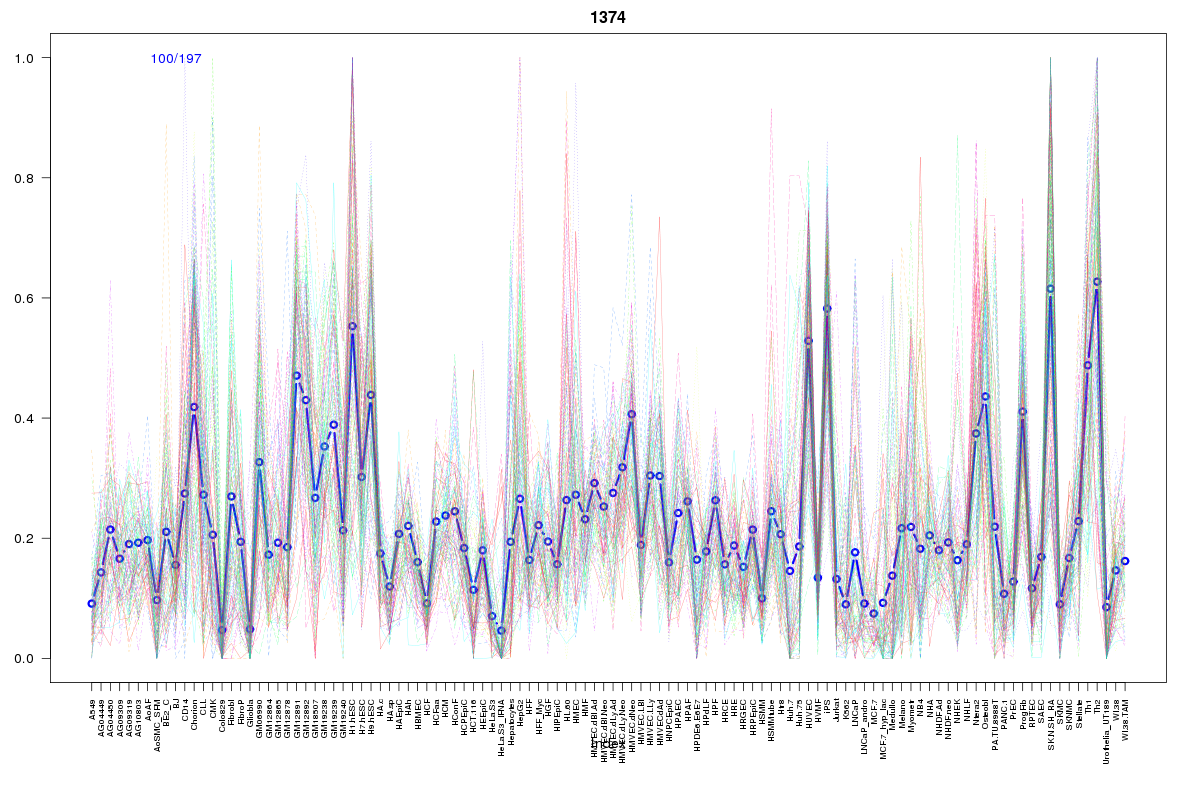 | 1374 | 1 |
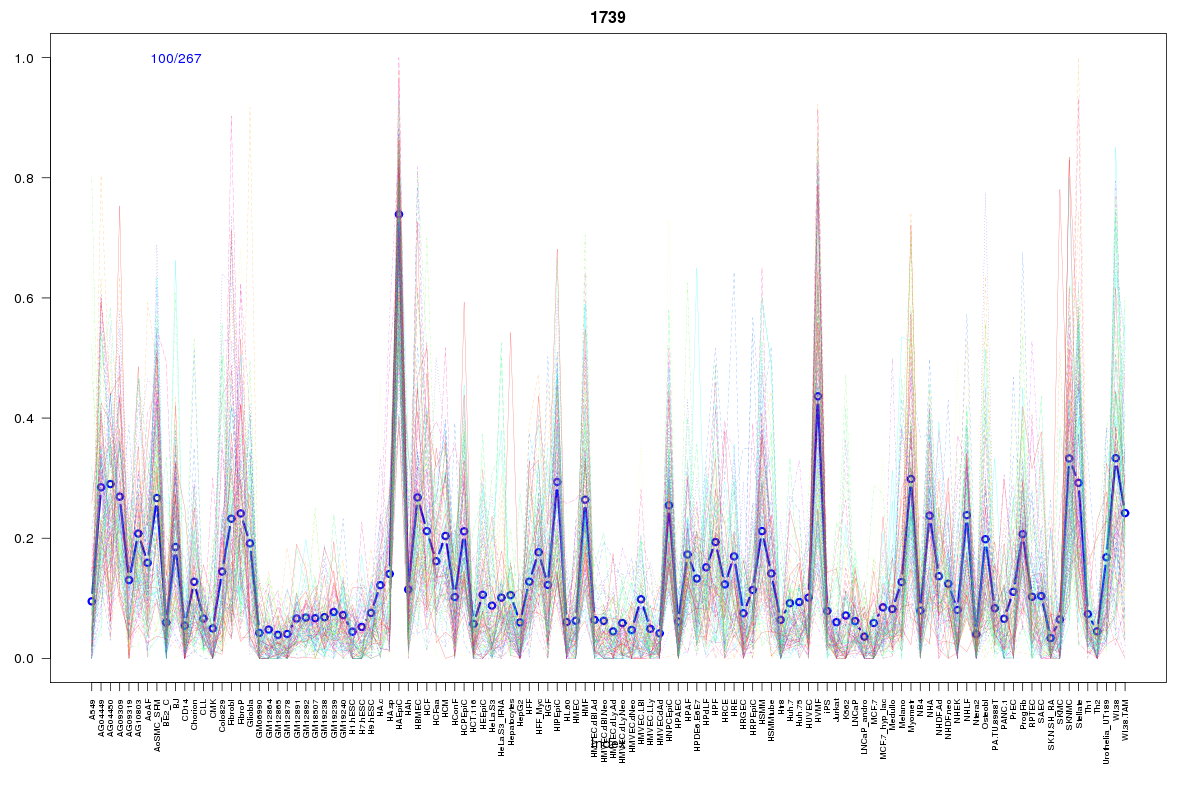 | 1739 | 1 |
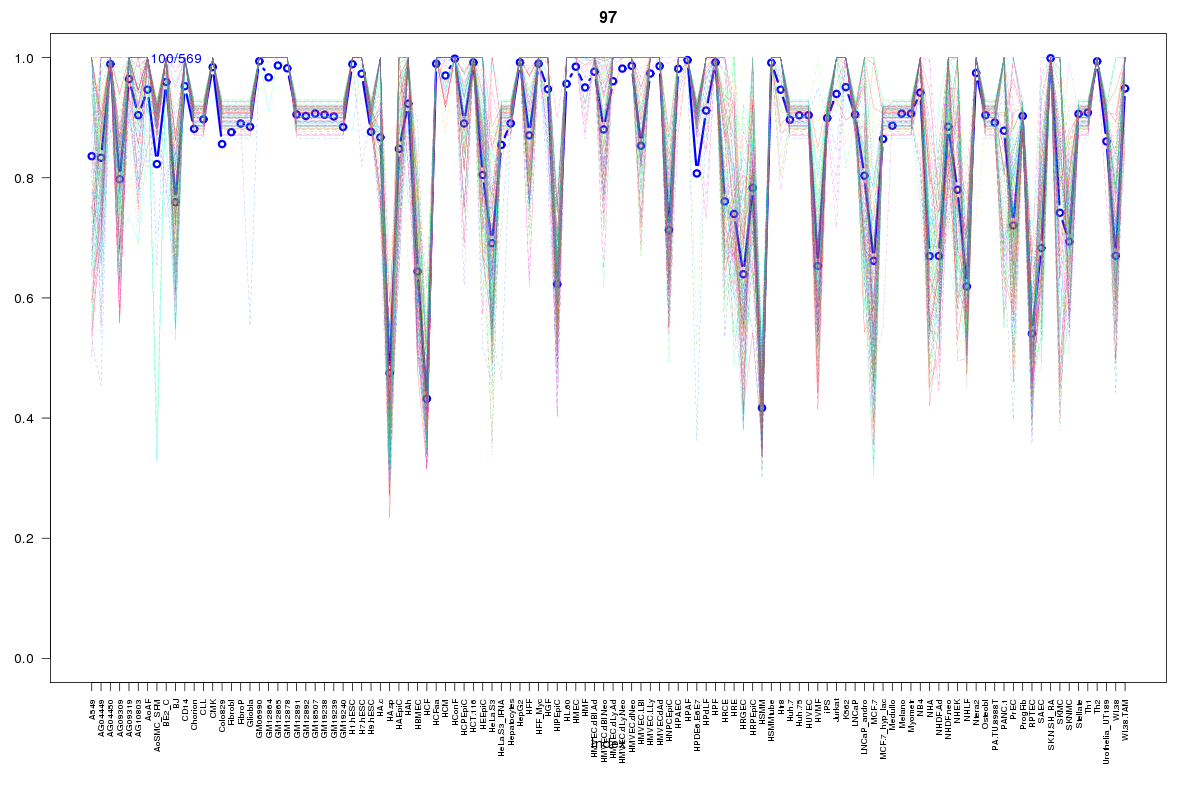 | 97 | 1 |
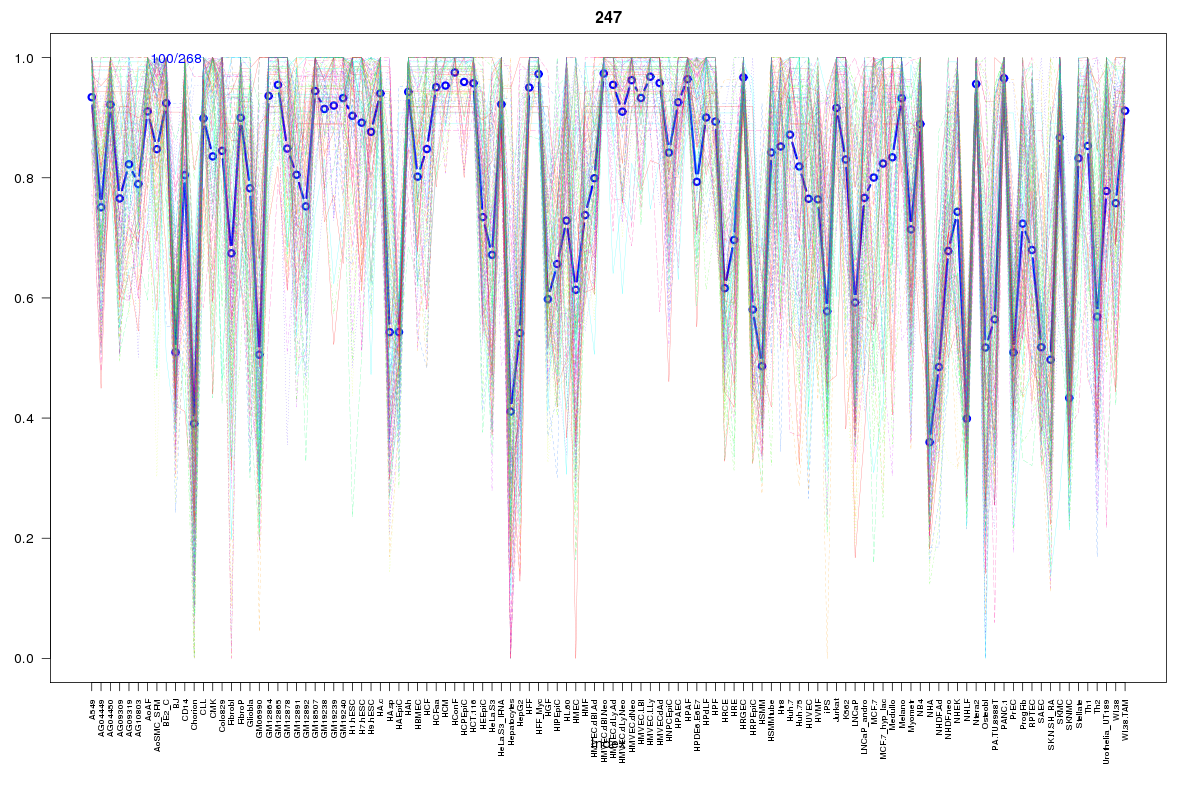 | 247 | 1 |
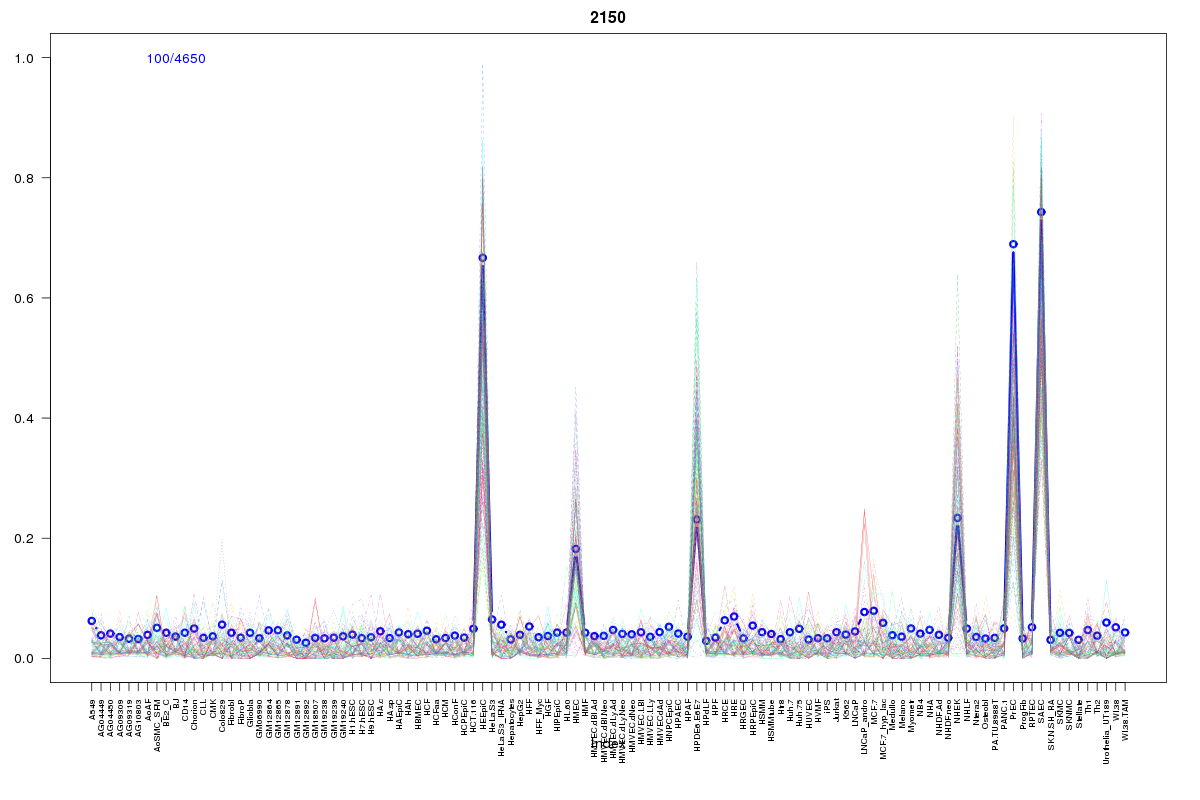 | 2150 | 1 |
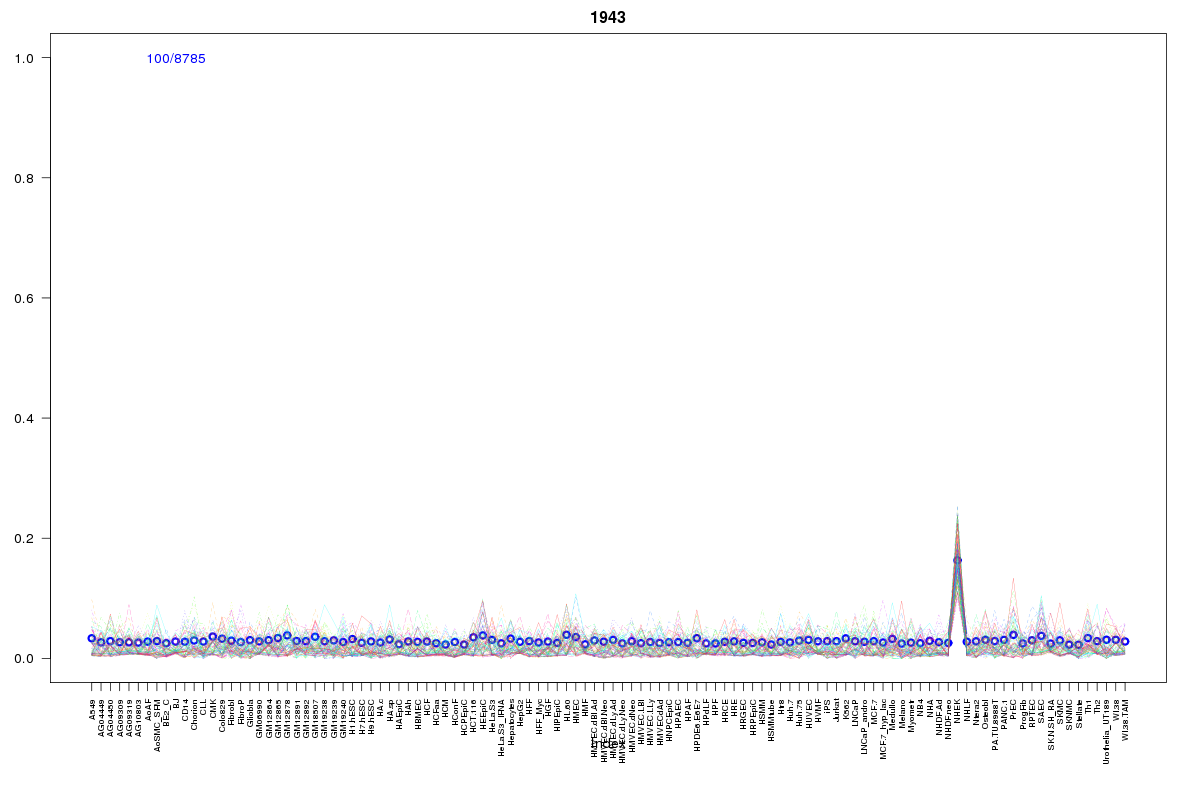 | 1943 | 1 |
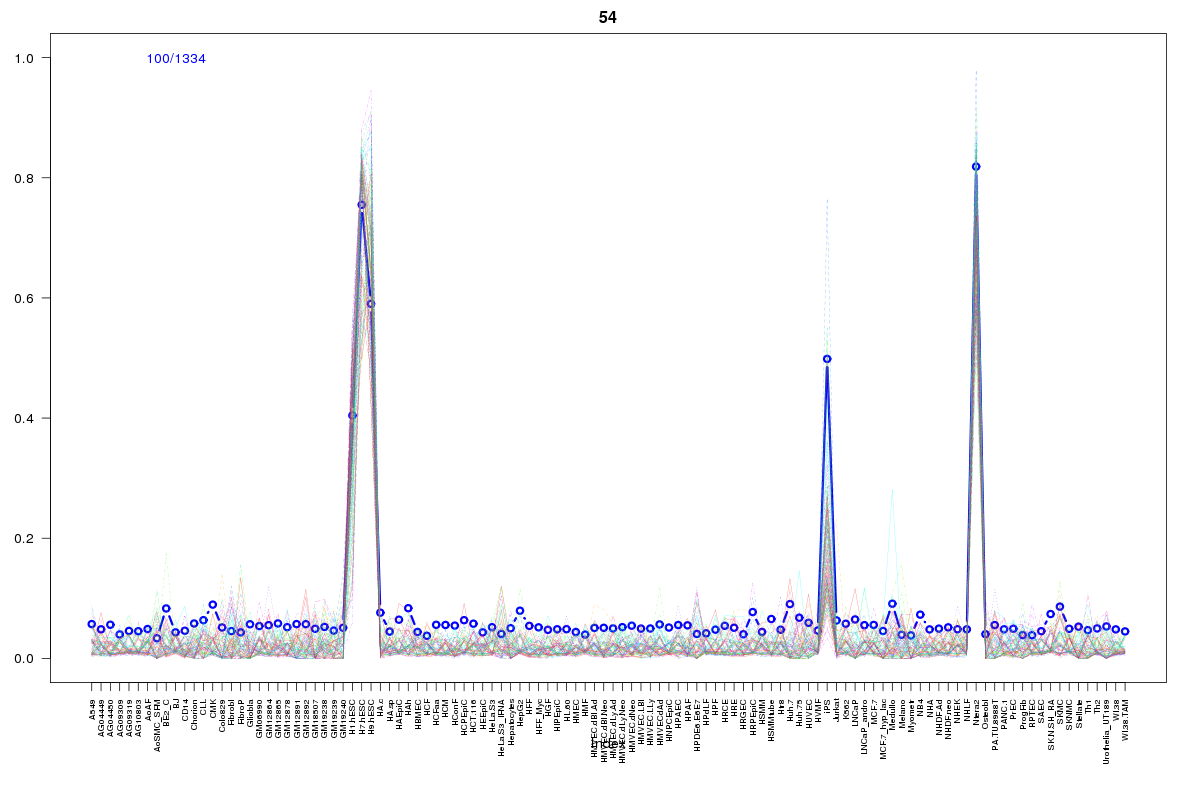 | 54 | 1 |
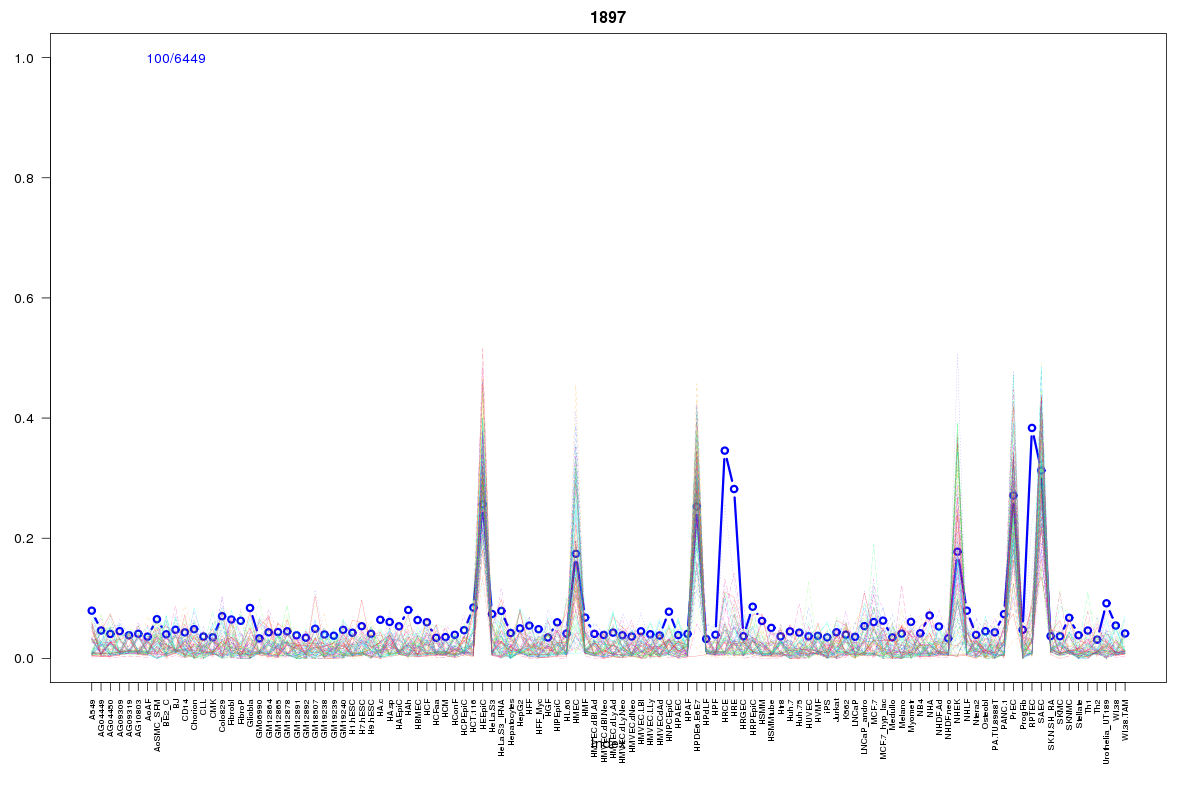 | 1897 | 1 |
 | 248 | 1 |
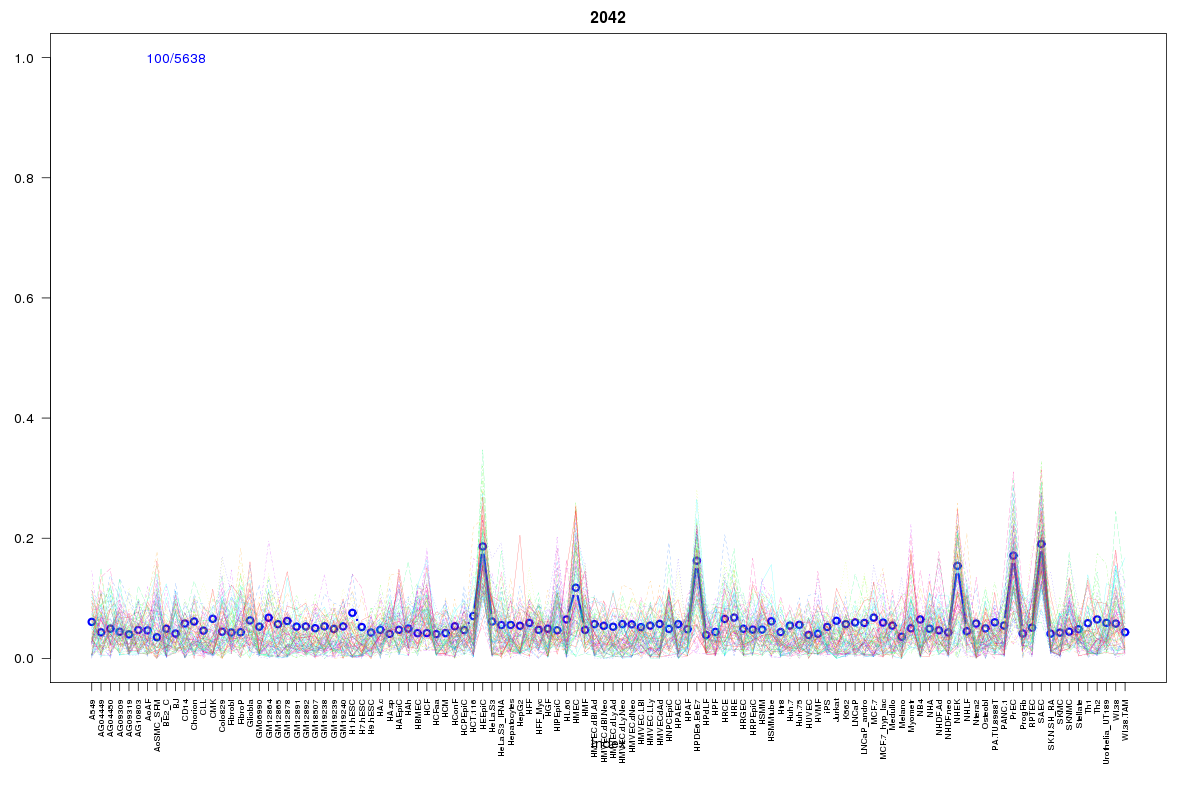 | 2042 | 1 |
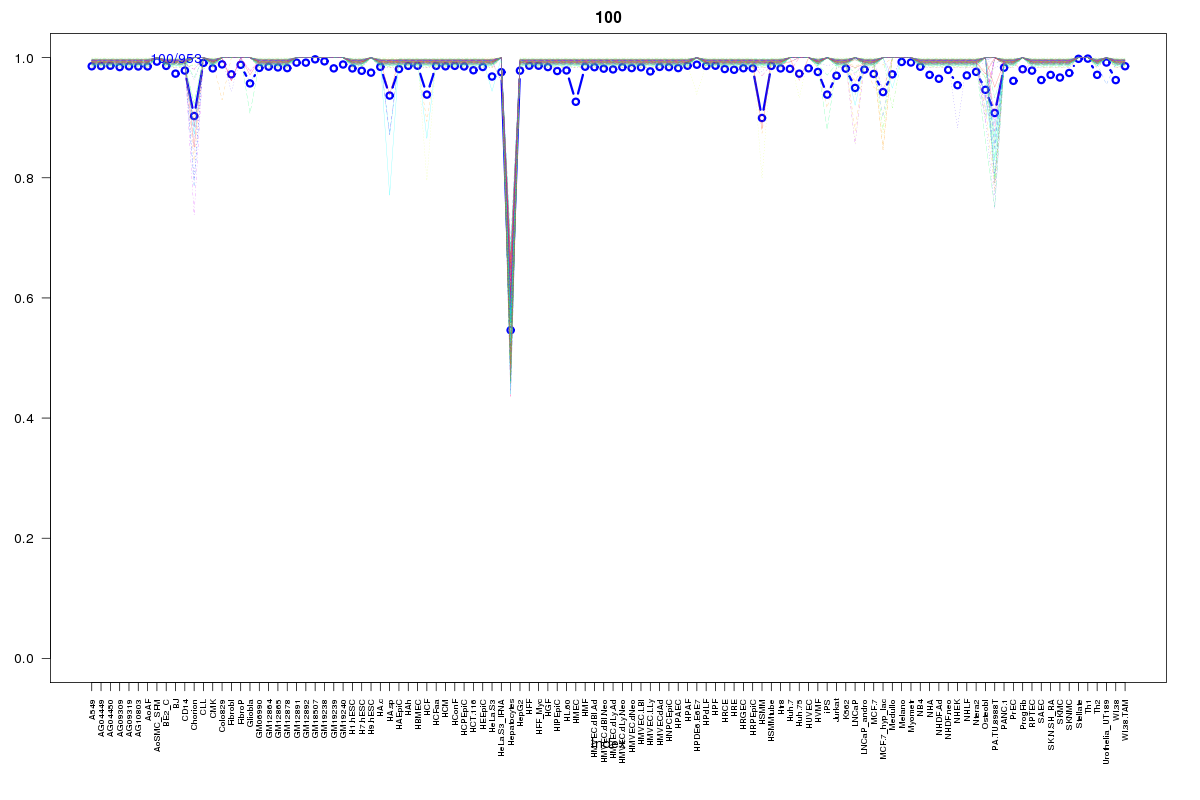 | 100 | 1 |
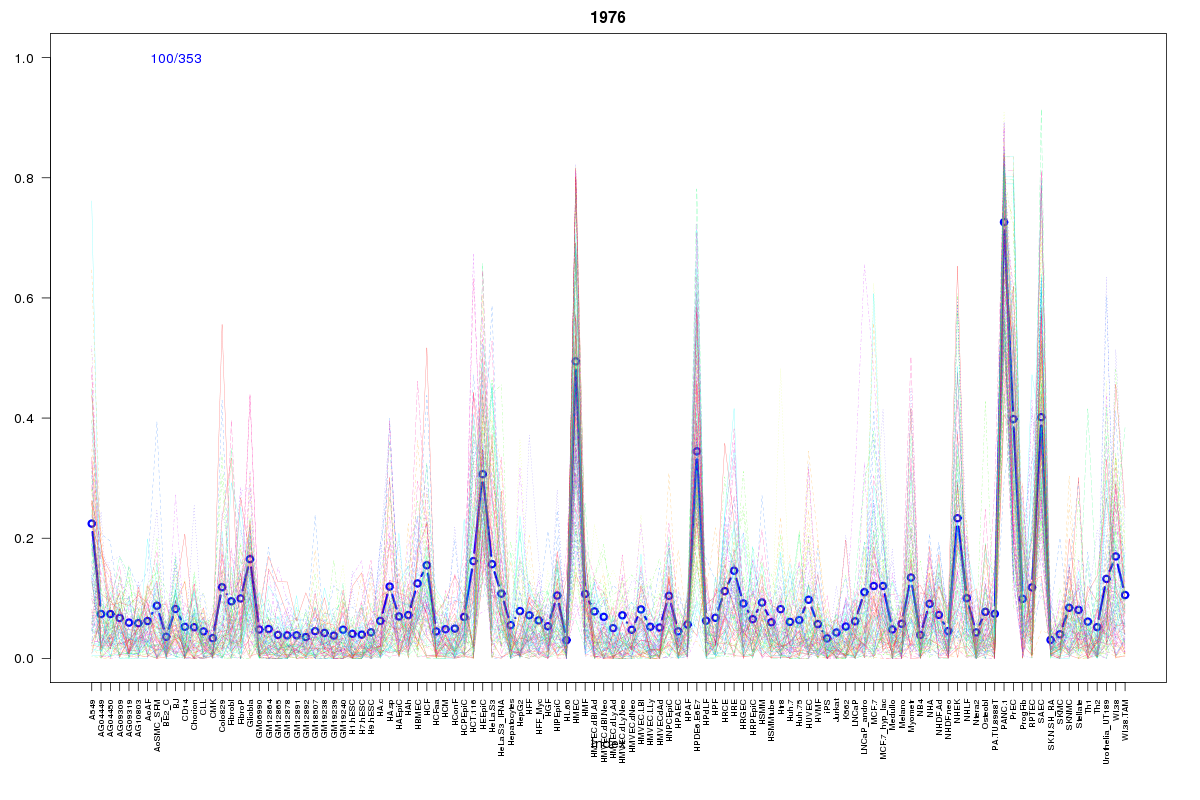 | 1976 | 1 |
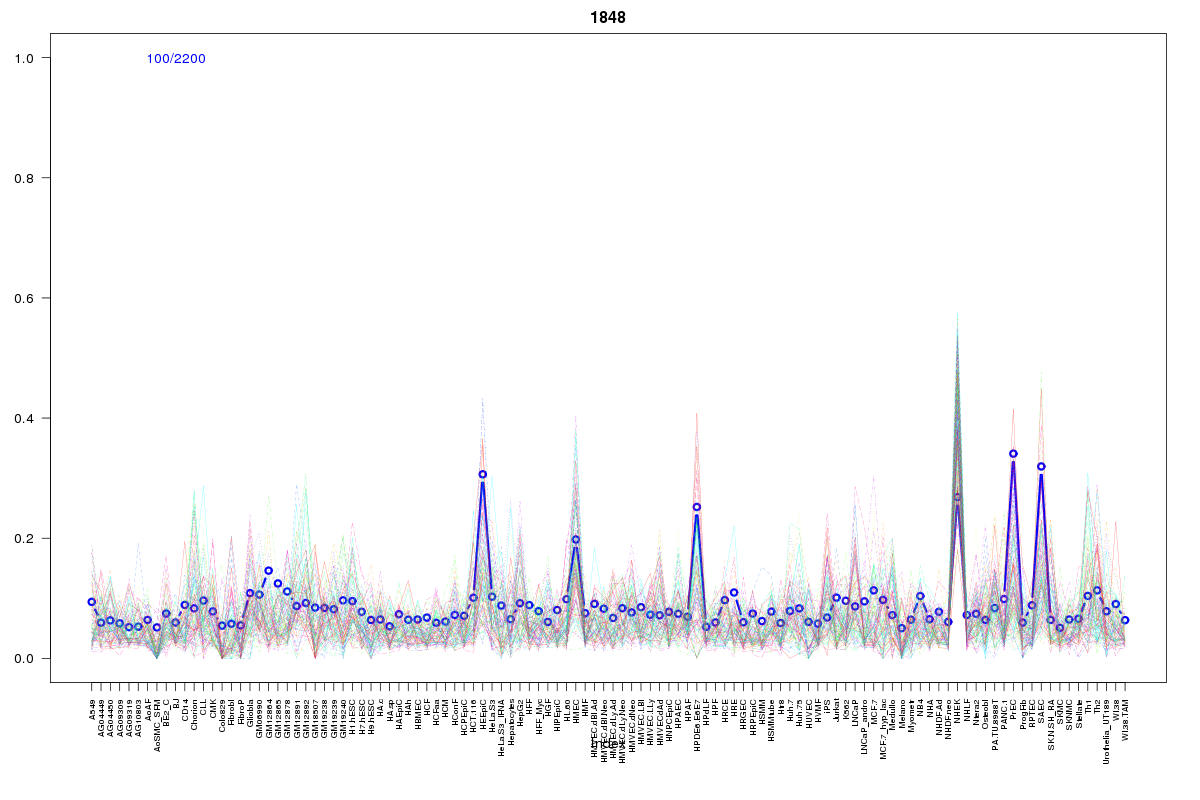 | 1848 | 1 |
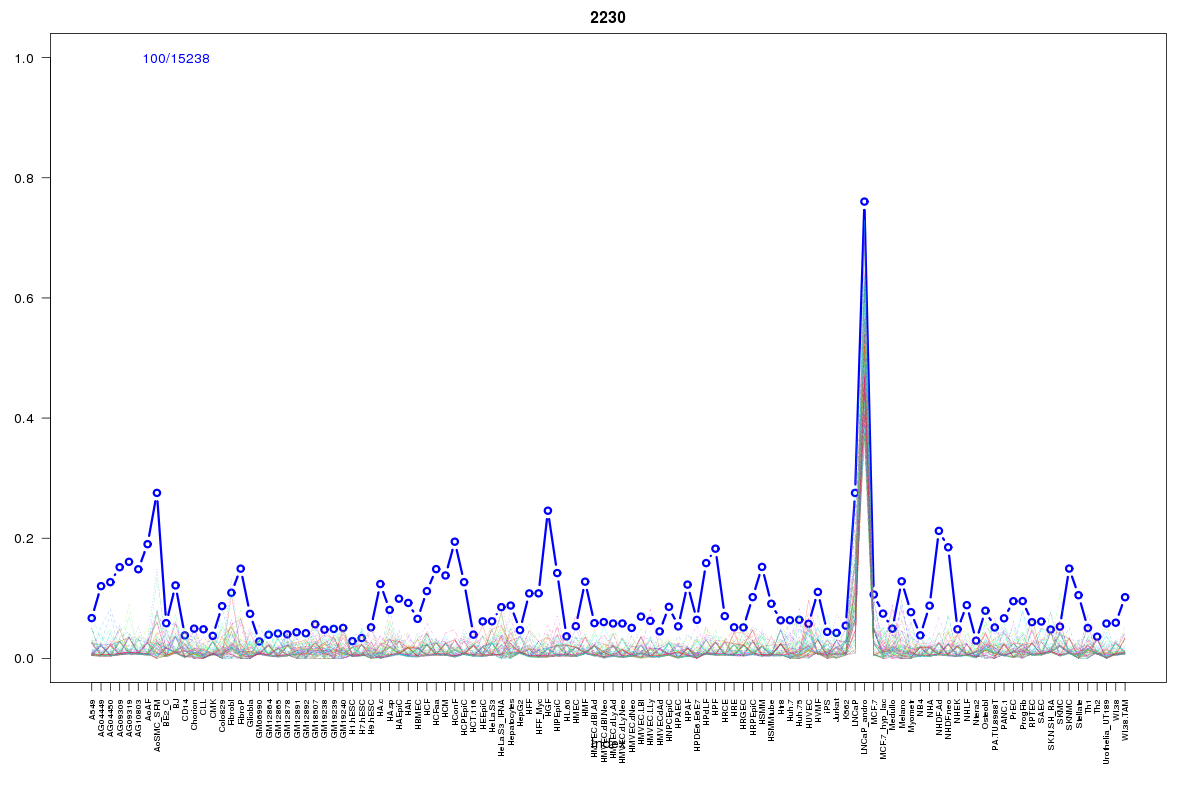 | 2230 | 1 |
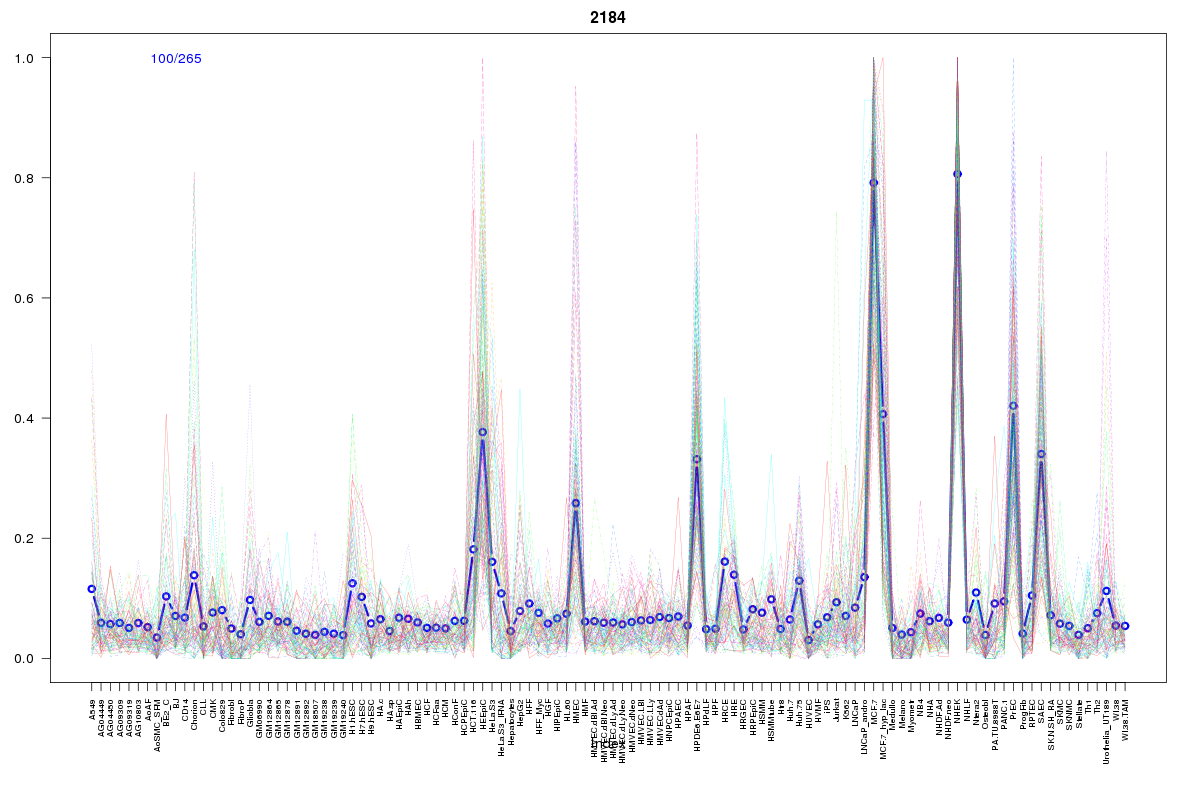 | 2184 | 1 |
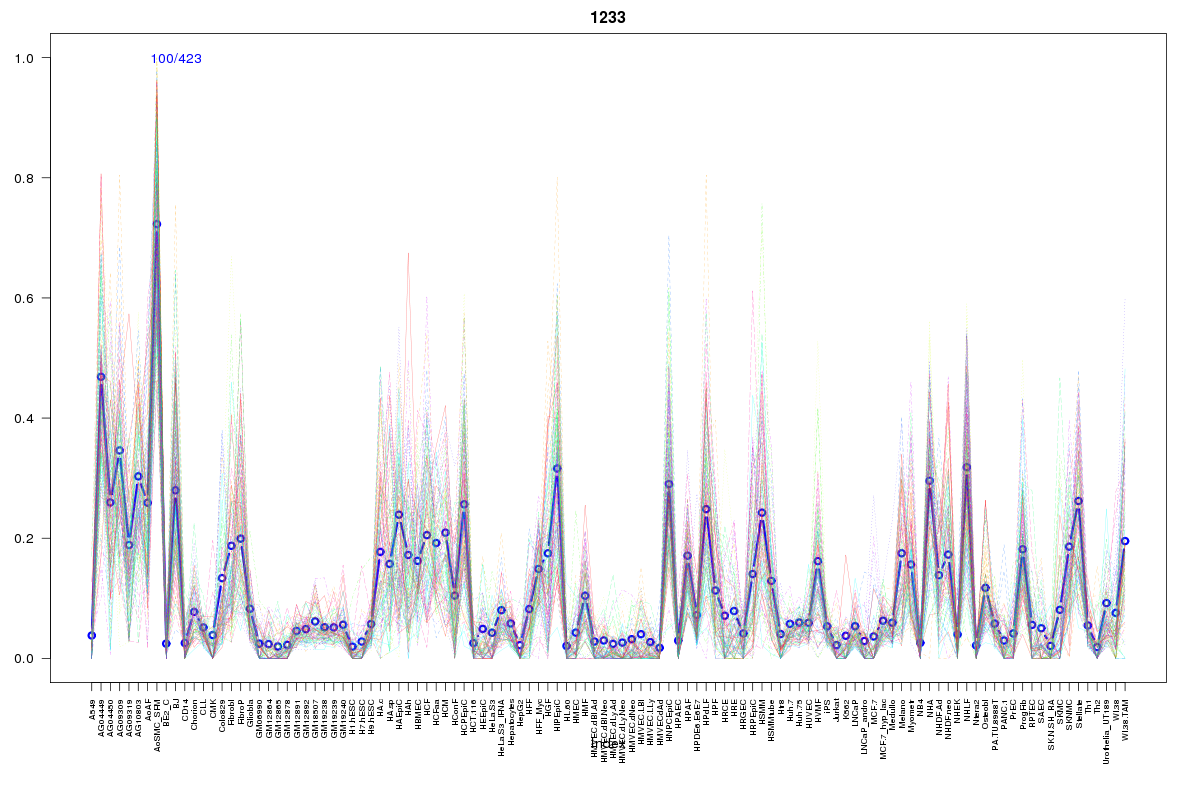 | 1233 | 1 |
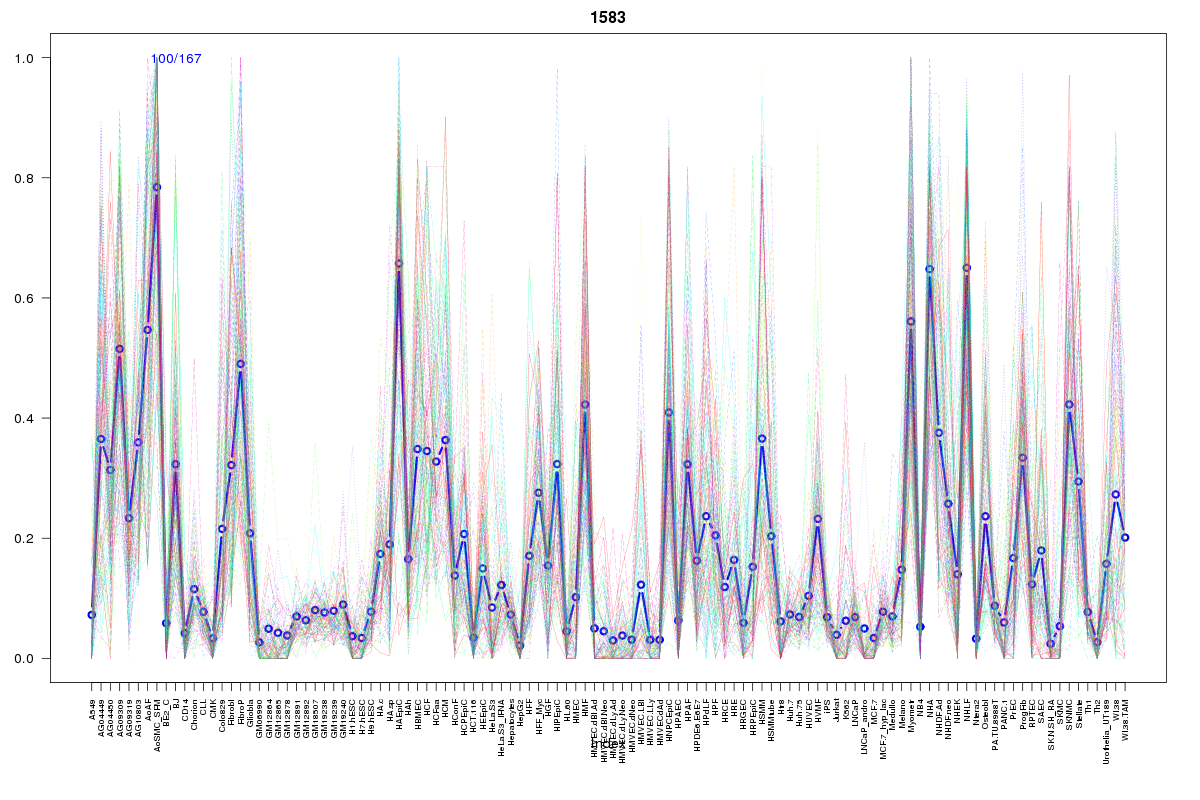 | 1583 | 1 |
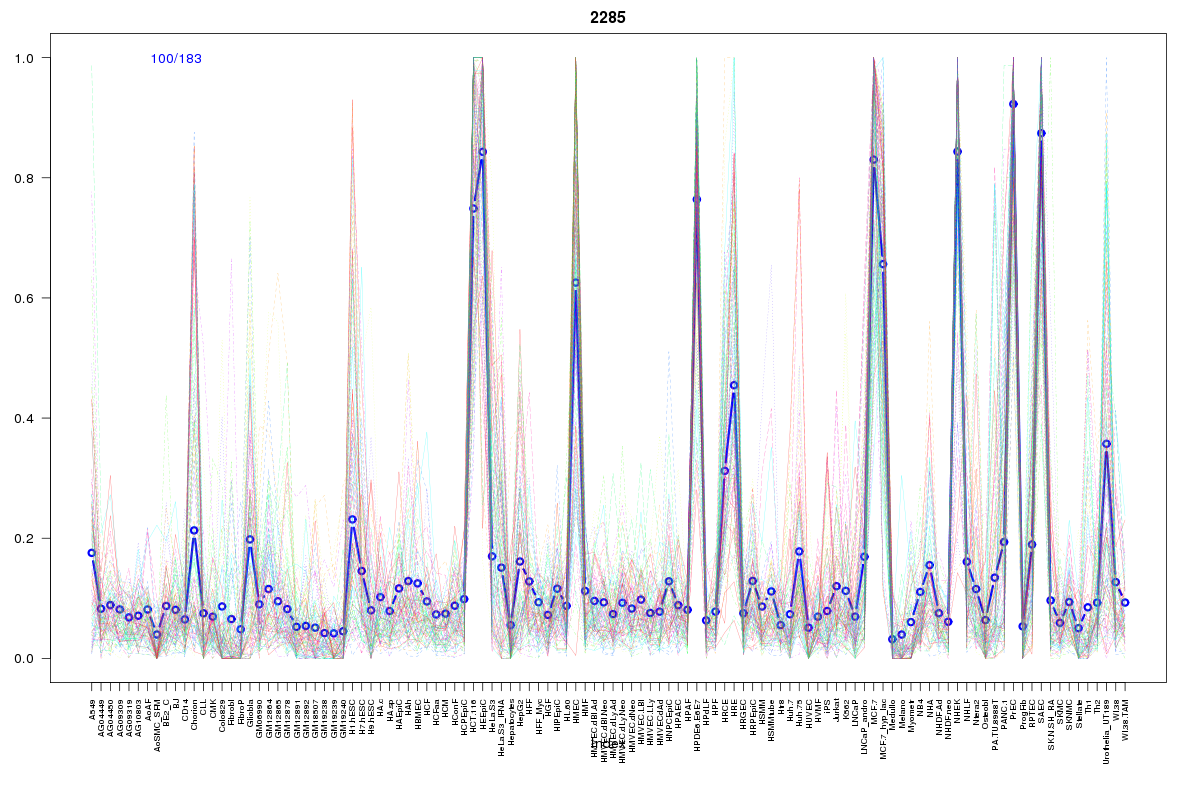 | 2285 | 1 |
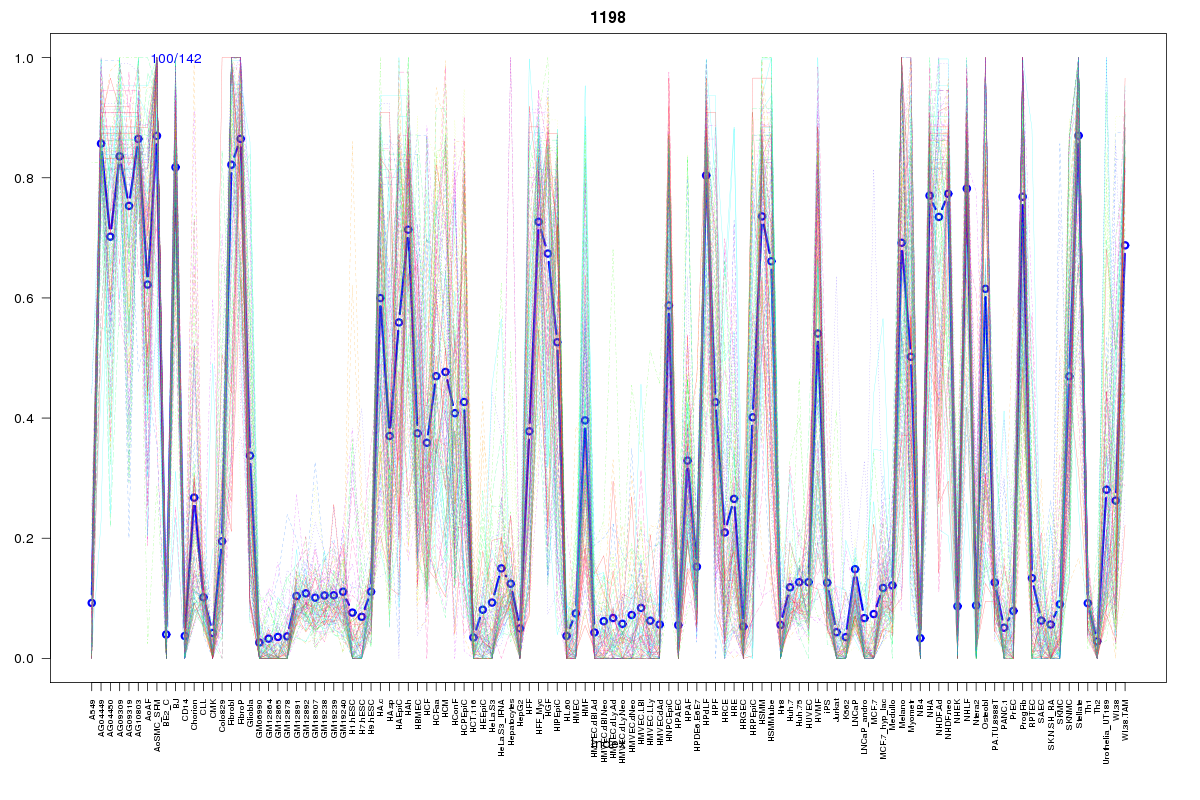 | 1198 | 1 |
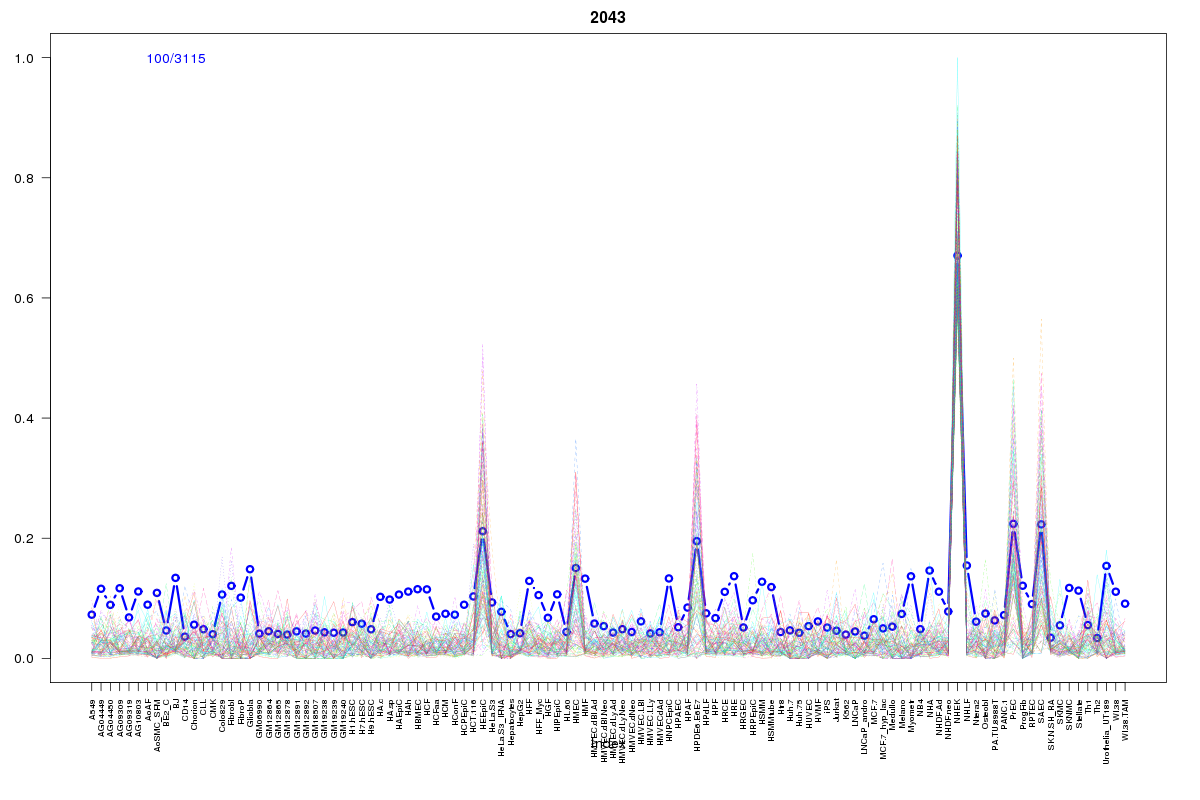 | 2043 | 1 |
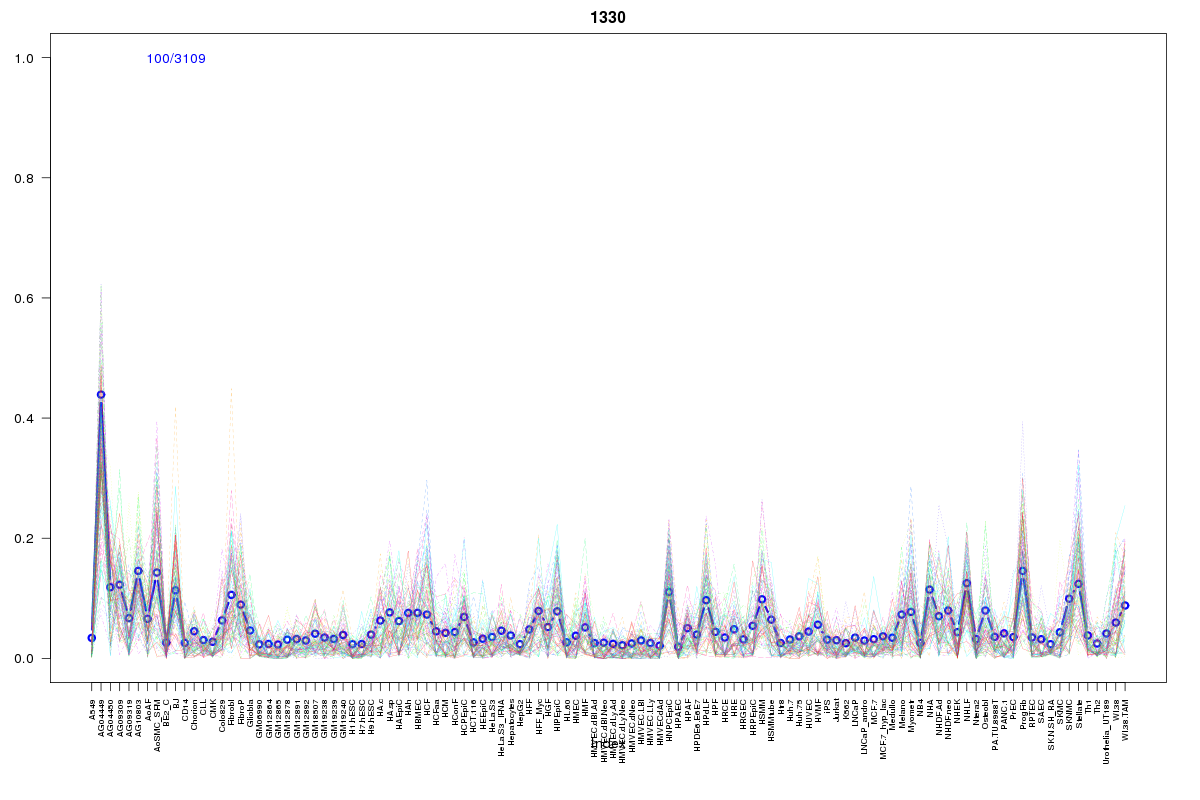 | 1330 | 1 |
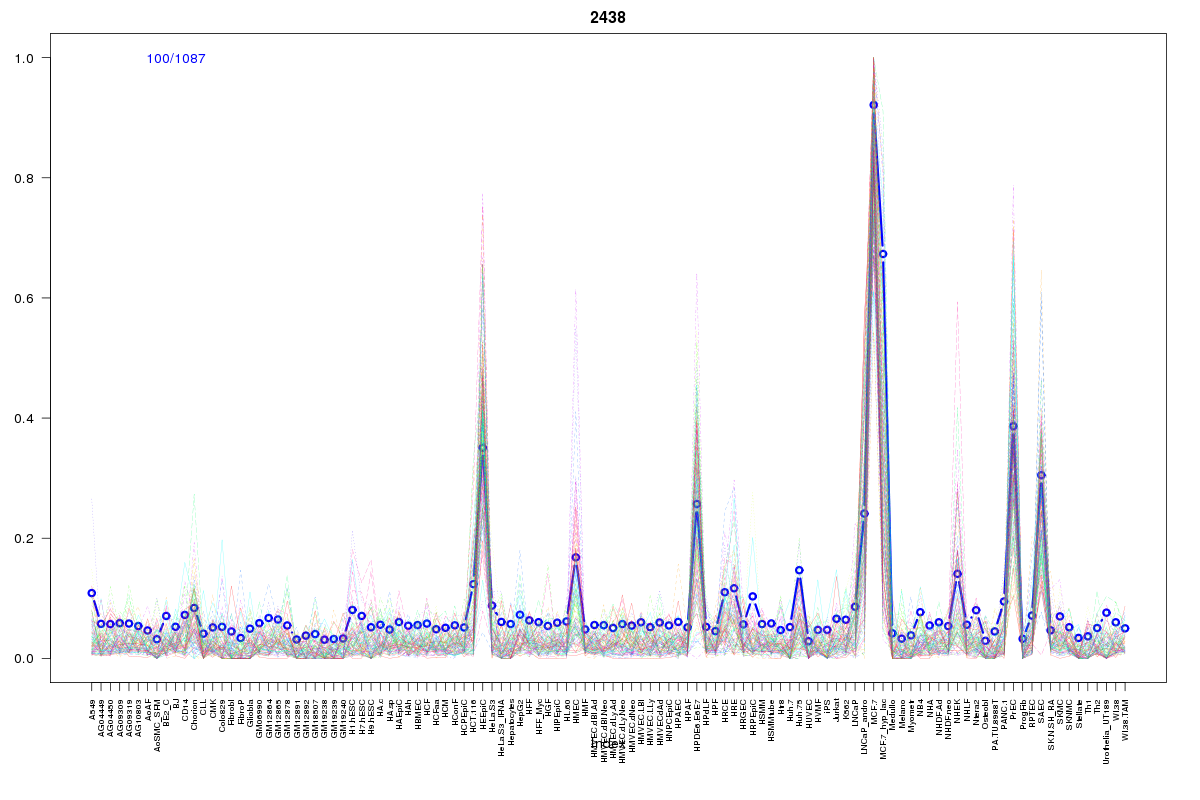 | 2438 | 1 |
Resources
BED file downloads
Connects to 39 DHS sitesTop 10 Correlated DHS Sites
p-values indiciate significant higher or lower correlation| Location | Cluster | P-value |
|---|---|---|
| chr3:12801025-12801175 | 1881 | 0.001 |
| chr3:12800685-12800835 | 1881 | 0.001 |
| chr3:12800840-12800990 | 2285 | 0.003 |
| chr3:12870820-12870970 | 1605 | 0.008 |
| chr3:12898440-12898590 | 1605 | 0.009 |
| chr3:12804705-12804855 | 2095 | 0.01 |
| chr3:12870380-12870530 | 2150 | 0.01 |
| chr3:12757220-12757370 | 1605 | 0.01 |
| chr3:12795220-12795370 | 2184 | 0.01 |
| chr3:12793160-12793310 | 1976 | 0.01 |
| chr3:12801245-12801395 | 2043 | 0.011 |
External Databases
UCSCEnsembl (ENSG00000088726)