Gene: BTAF1
chr10: 93683525-93790082Expression Profile
(log scale)
Graphical Connections
Distribution of linked clusters:
You may find it interesting if many of the connected DHS sites belong to the same cluster.| Cluster Profile | Cluster ID | Number of DHS sites in this cluster |
|---|---|---|
 | 2110 | 2 |
 | 935 | 1 |
 | 2062 | 1 |
 | 2063 | 1 |
 | 979 | 1 |
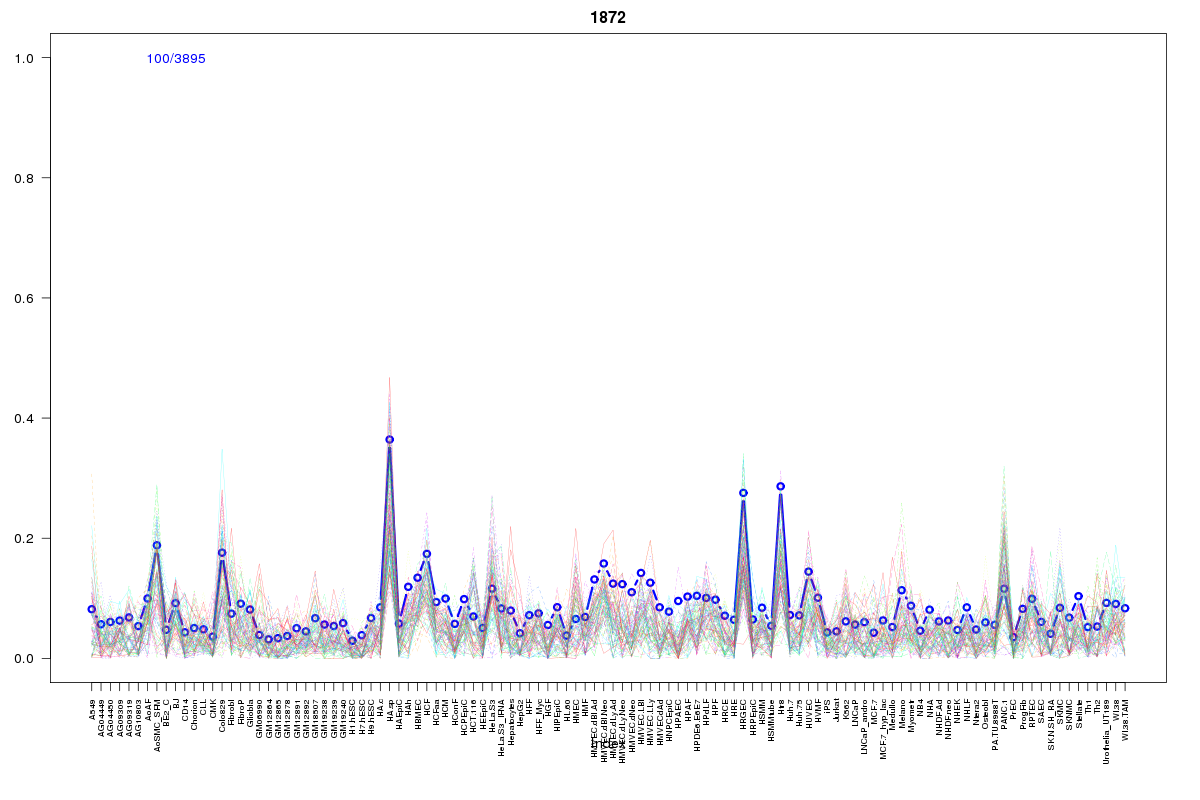 | 1872 | 1 |
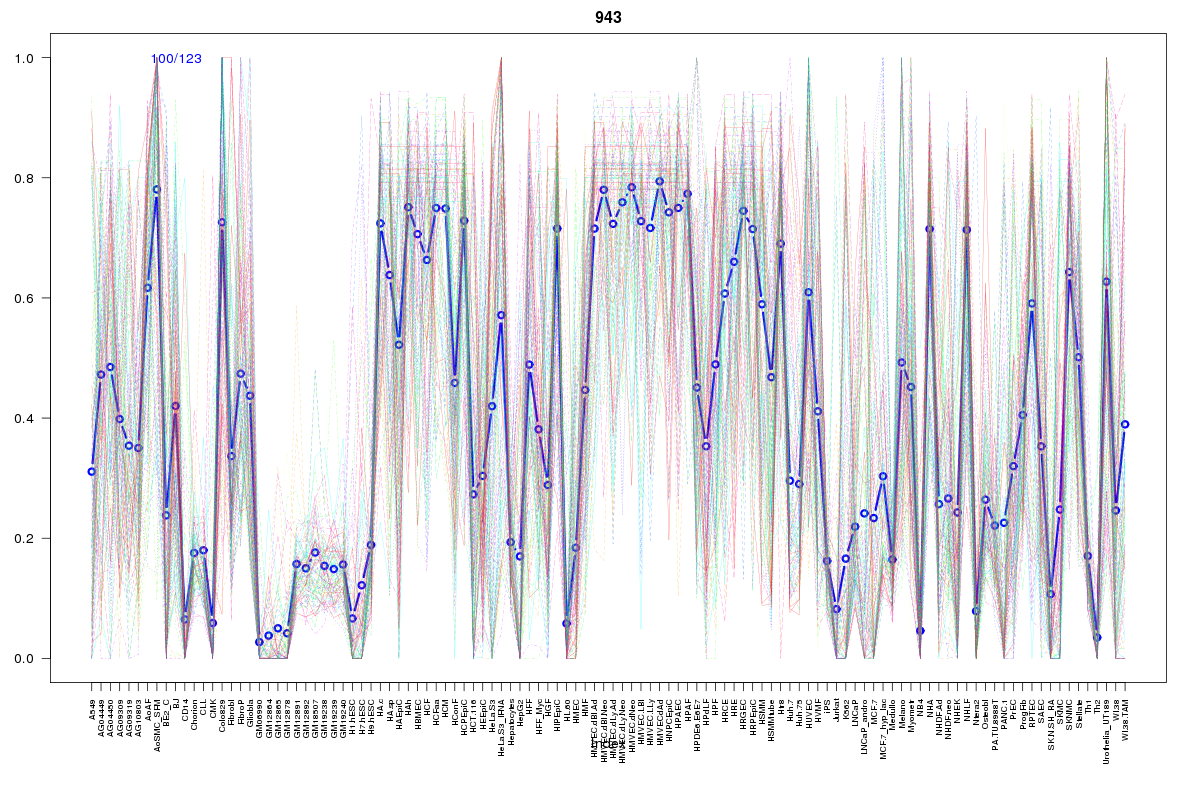 | 943 | 1 |
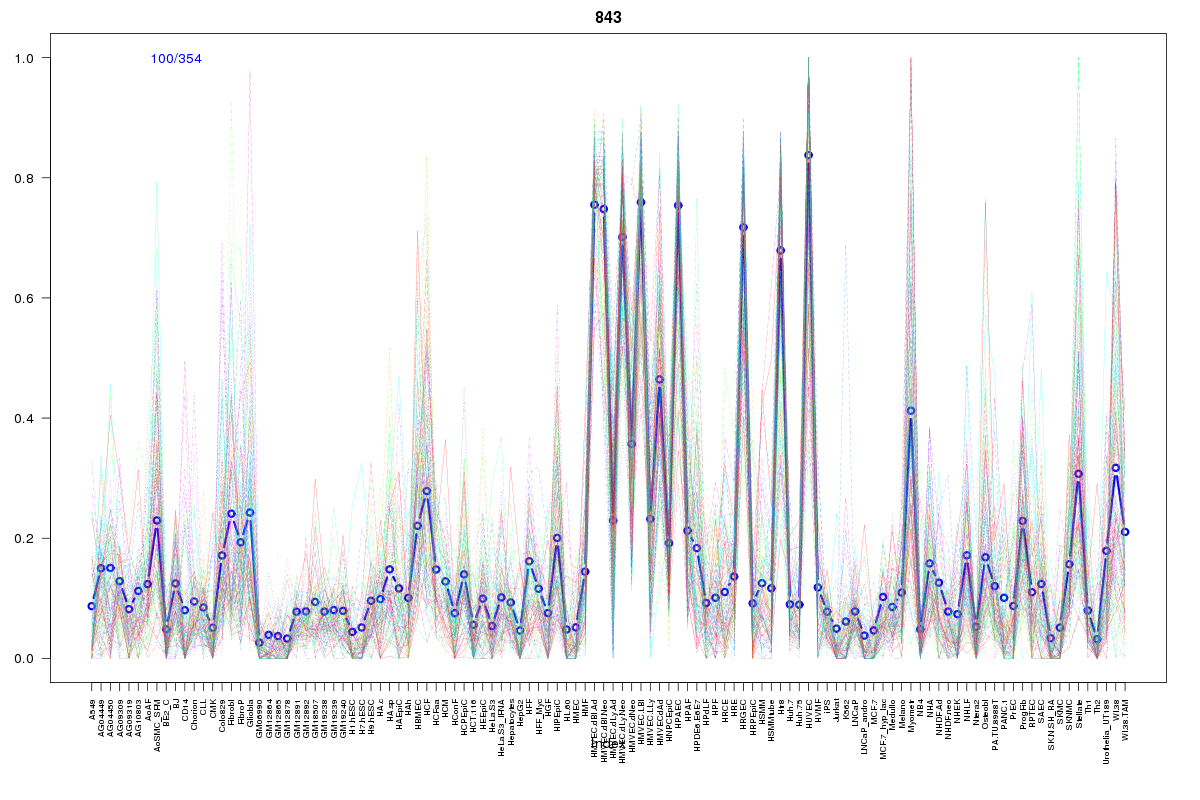 | 843 | 1 |
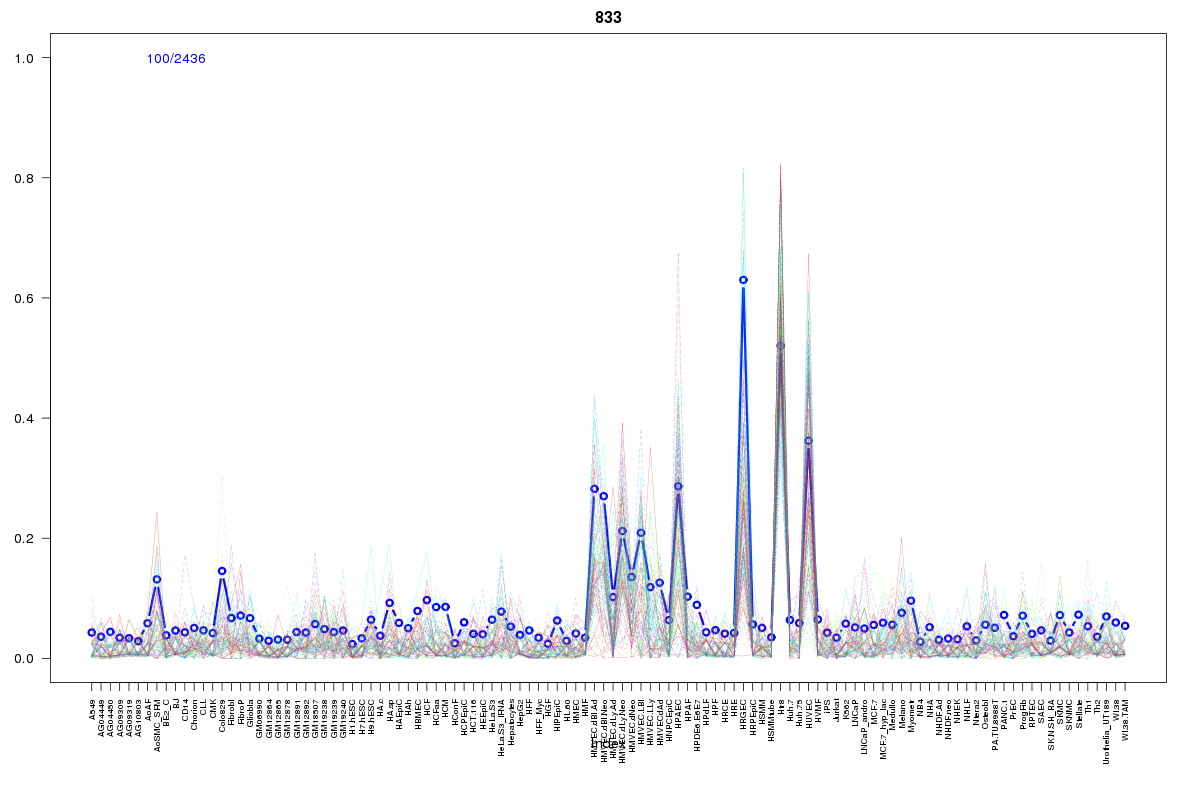 | 833 | 1 |
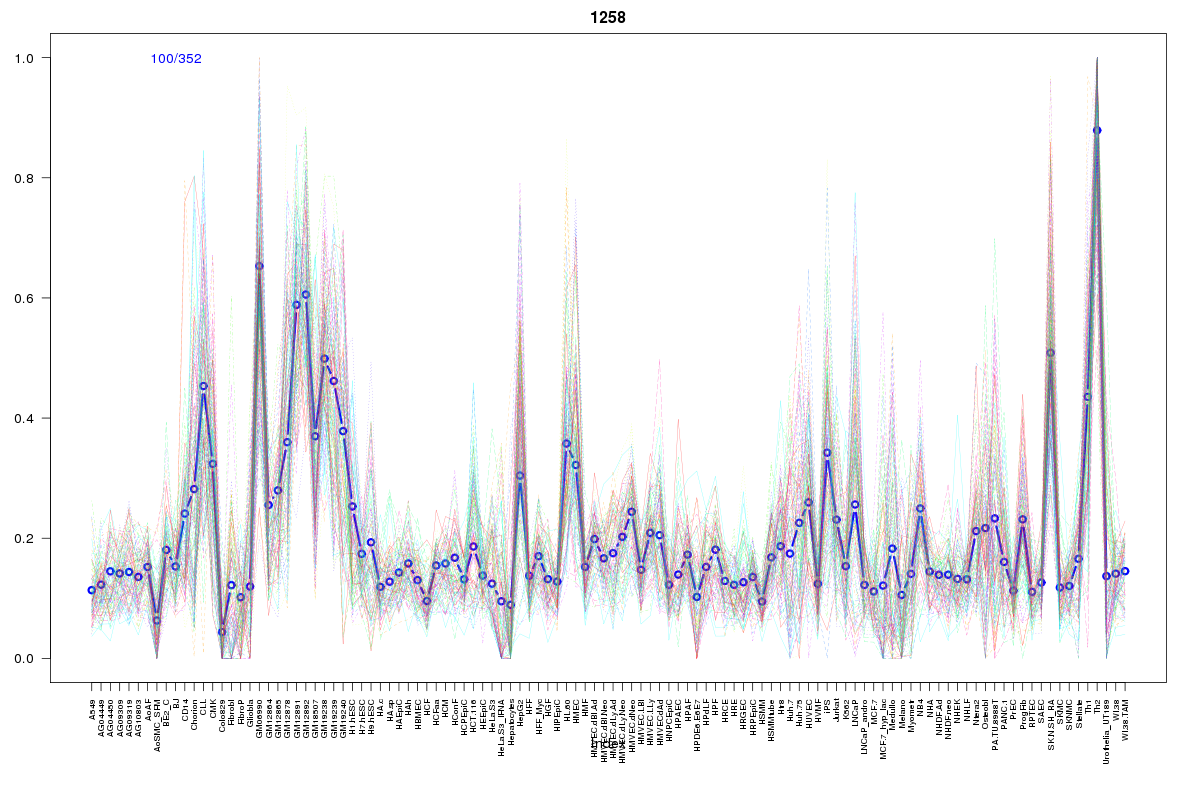 | 1258 | 1 |
 | 445 | 1 |
 | 15 | 1 |
Resources
BED file downloads
Connects to 13 DHS sitesTop 10 Correlated DHS Sites
p-values indiciate significant higher or lower correlation| Location | Cluster | P-value |
|---|---|---|
| chr10:93807880-93808030 | 2063 | 0.002 |
| chr10:93807700-93807850 | 2062 | 0.011 |
| chr10:93791500-93791650 | 2110 | 0.012 |
| chr10:93723200-93723350 | 15 | 0.015 |
| chr10:93776920-93777070 | 2110 | 0.017 |
| chr10:93668080-93668230 | 1258 | 0.022 |
| chr10:93884120-93884270 | 1872 | 0.016 |
| chr10:93884400-93884550 | 943 | 0.016 |
| chr10:93664400-93664550 | 833 | 0.006 |
| chr10:93737380-93737530 | 935 | 0.005 |
| chr10:93672660-93672810 | 445 | 0.005 |
External Databases
UCSCEnsembl (ENSG00000095564)