Gene: TRPS1
chr8: 116420723-116681228Expression Profile
(log scale)
Graphical Connections
Distribution of linked clusters:
You may find it interesting if many of the connected DHS sites belong to the same cluster.| Cluster Profile | Cluster ID | Number of DHS sites in this cluster |
|---|---|---|
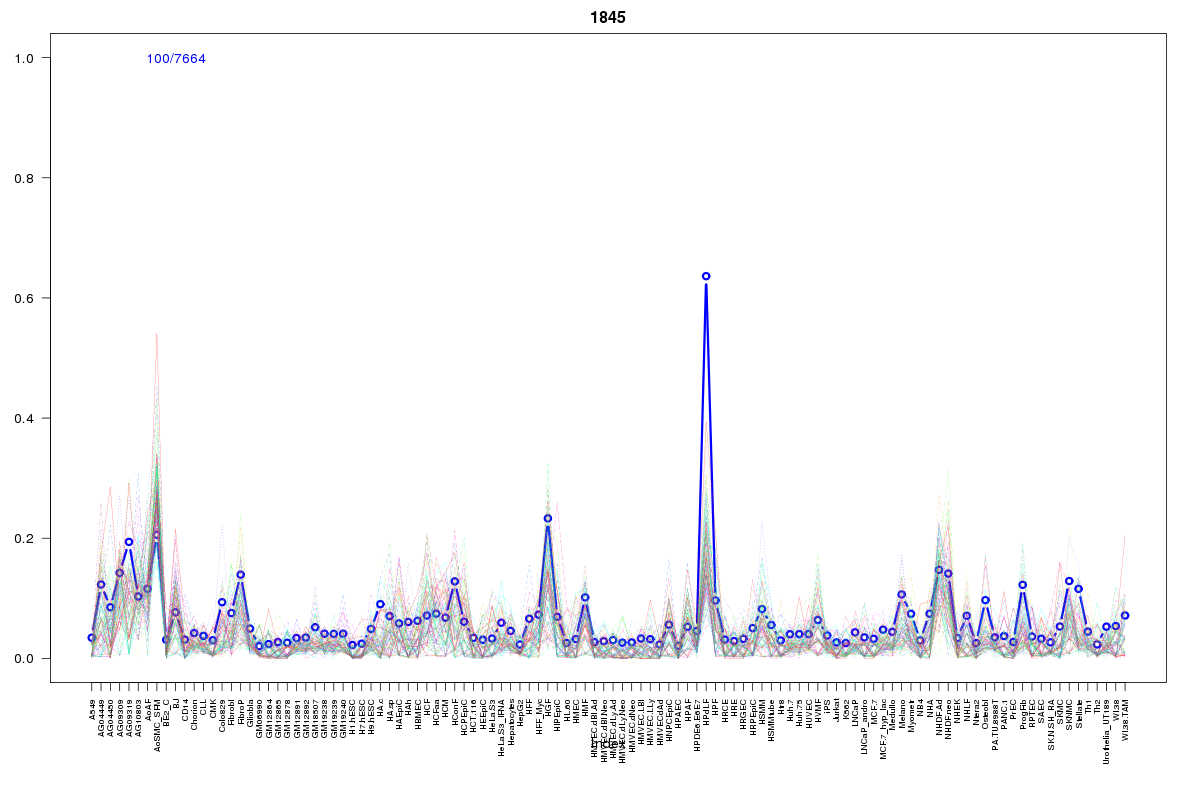 | 1845 | 2 |
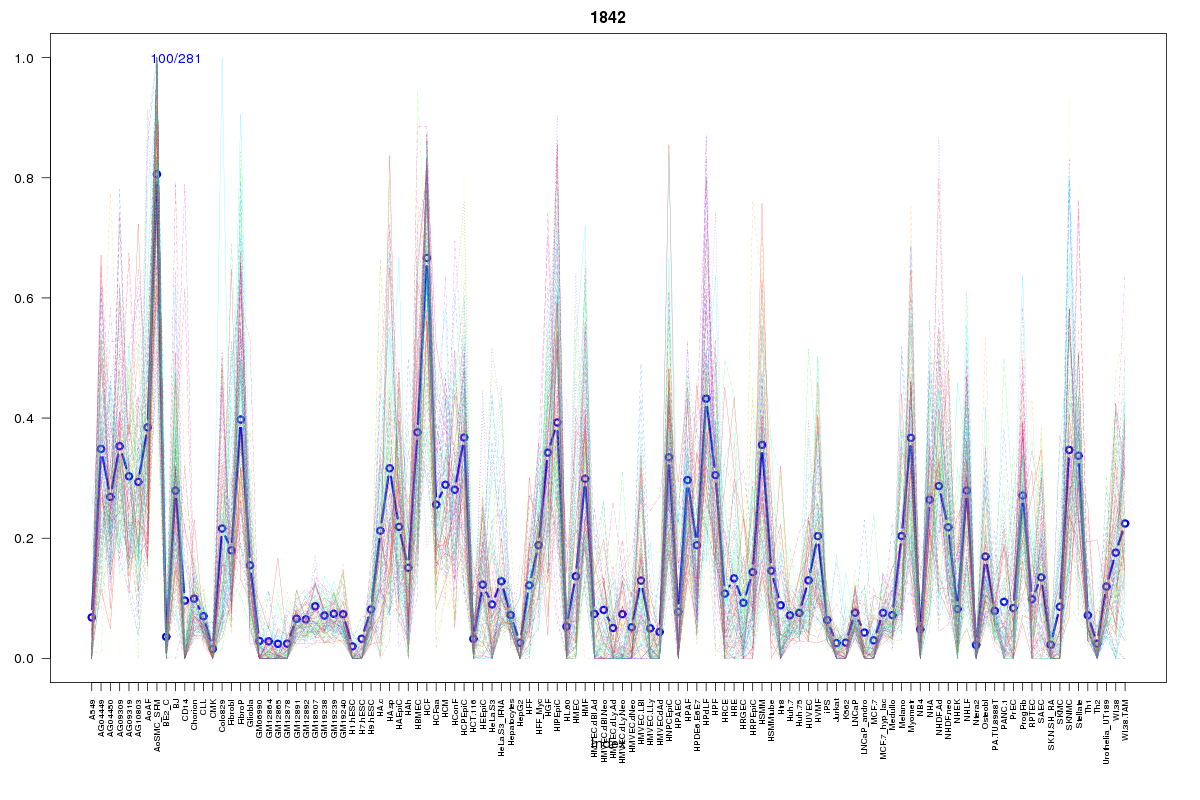 | 1842 | 2 |
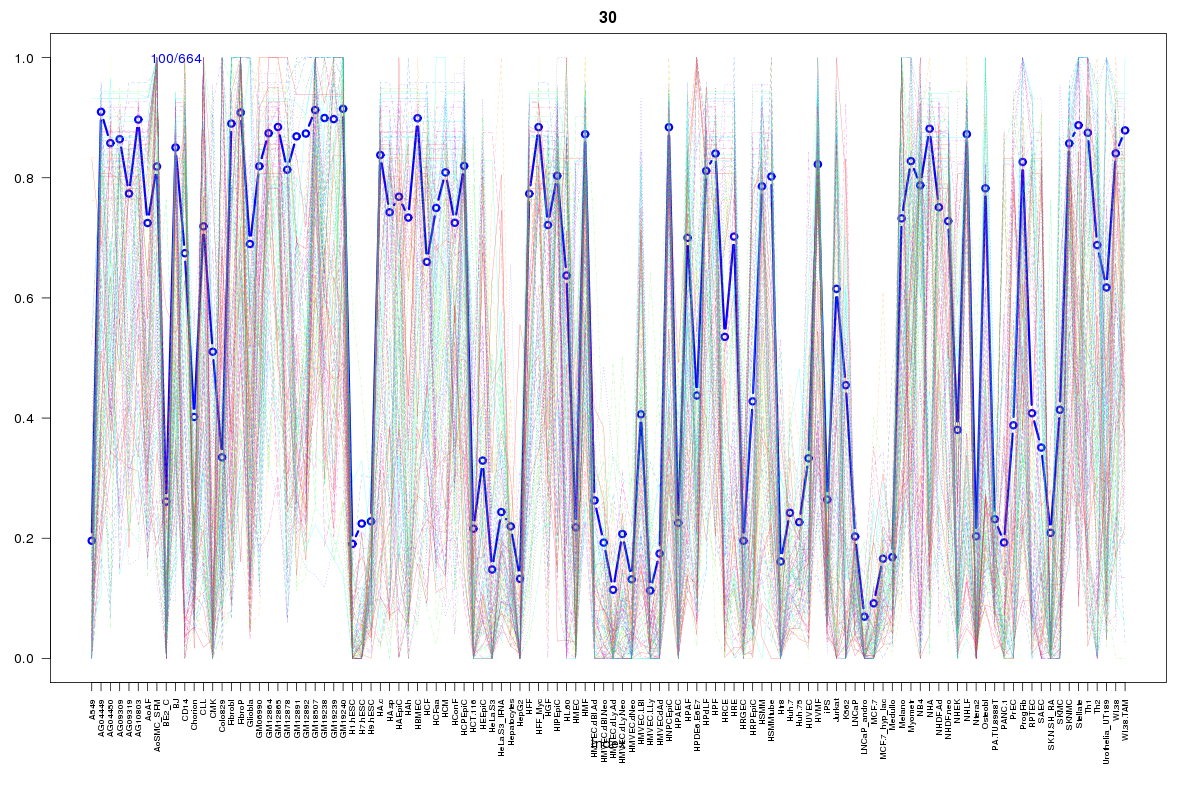 | 30 | 1 |
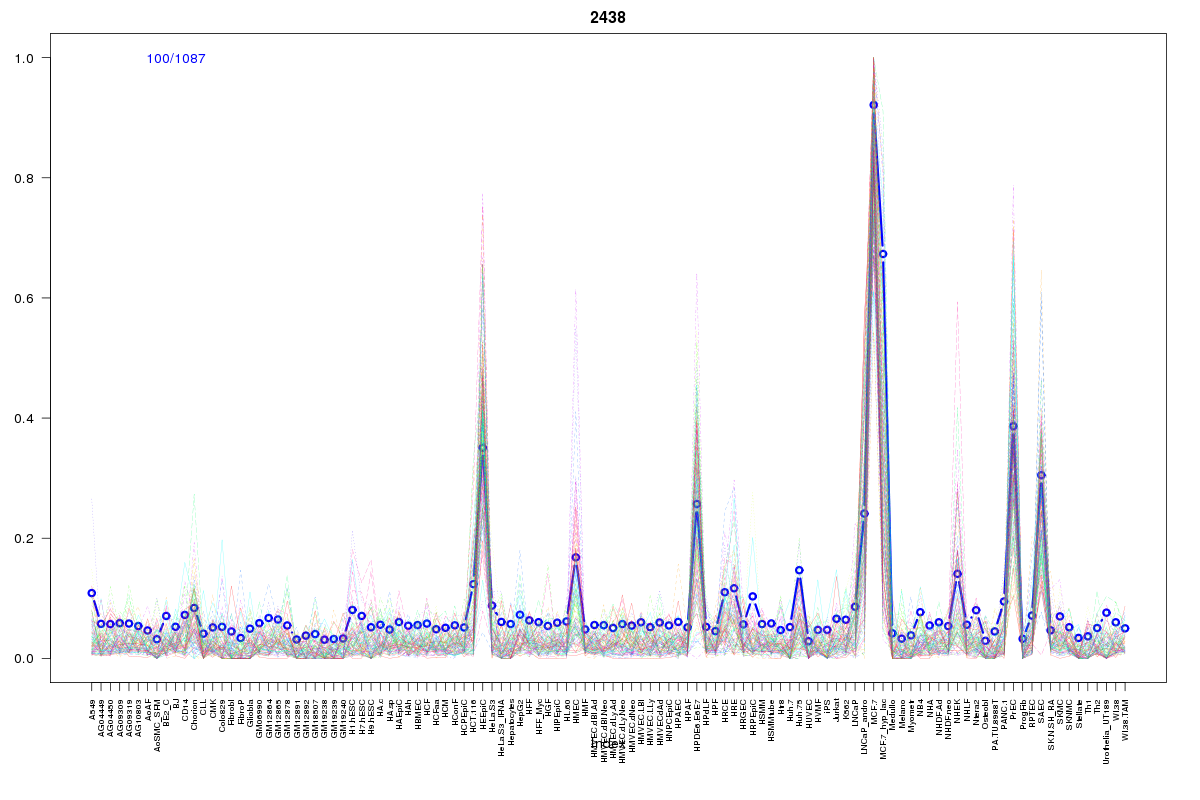 | 2438 | 1 |
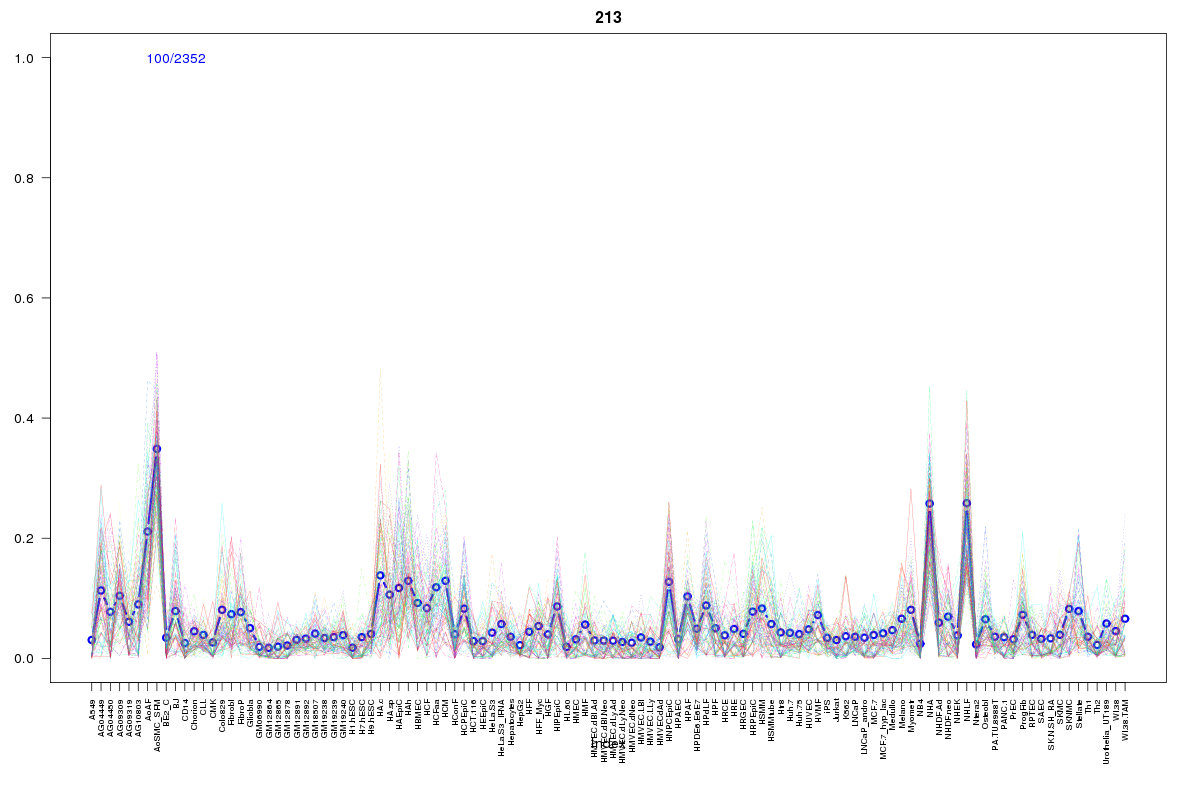 | 213 | 1 |
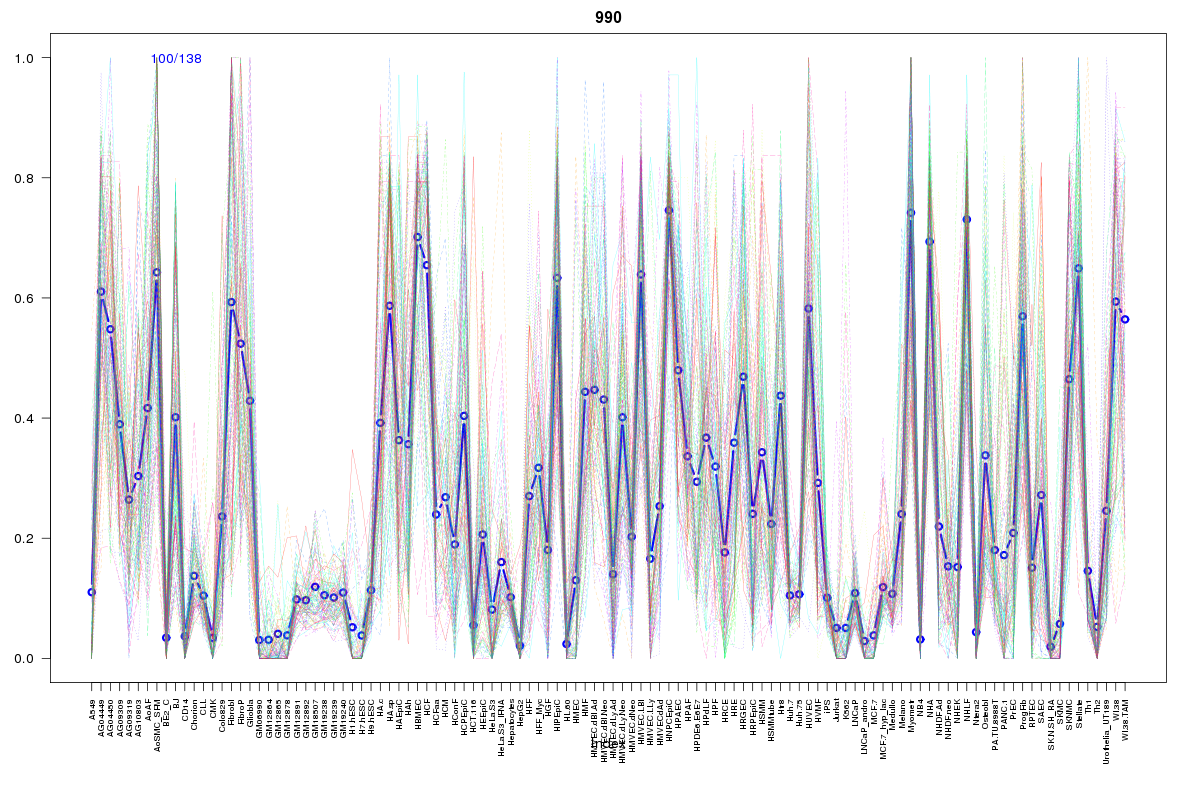 | 990 | 1 |
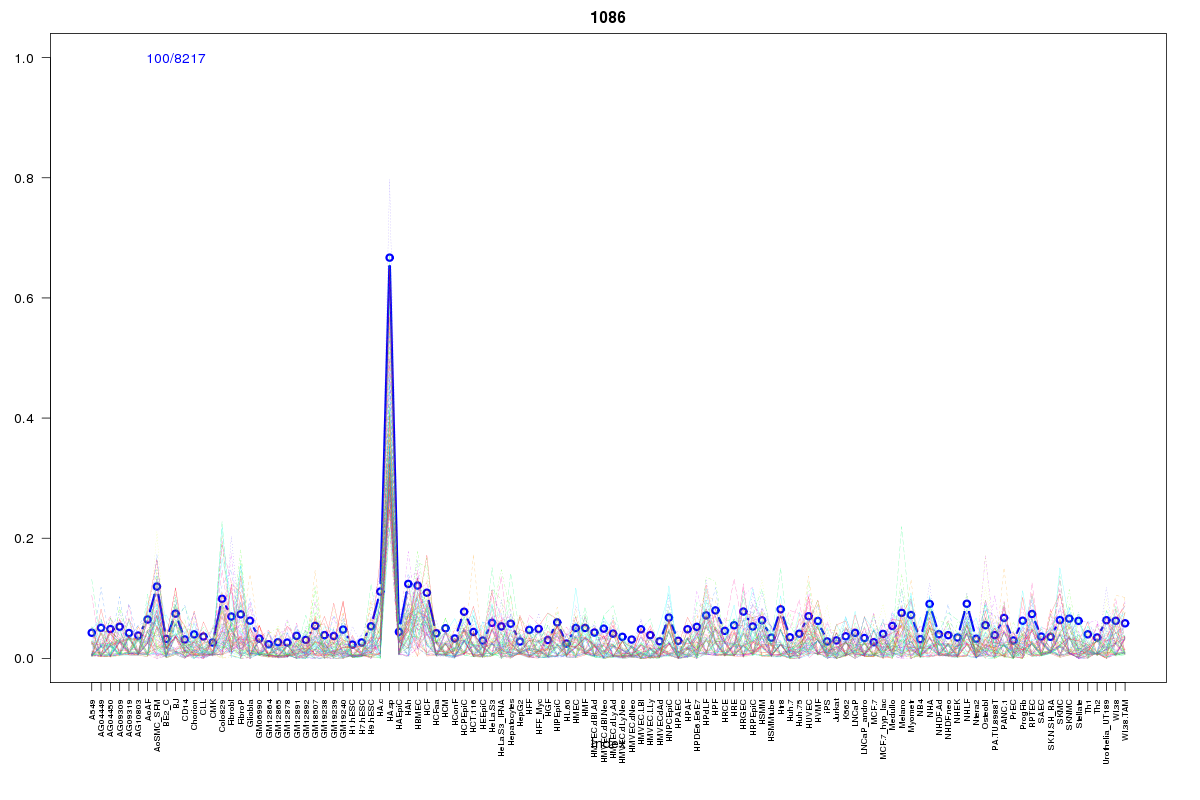 | 1086 | 1 |
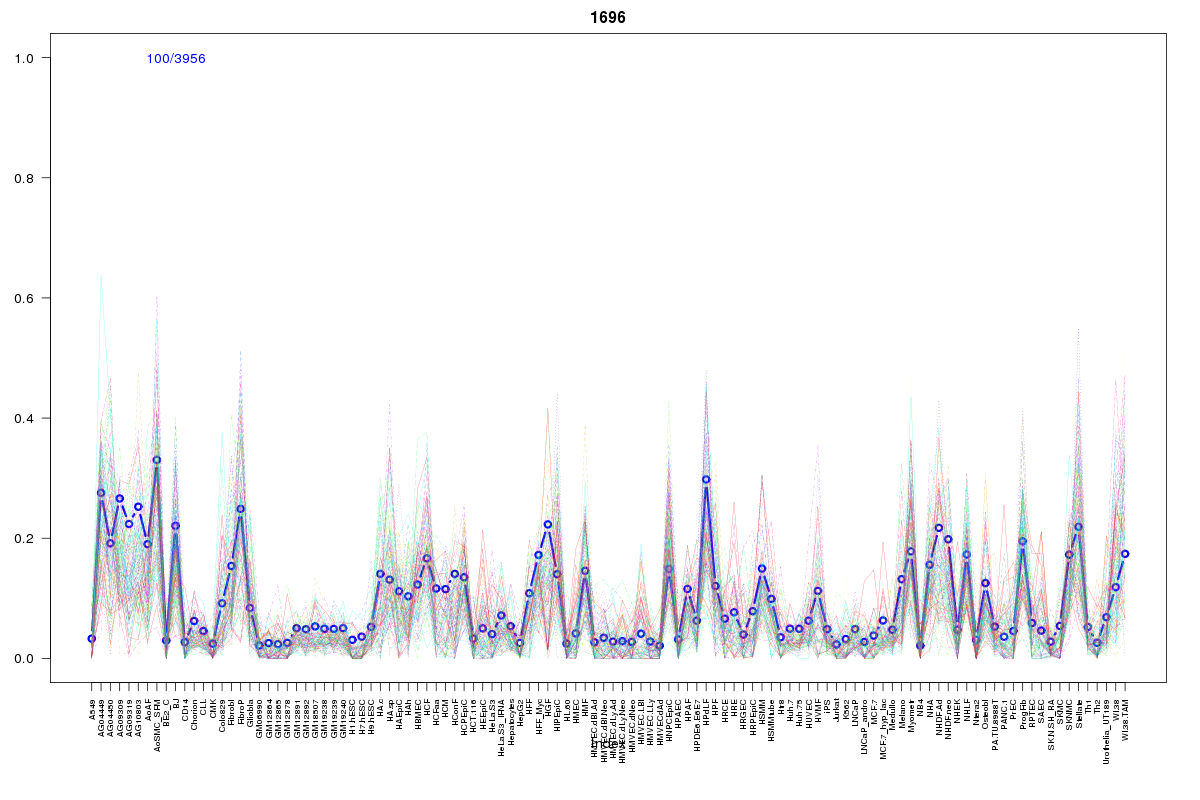 | 1696 | 1 |
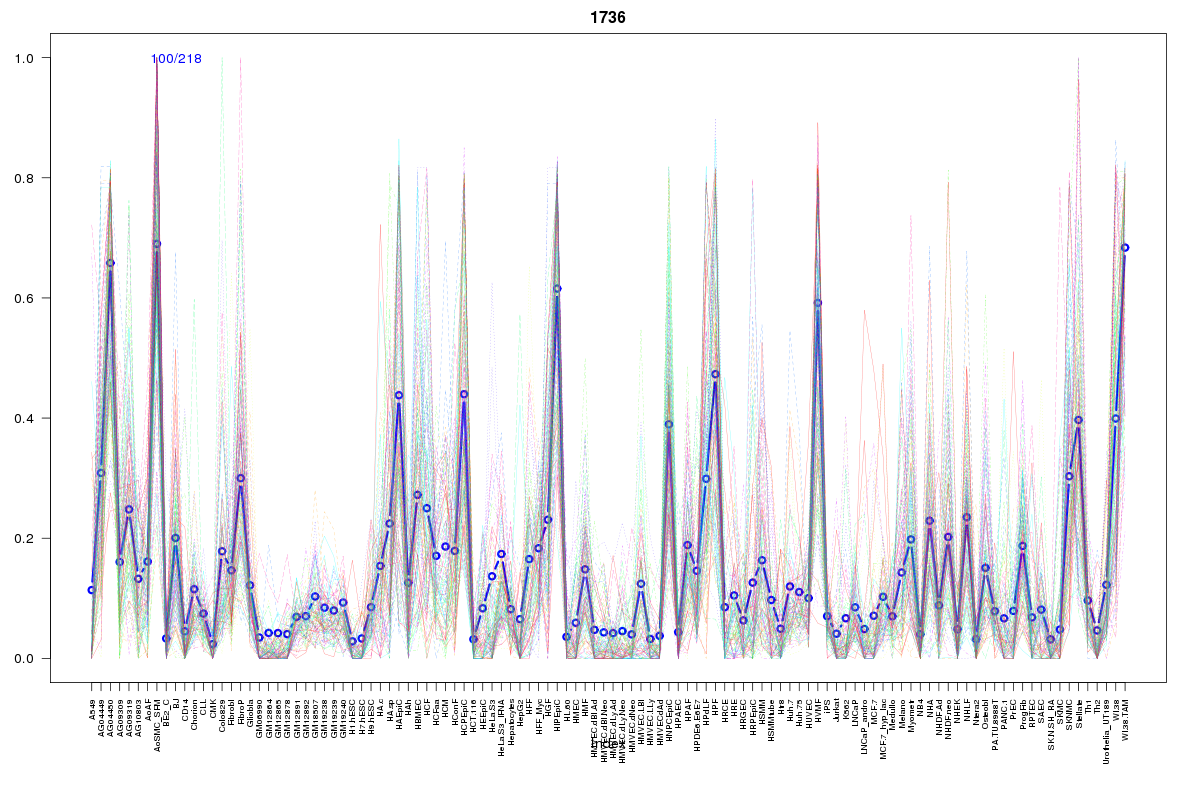 | 1736 | 1 |
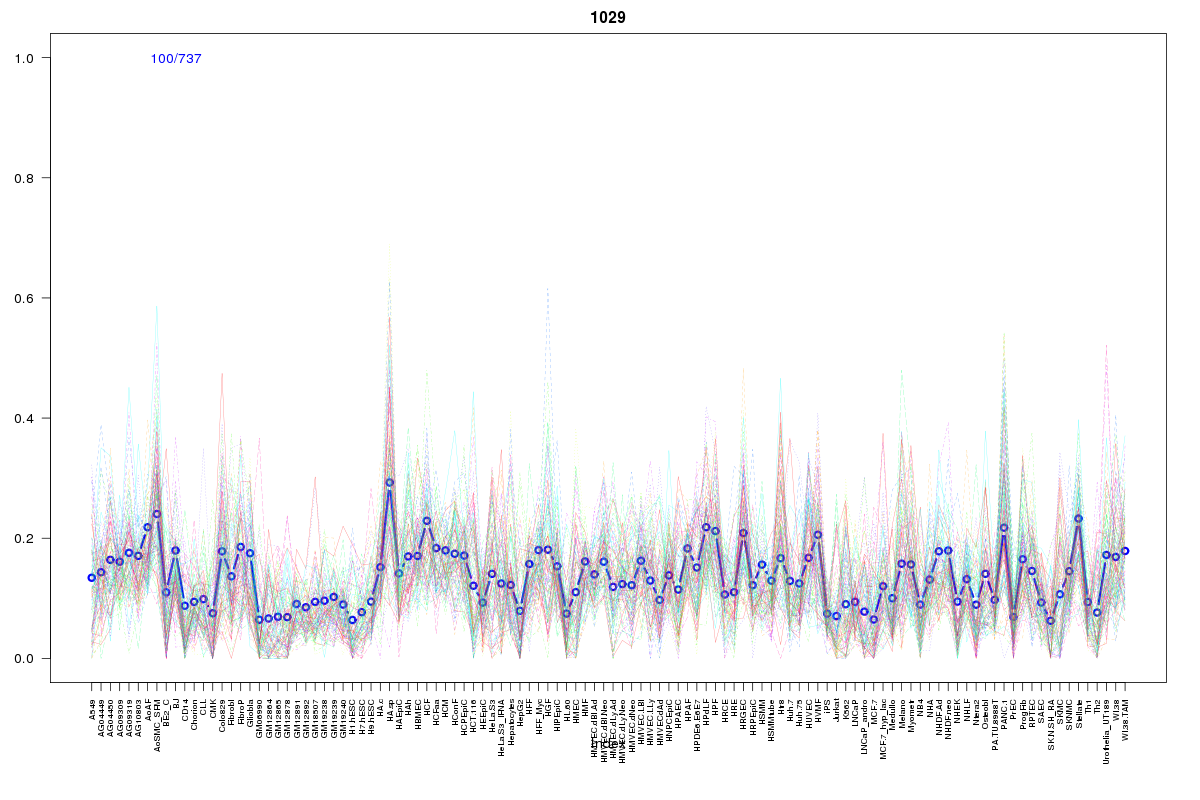 | 1029 | 1 |
 | 1596 | 1 |
 | 957 | 1 |
 | 946 | 1 |
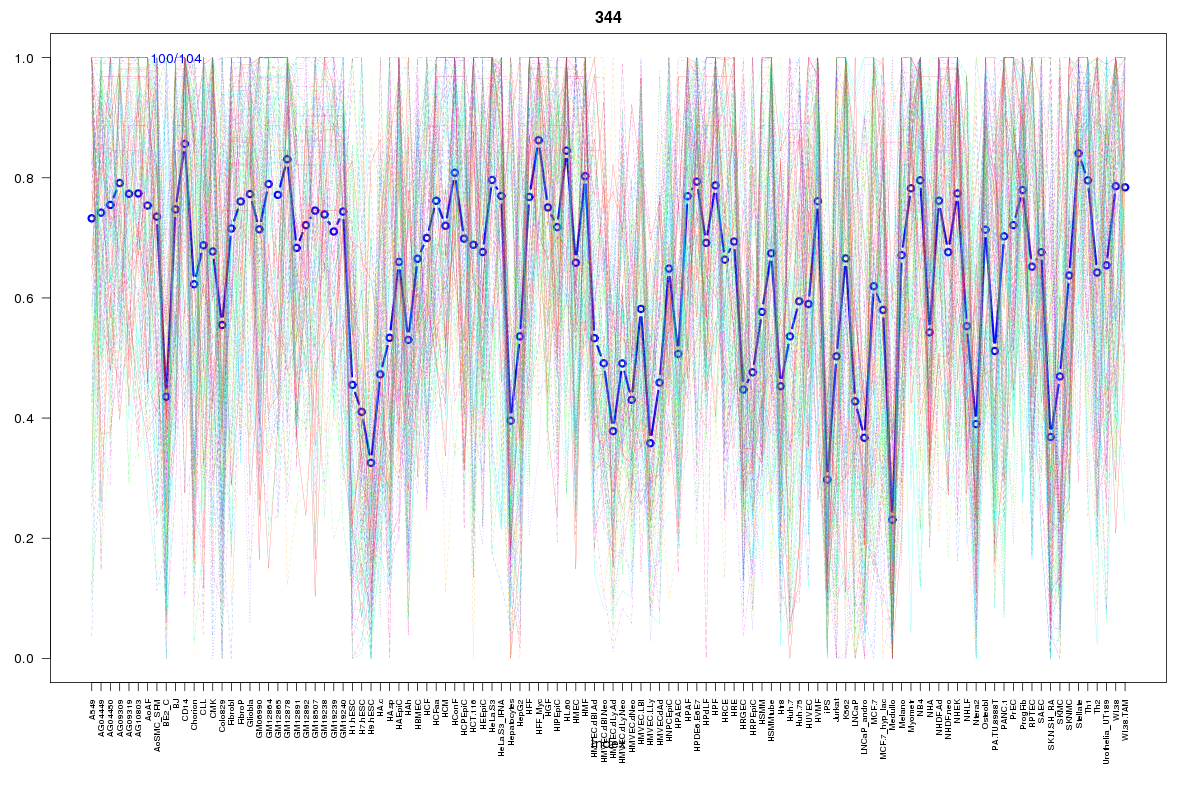 | 344 | 1 |
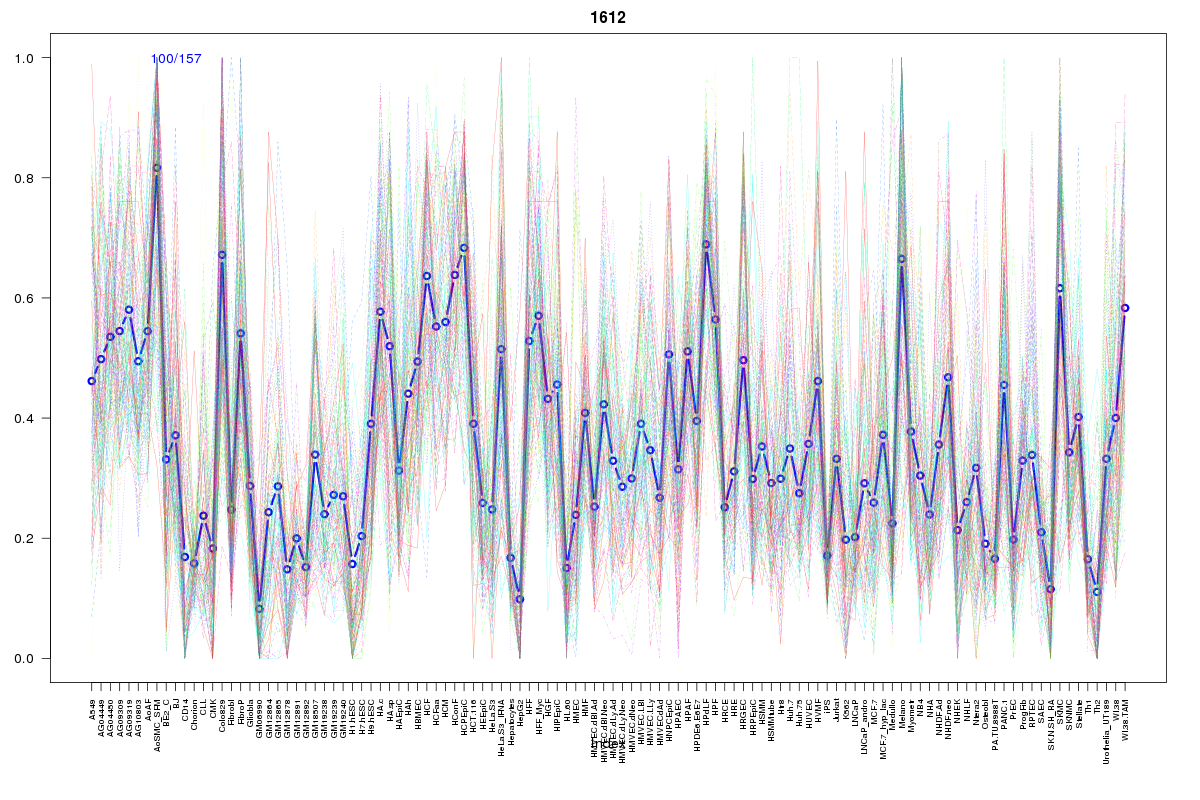 | 1612 | 1 |
 | 1310 | 1 |
 | 445 | 1 |
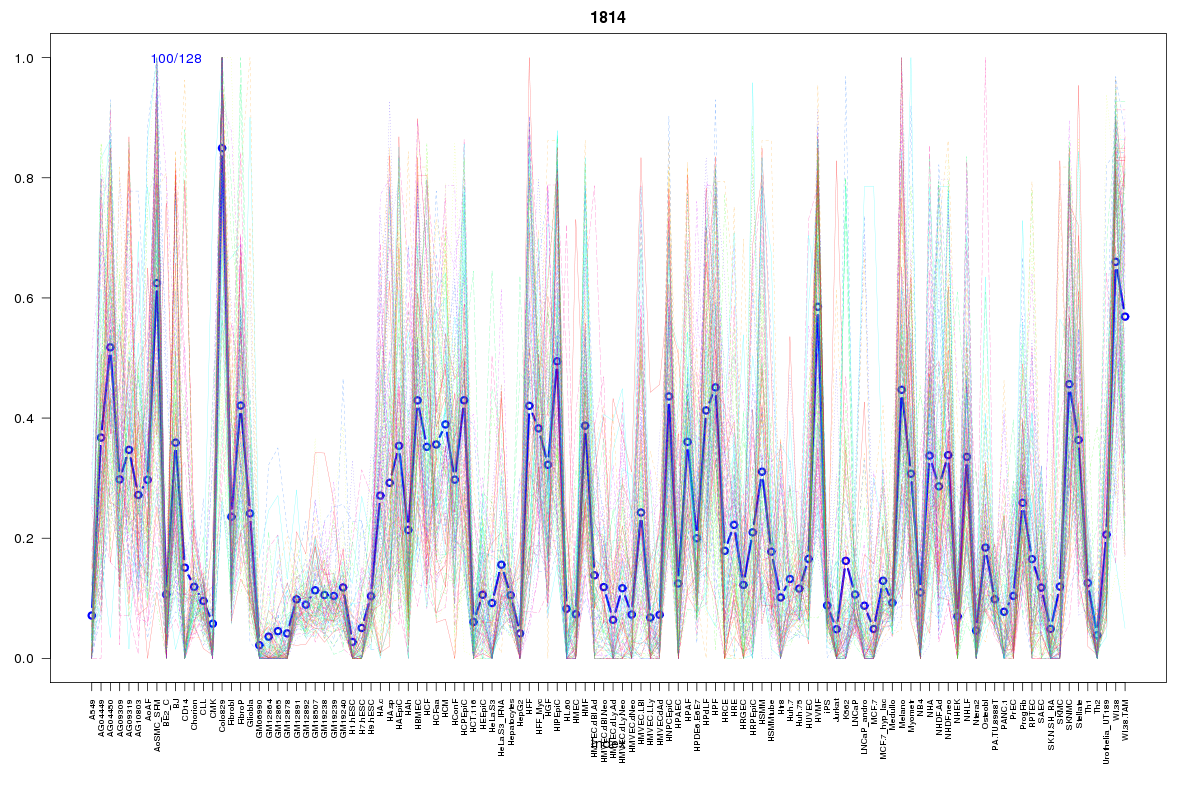 | 1814 | 1 |
 | 1595 | 1 |
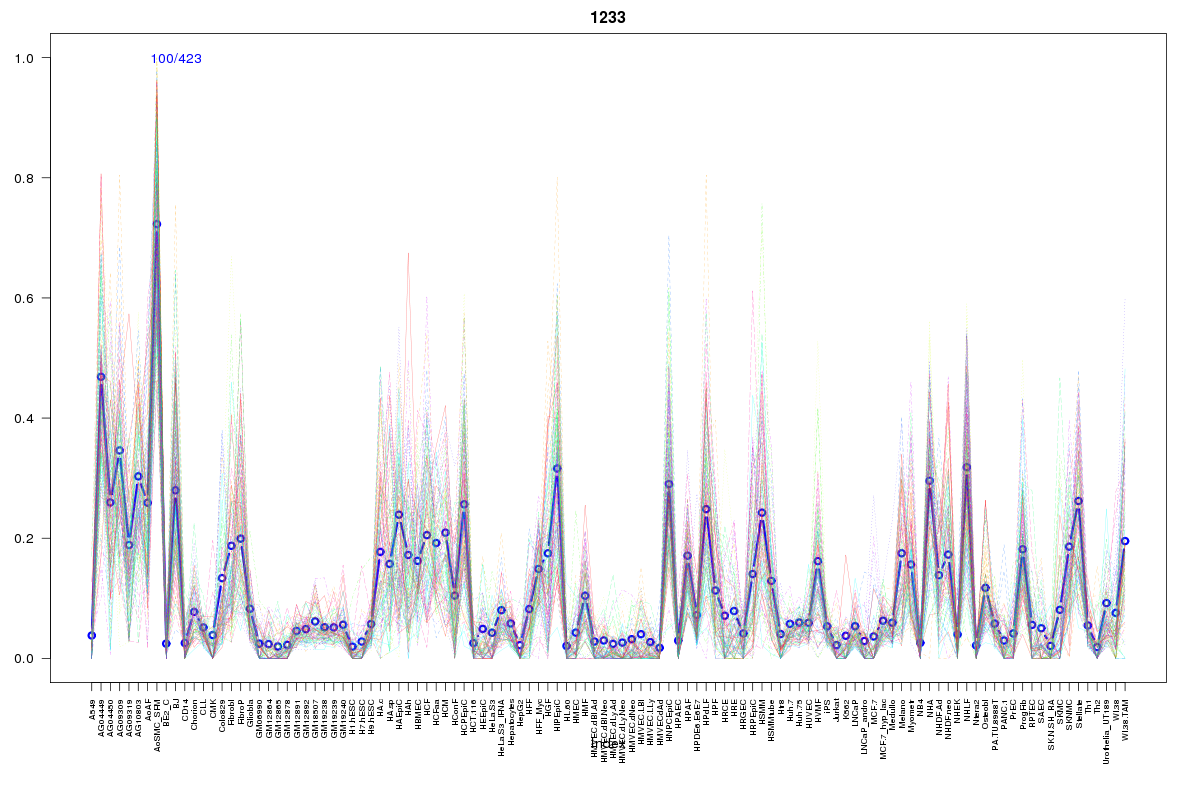 | 1233 | 1 |
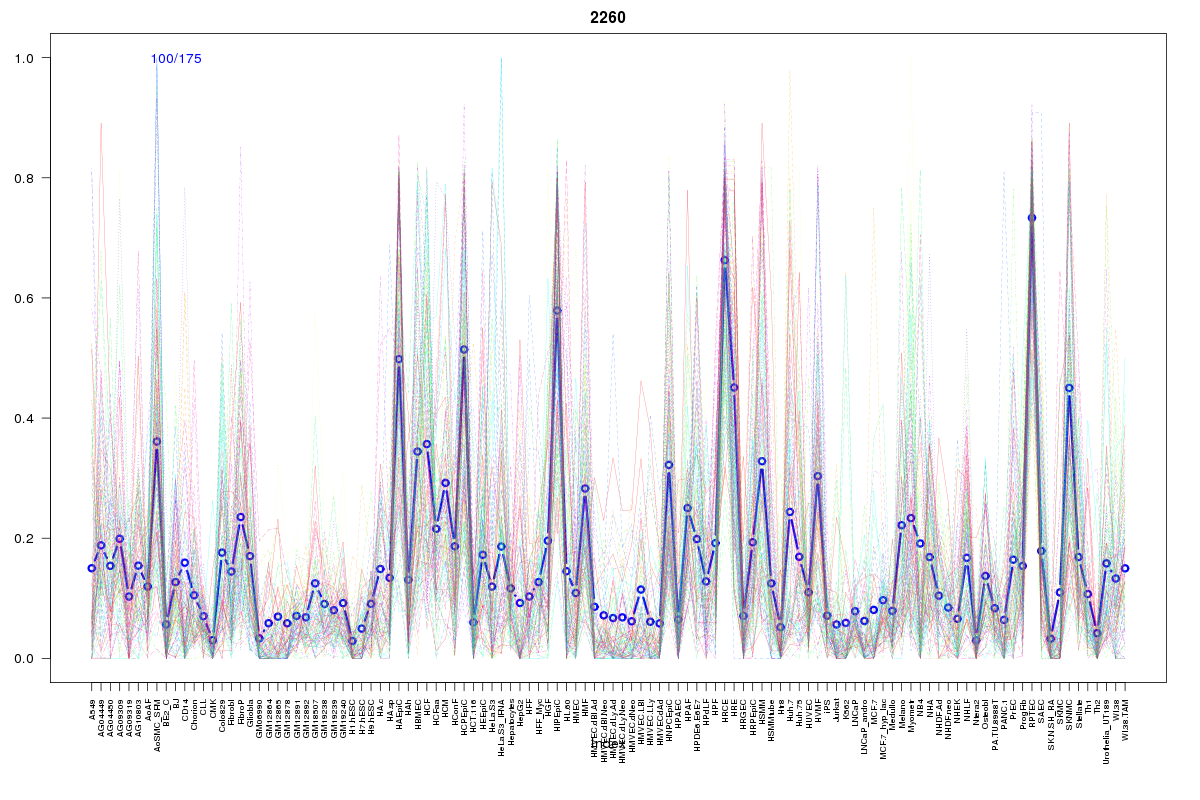 | 2260 | 1 |
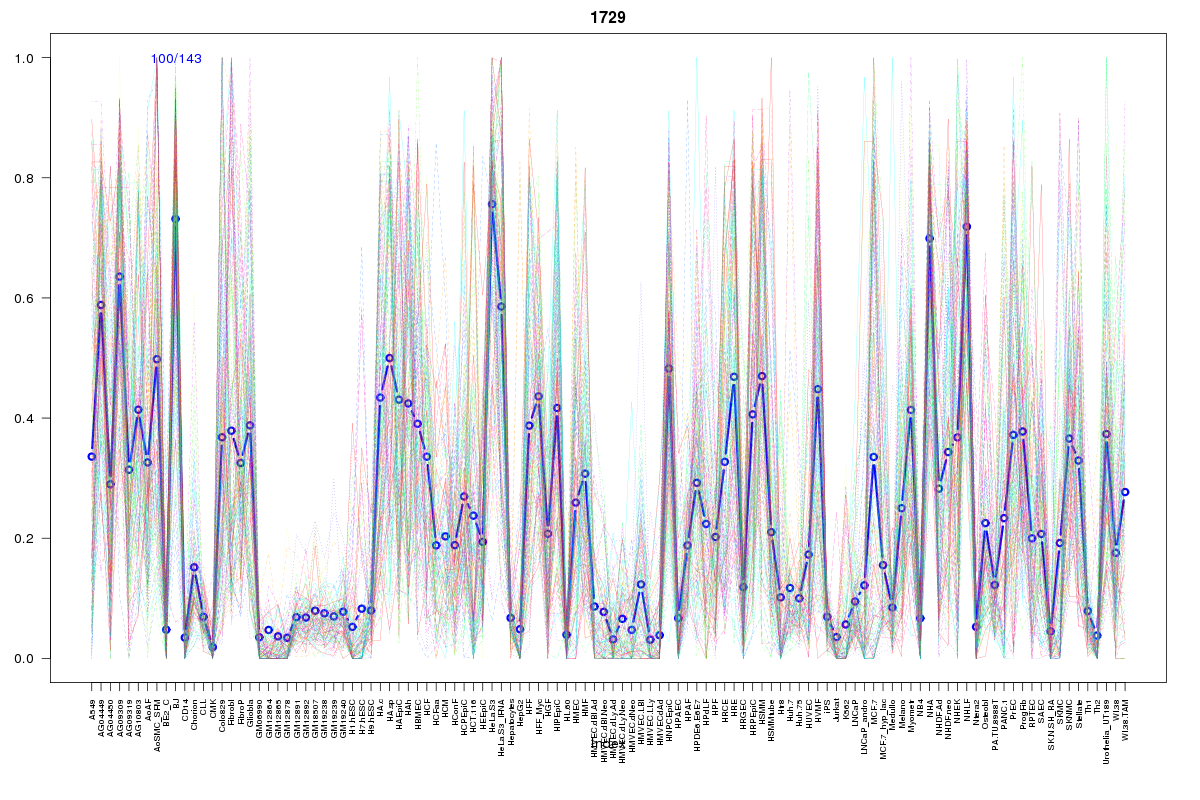 | 1729 | 1 |
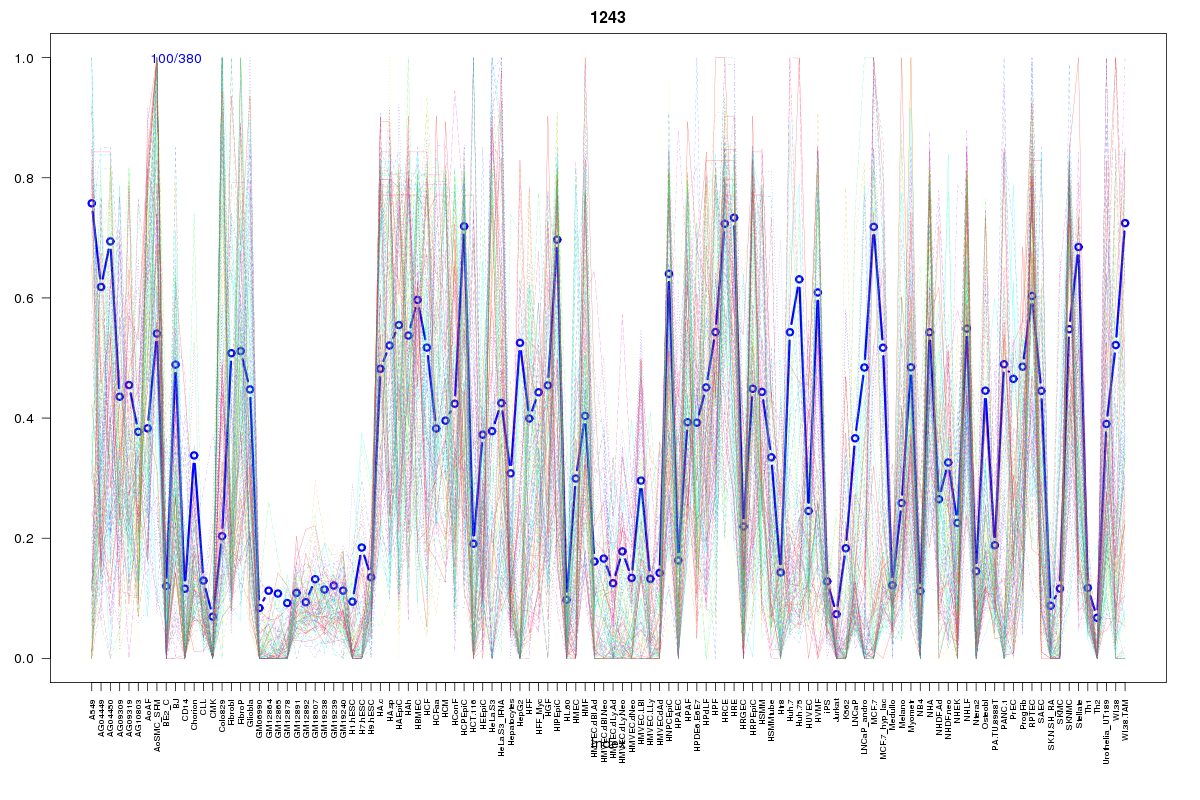 | 1243 | 1 |
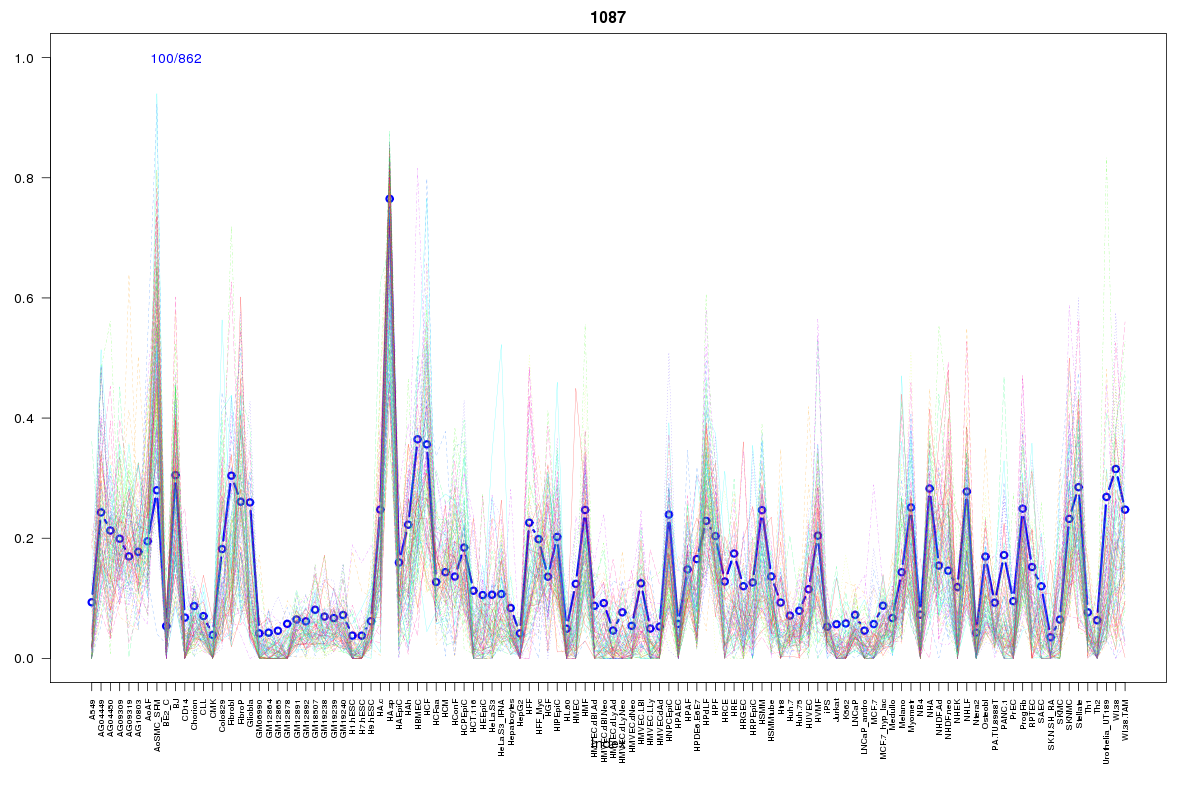 | 1087 | 1 |
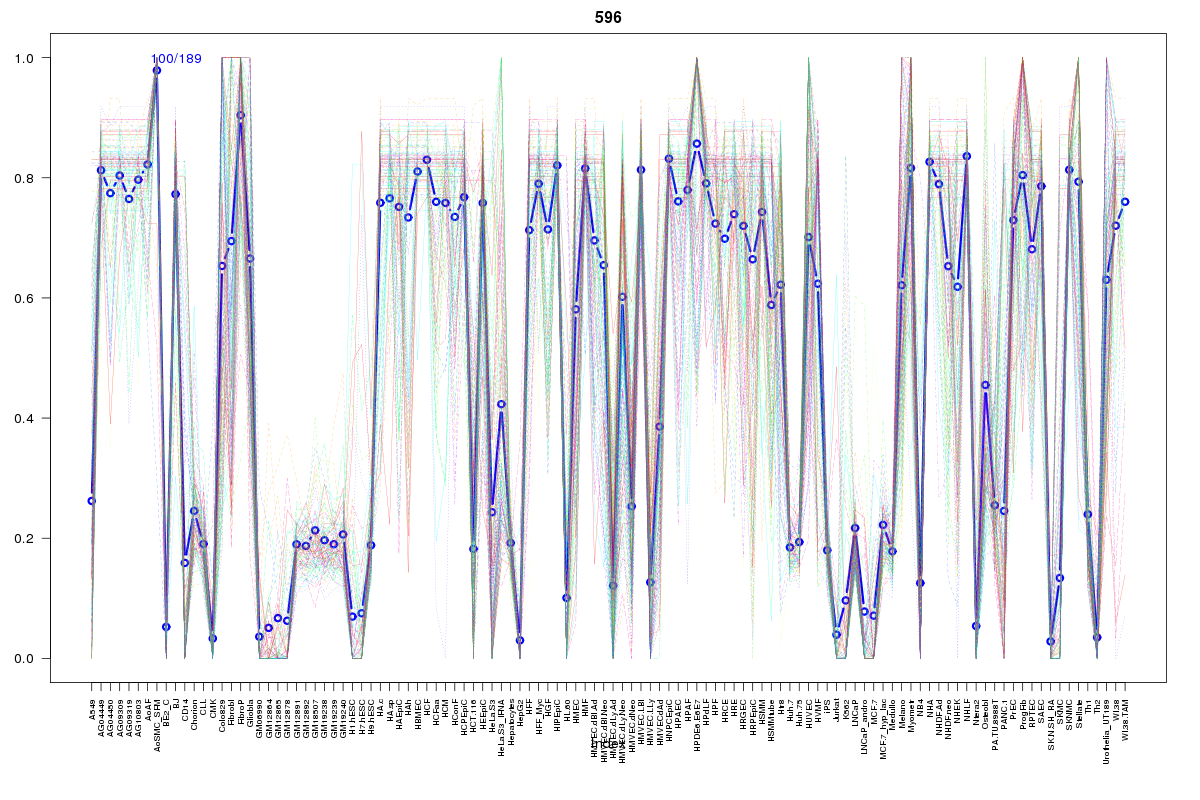 | 596 | 1 |
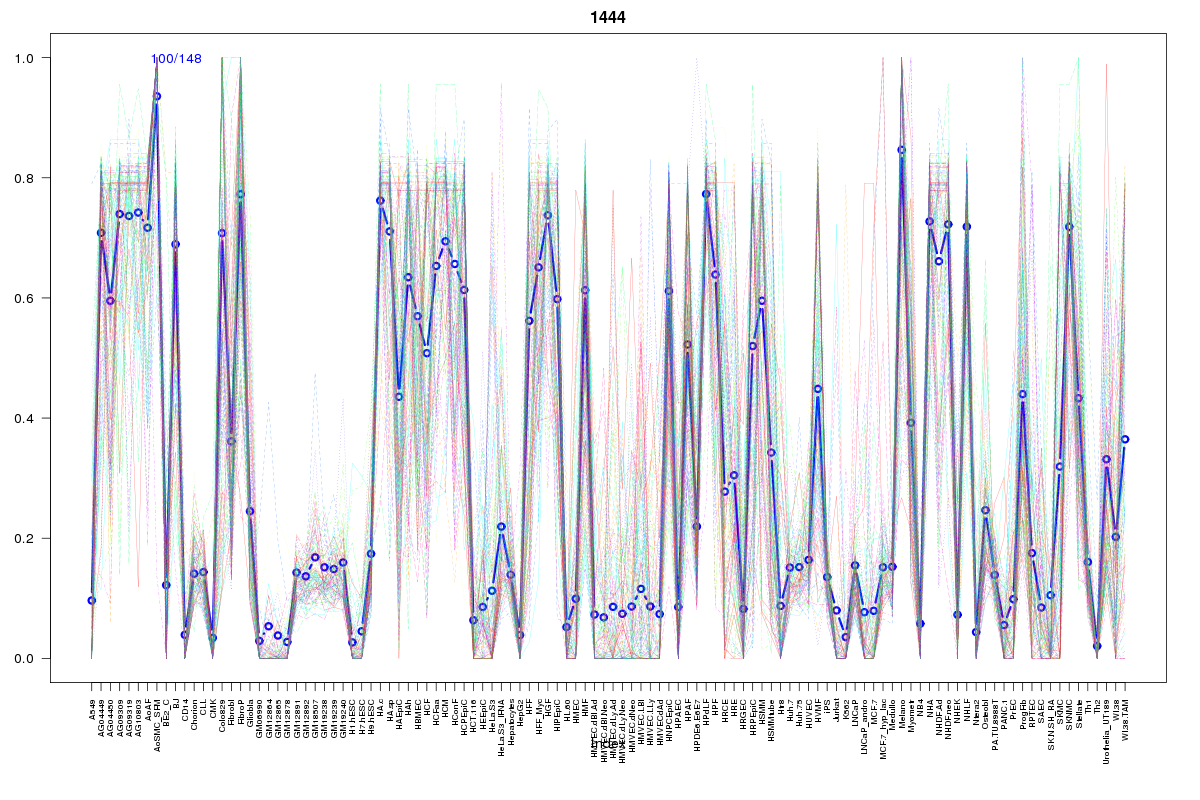 | 1444 | 1 |
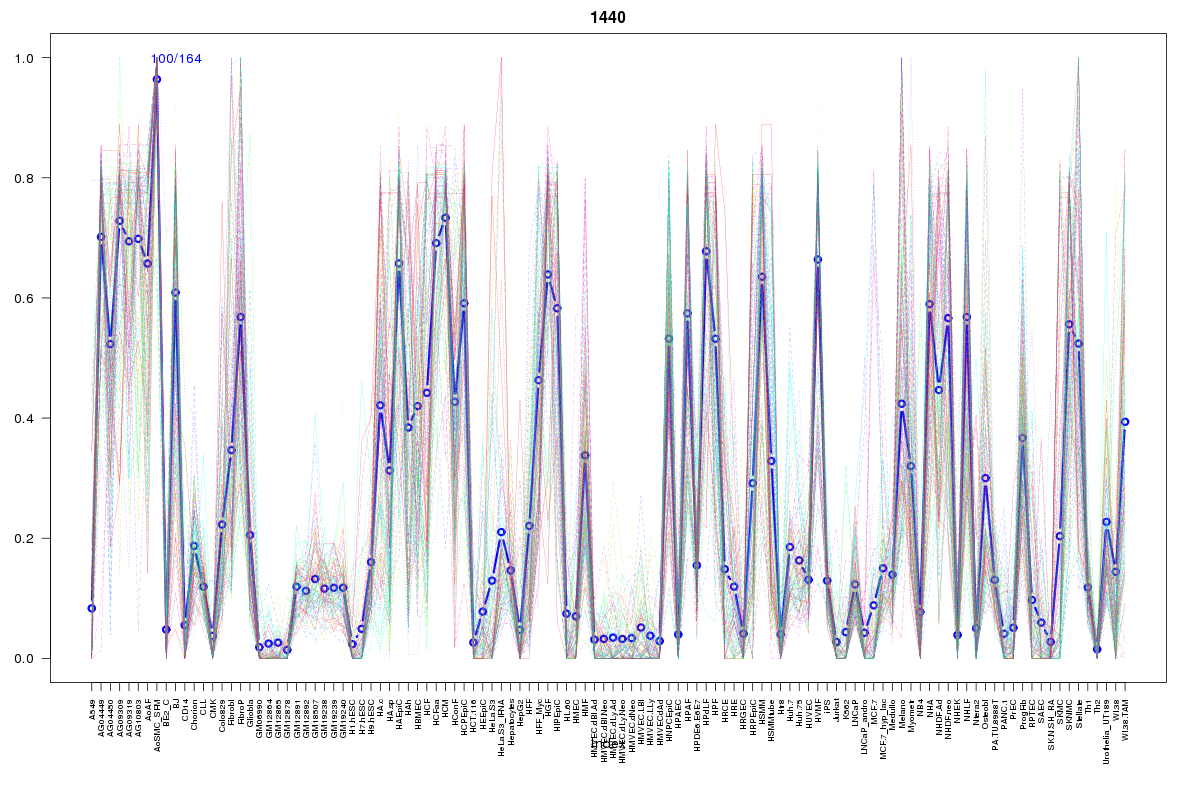 | 1440 | 1 |
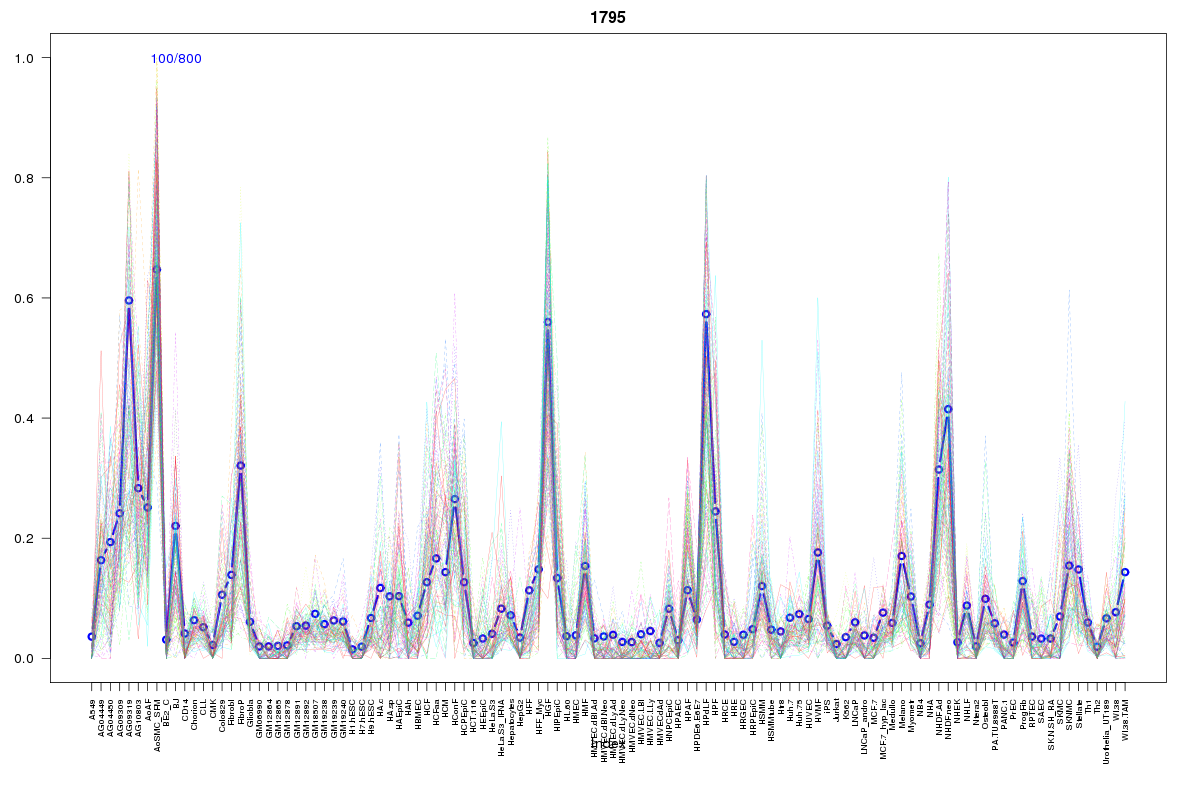 | 1795 | 1 |
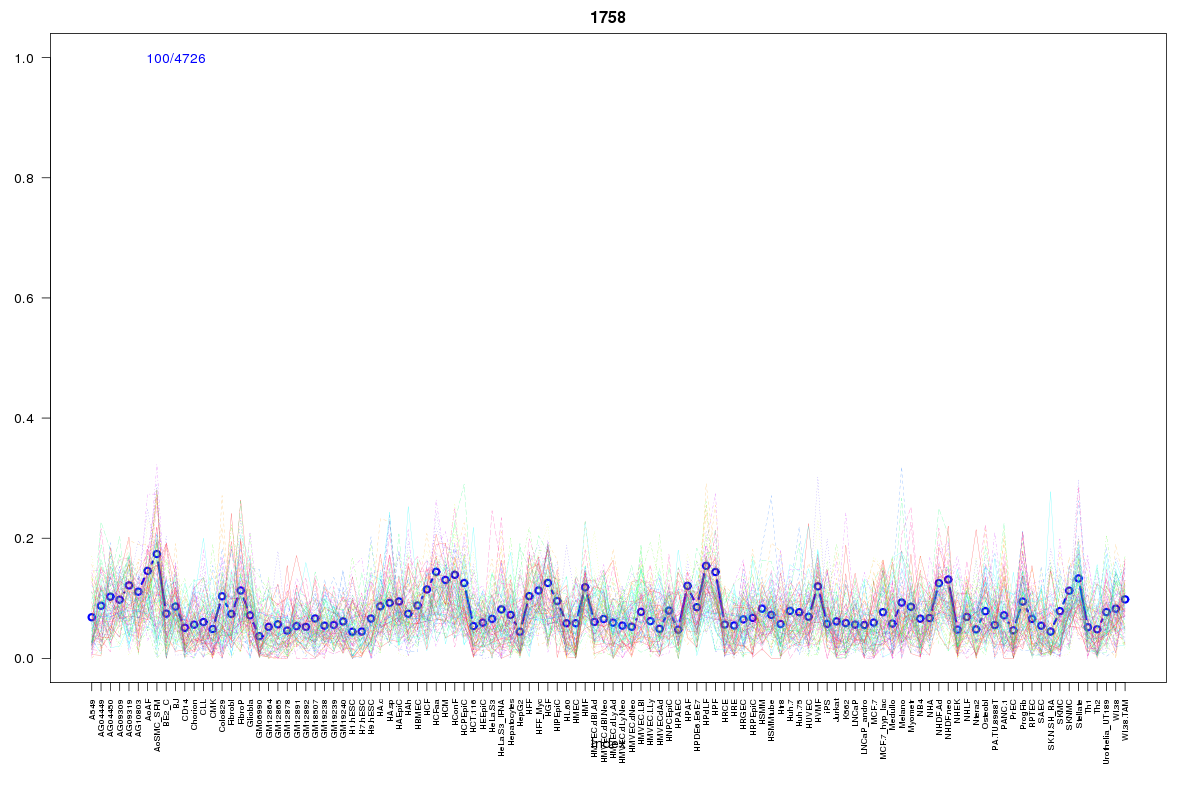 | 1758 | 1 |
Resources
BED file downloads
Connects to 31 DHS sitesTop 10 Correlated DHS Sites
p-values indiciate significant higher or lower correlation| Location | Cluster | P-value |
|---|---|---|
| chr8:116678785-116678935 | 1029 | 0 |
| chr8:116588720-116588870 | 596 | 0 |
| chr8:116681160-116681310 | 344 | 0 |
| chr8:116678580-116678730 | 1696 | 0.003 |
| chr8:116464240-116464390 | 1612 | 0.003 |
| chr8:116680525-116680675 | 957 | 0.003 |
| chr8:116431840-116431990 | 1444 | 0.003 |
| chr8:116619220-116619370 | 1440 | 0.005 |
| chr8:116464040-116464190 | 946 | 0.005 |
| chr8:116464400-116464550 | 445 | 0.006 |
| chr8:116576220-116576370 | 1243 | 0.008 |
External Databases
UCSCEnsembl (ENSG00000104447)