Gene: NCS1
chr9: 132934856-132999583Expression Profile
(log scale)
Graphical Connections
Distribution of linked clusters:
You may find it interesting if many of the connected DHS sites belong to the same cluster.| Cluster Profile | Cluster ID | Number of DHS sites in this cluster |
|---|---|---|
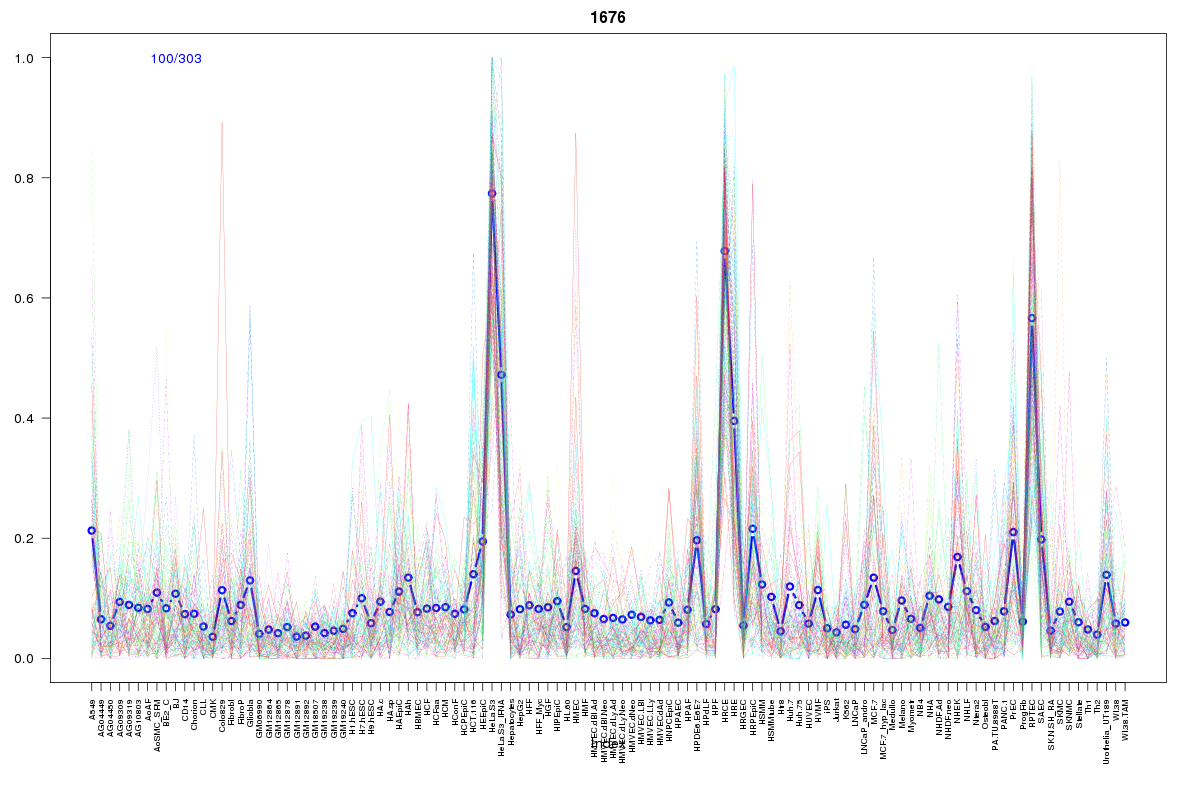 | 1676 | 2 |
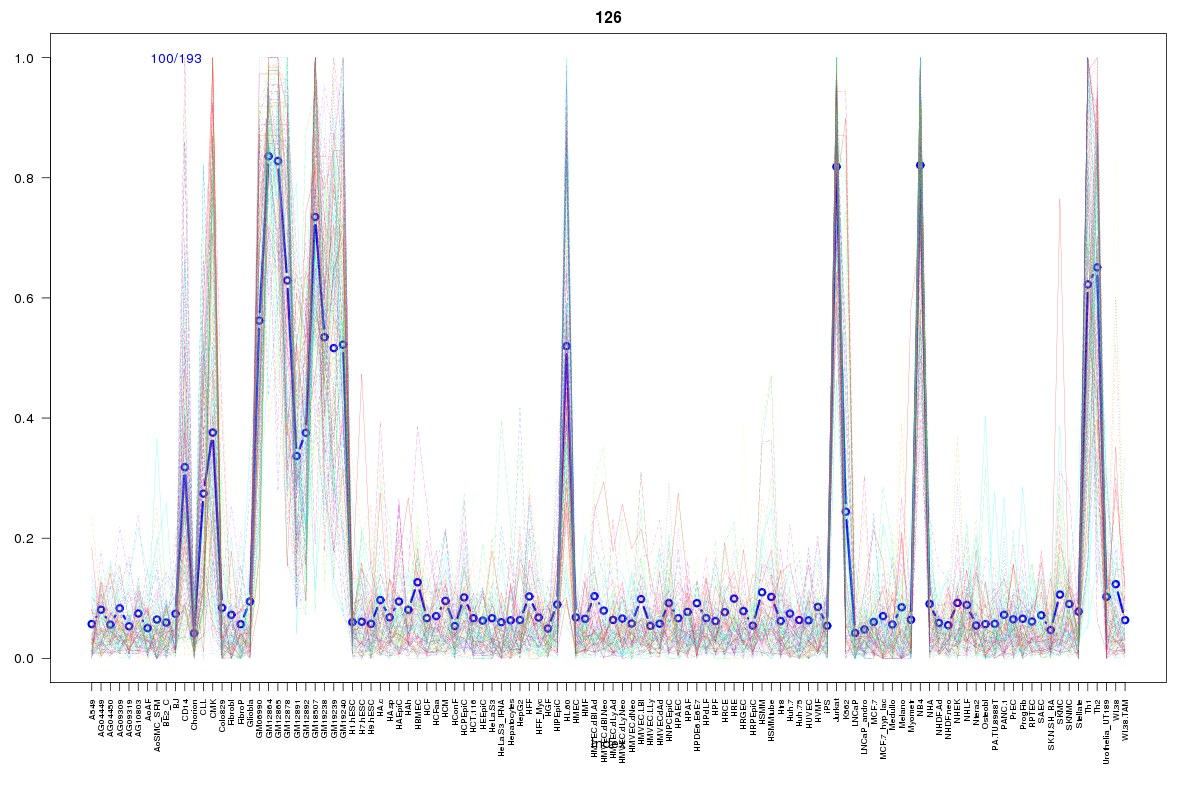 | 126 | 1 |
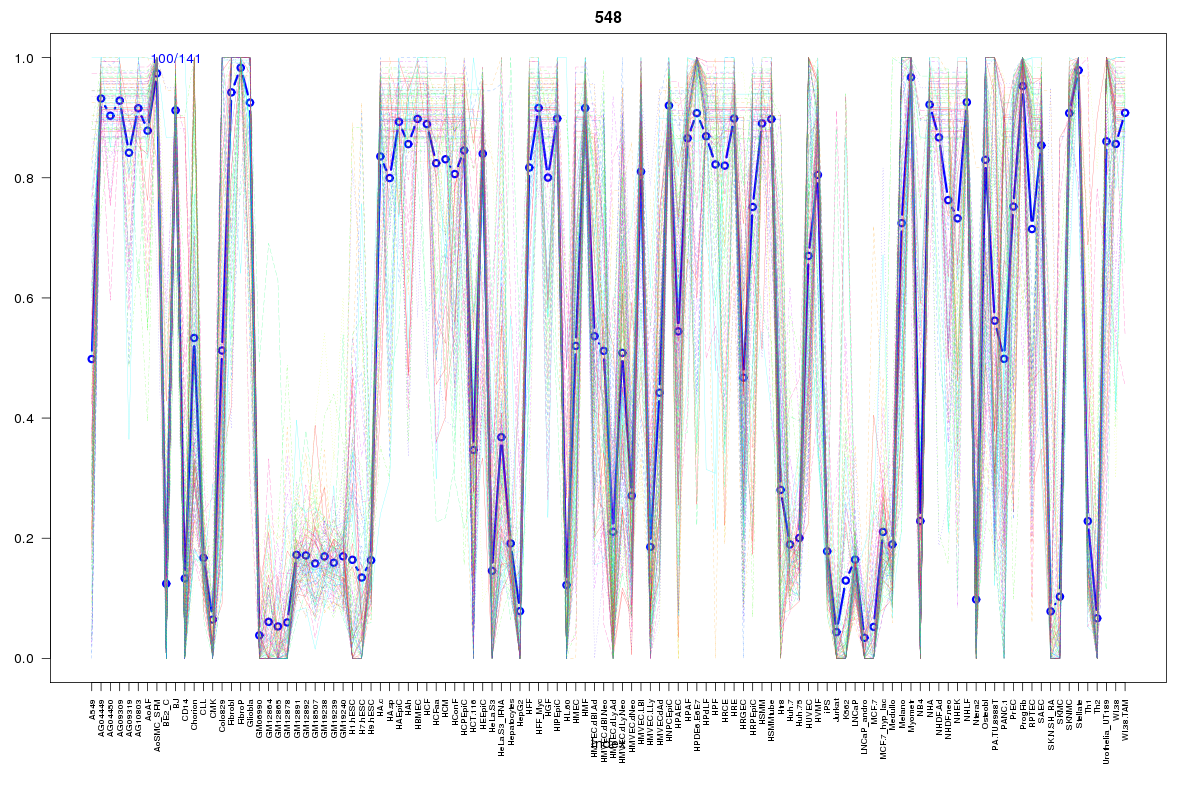 | 548 | 1 |
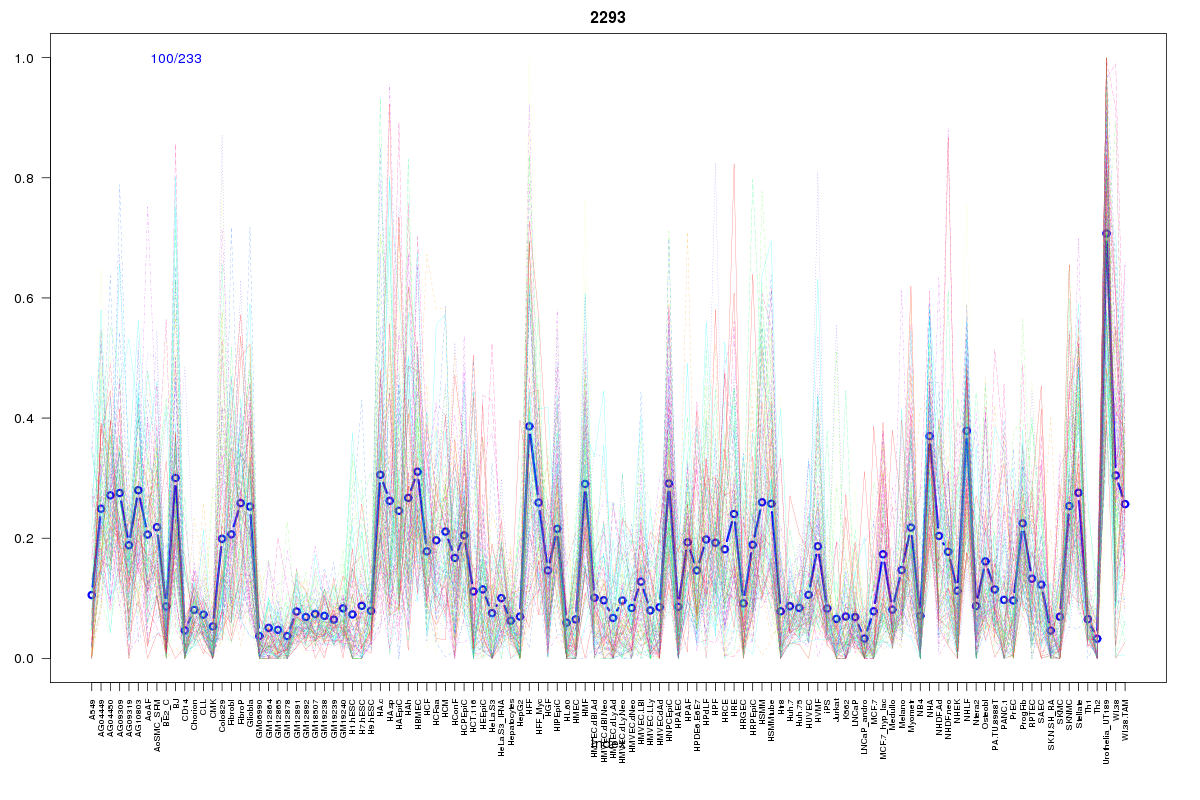 | 2293 | 1 |
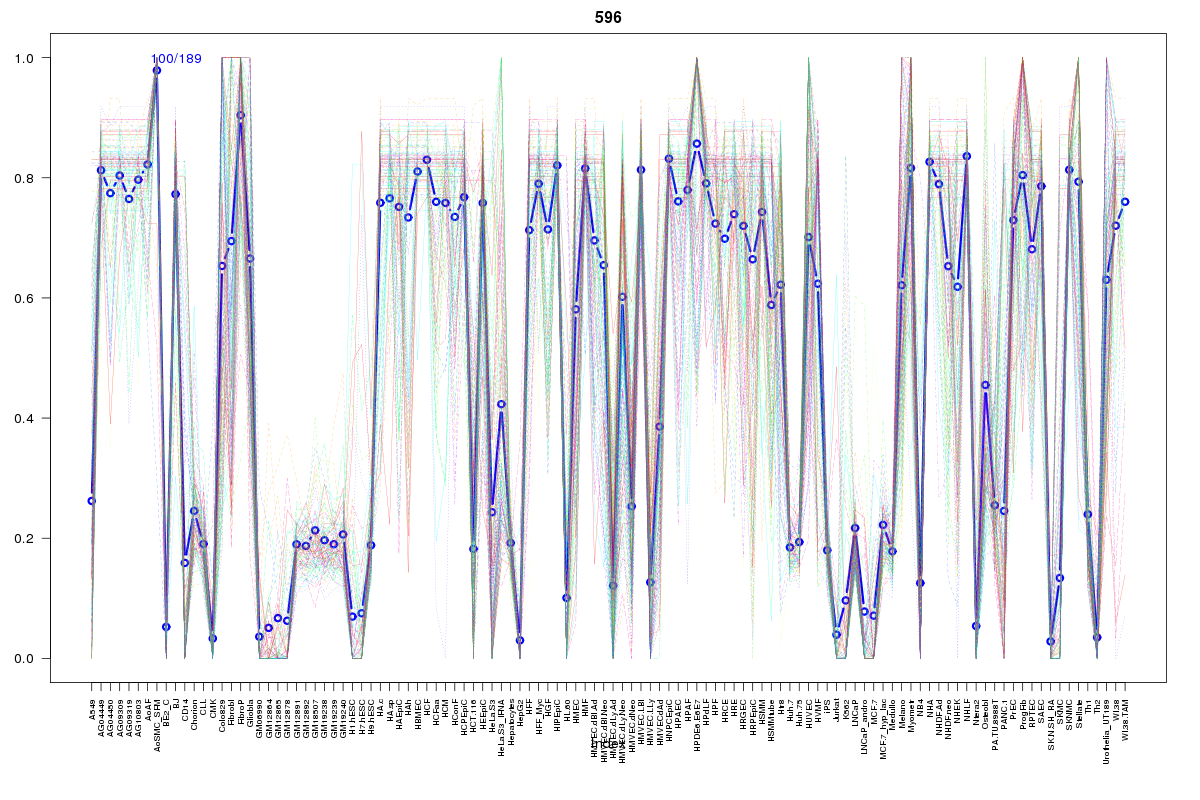 | 596 | 1 |
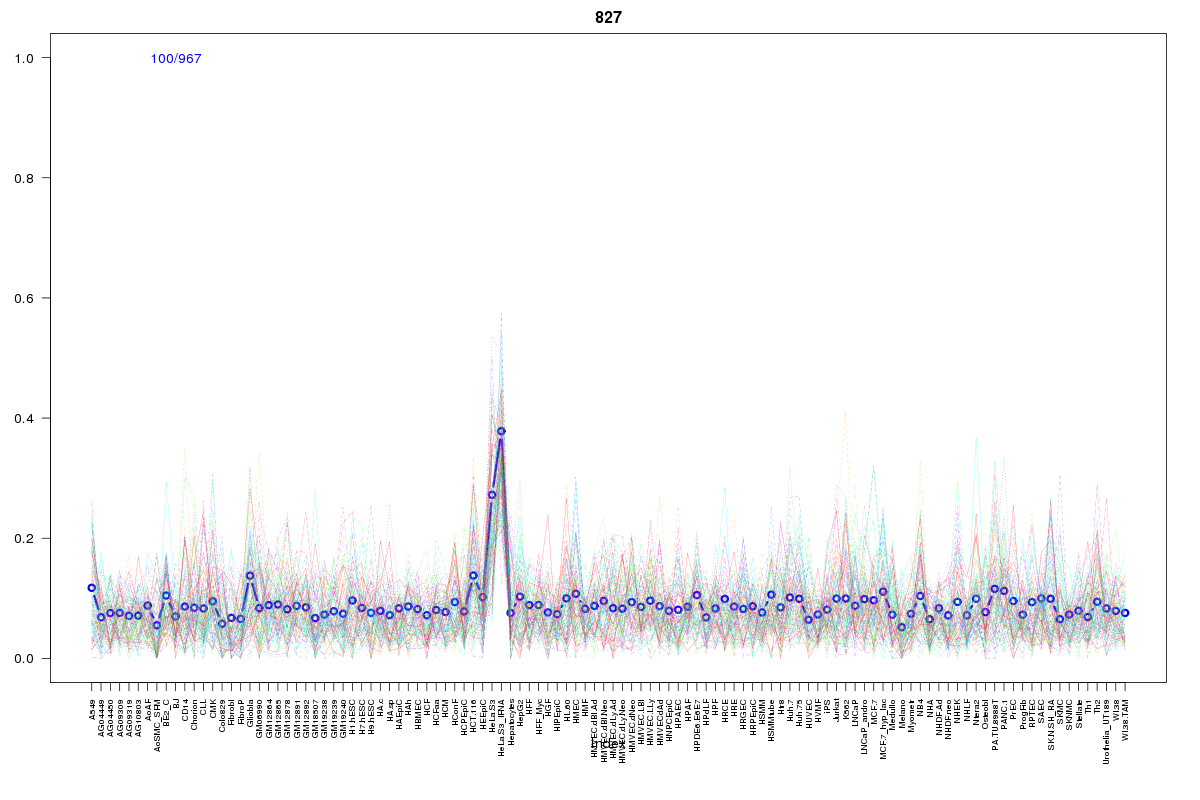 | 827 | 1 |
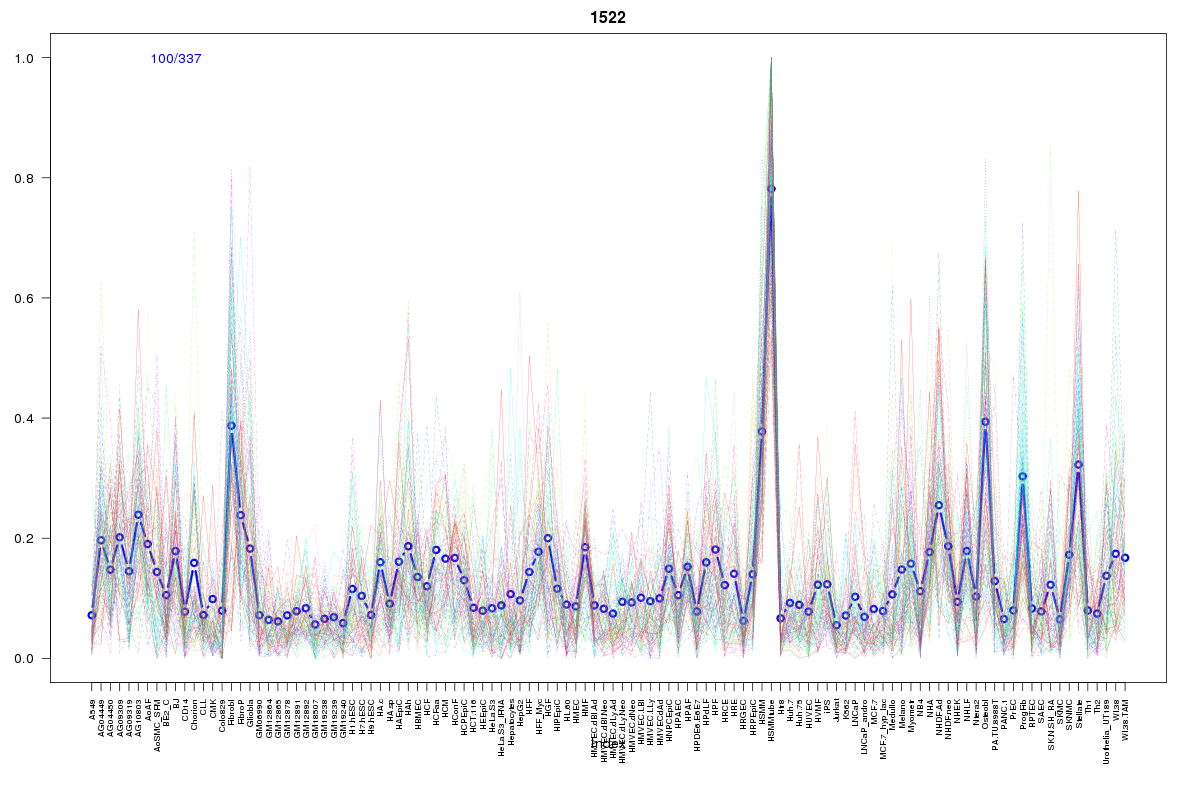 | 1522 | 1 |
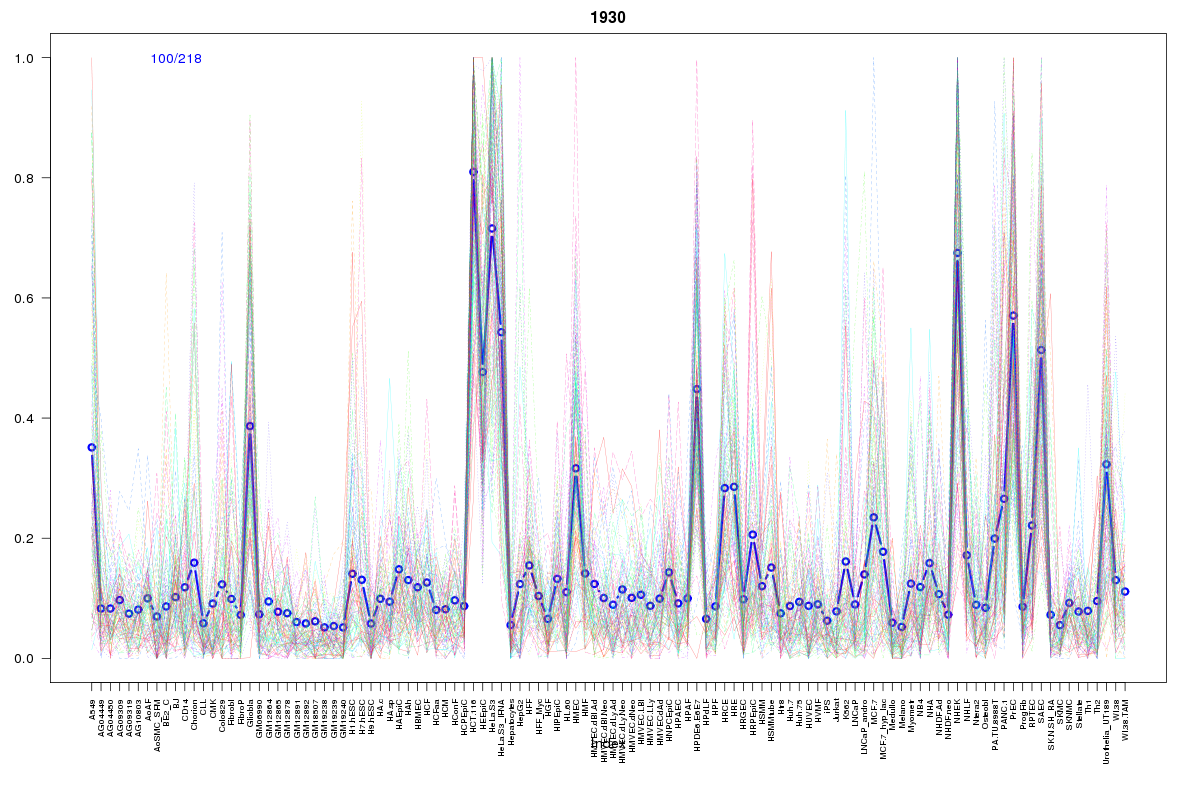 | 1930 | 1 |
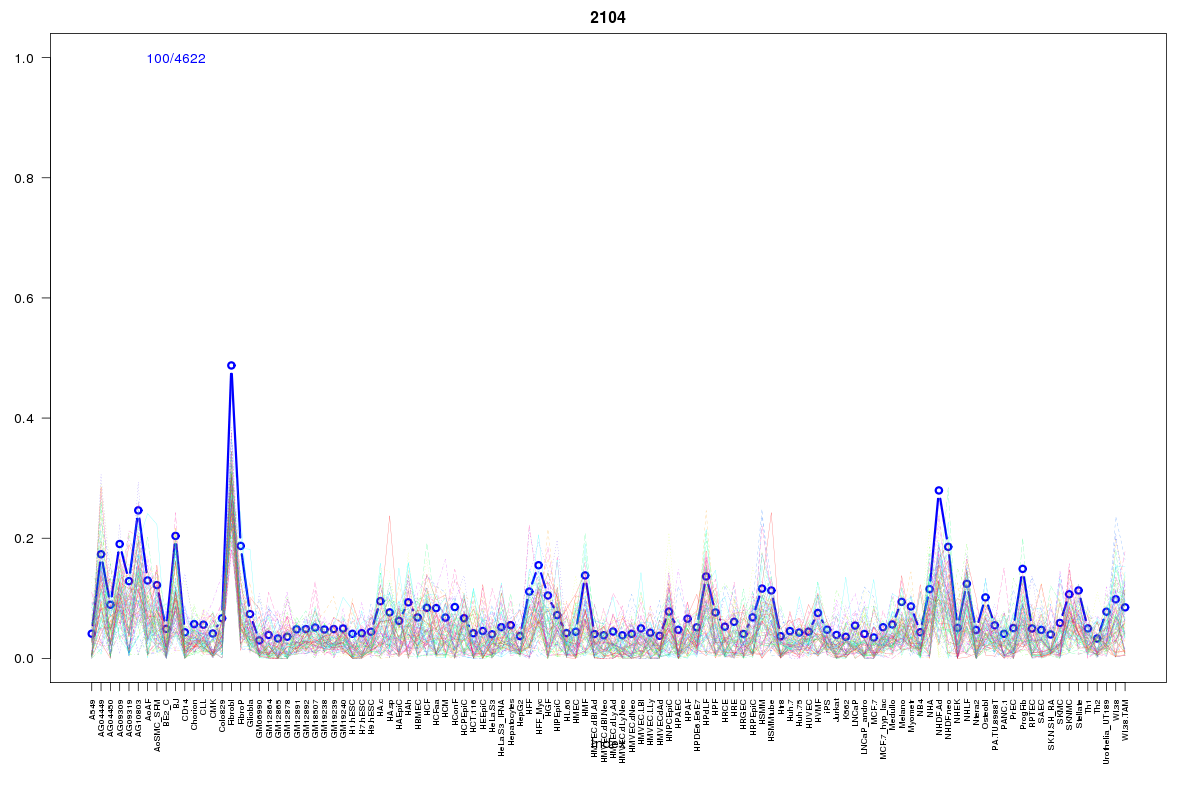 | 2104 | 1 |
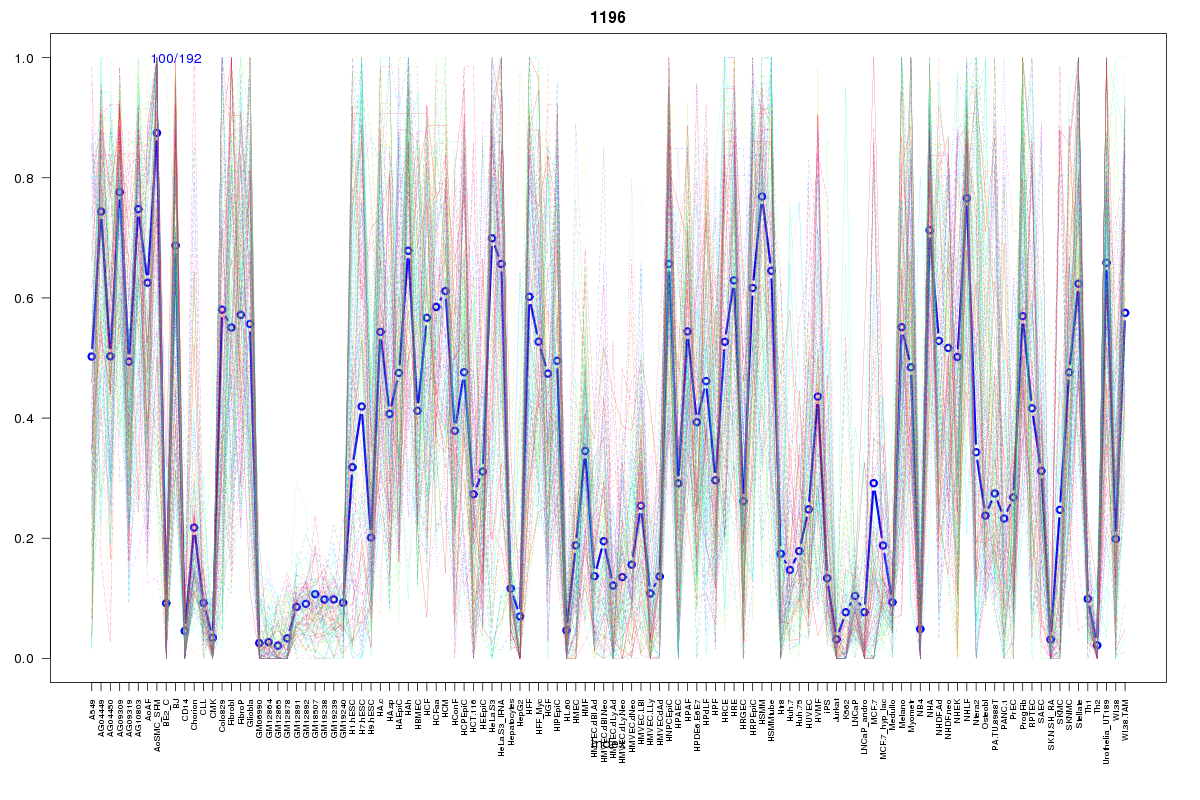 | 1196 | 1 |
 | 1143 | 1 |
 | 1078 | 1 |
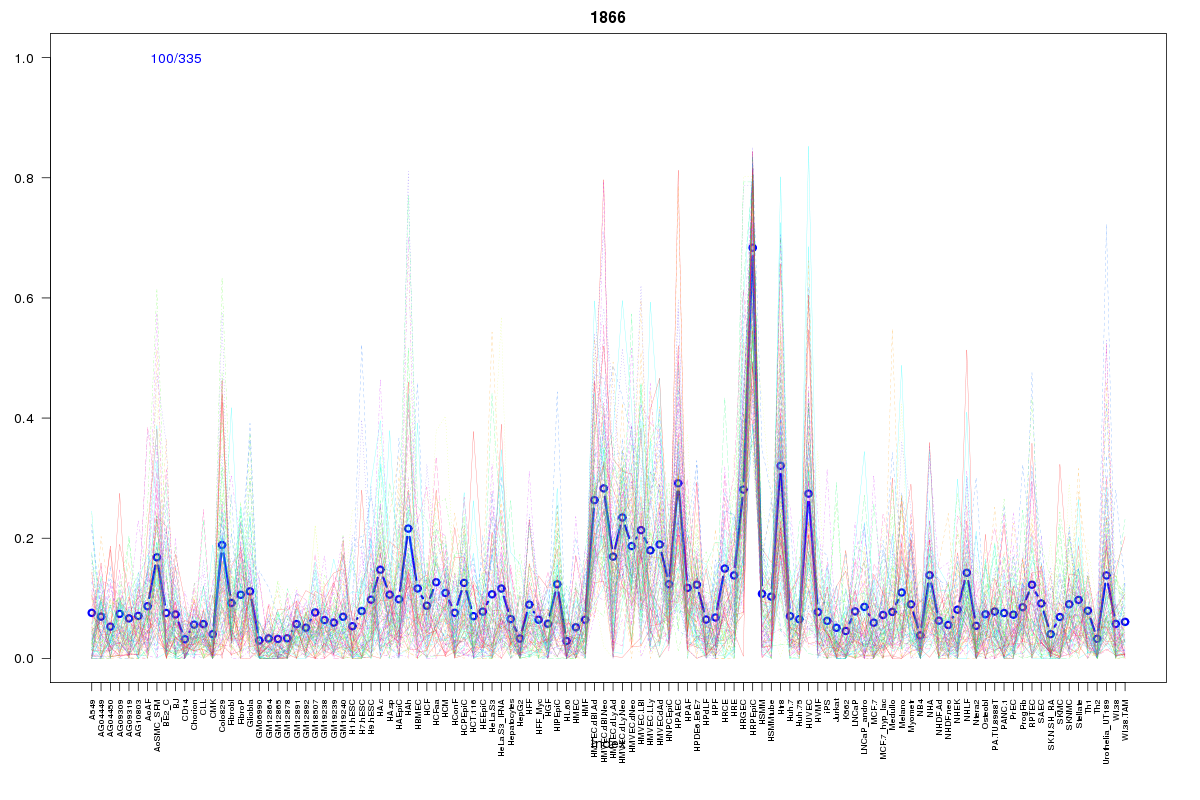 | 1866 | 1 |
 | 1079 | 1 |
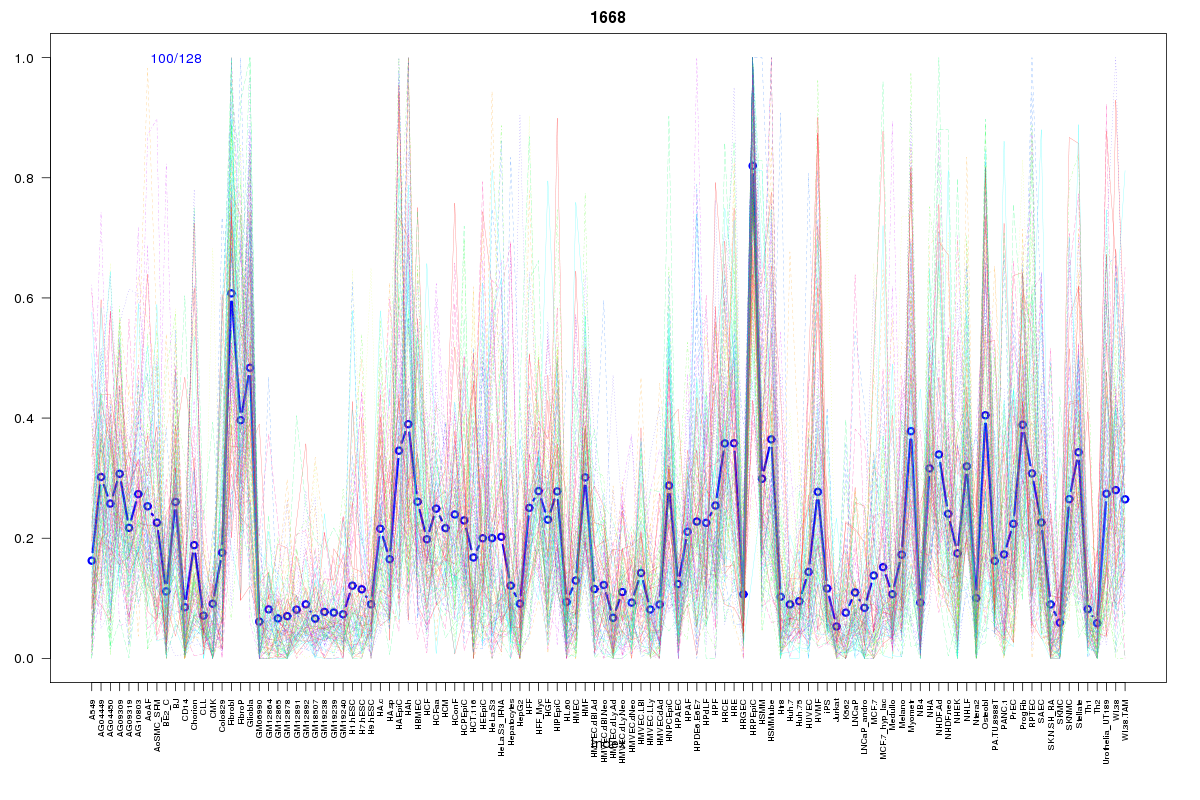 | 1668 | 1 |
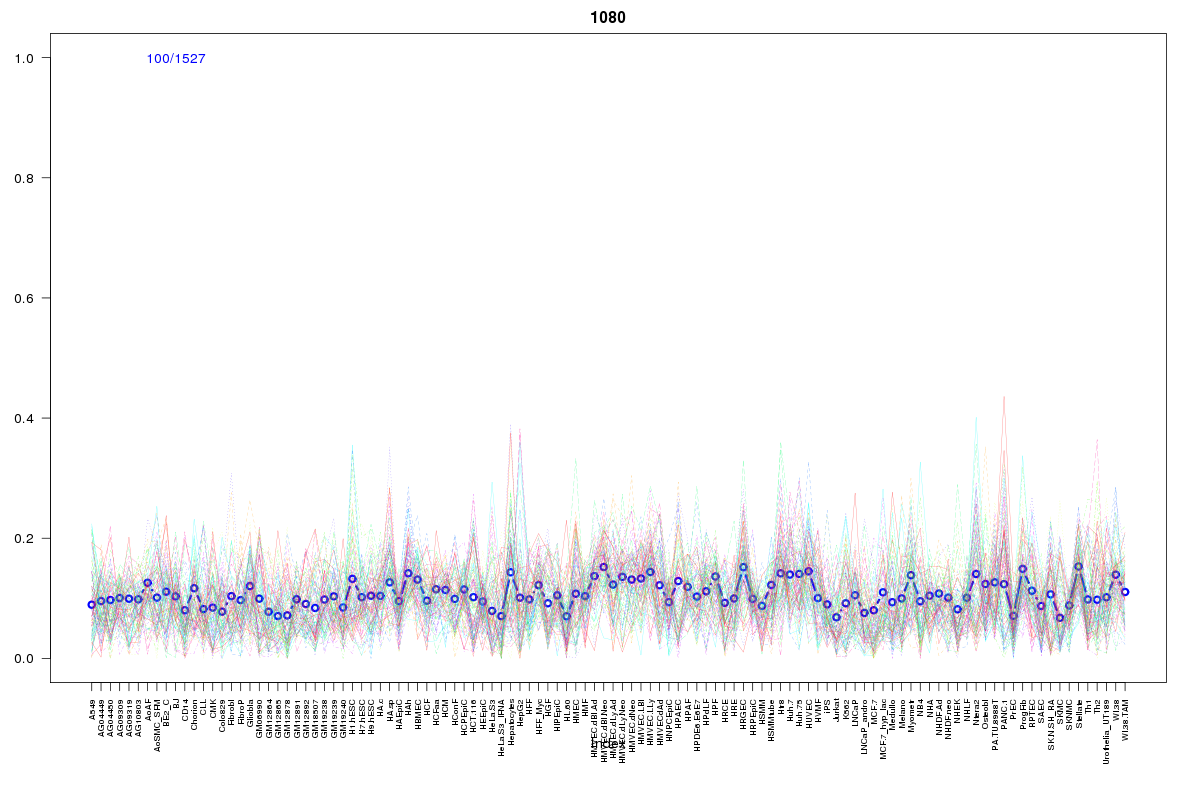 | 1080 | 1 |
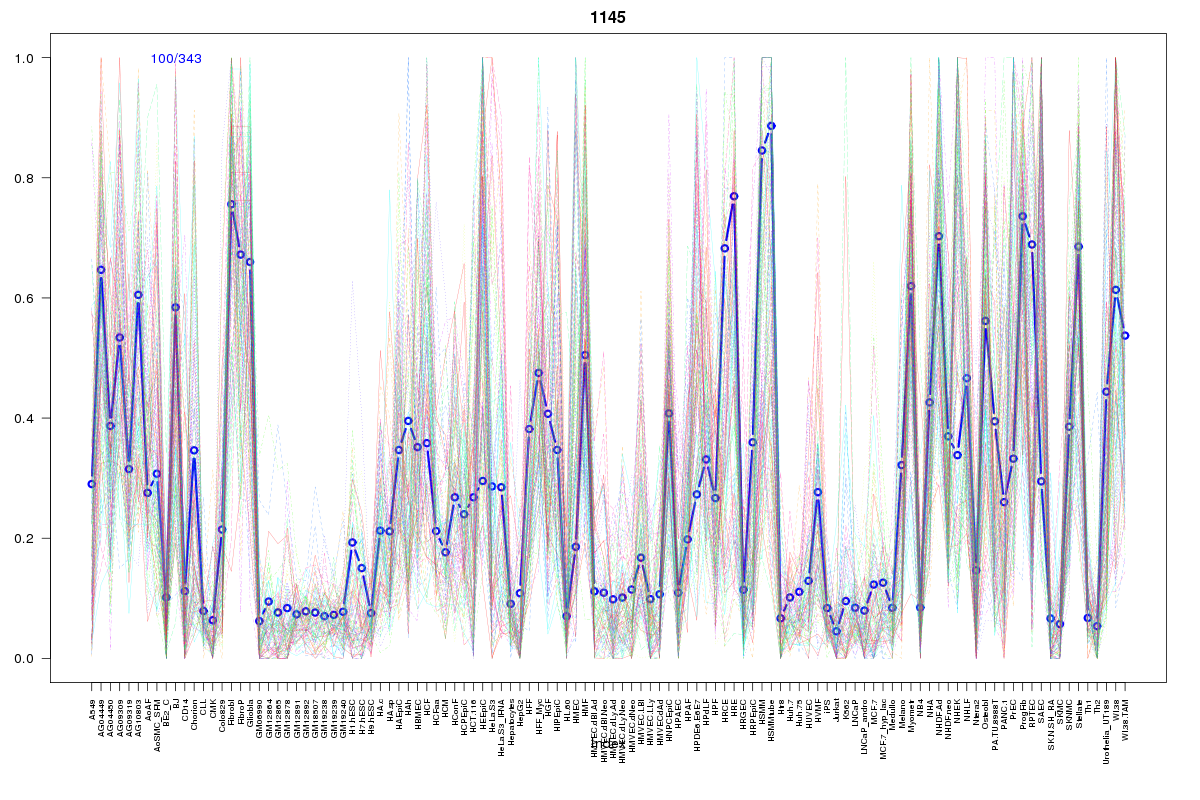 | 1145 | 1 |
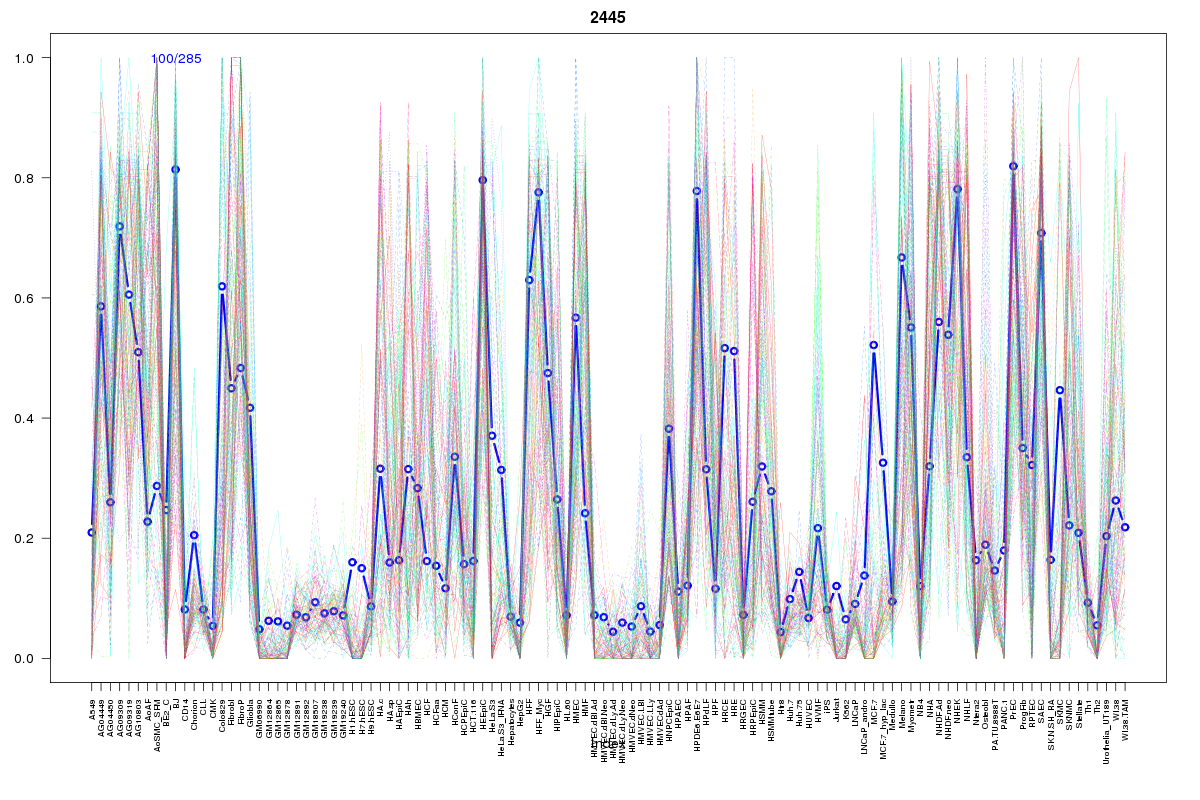 | 2445 | 1 |
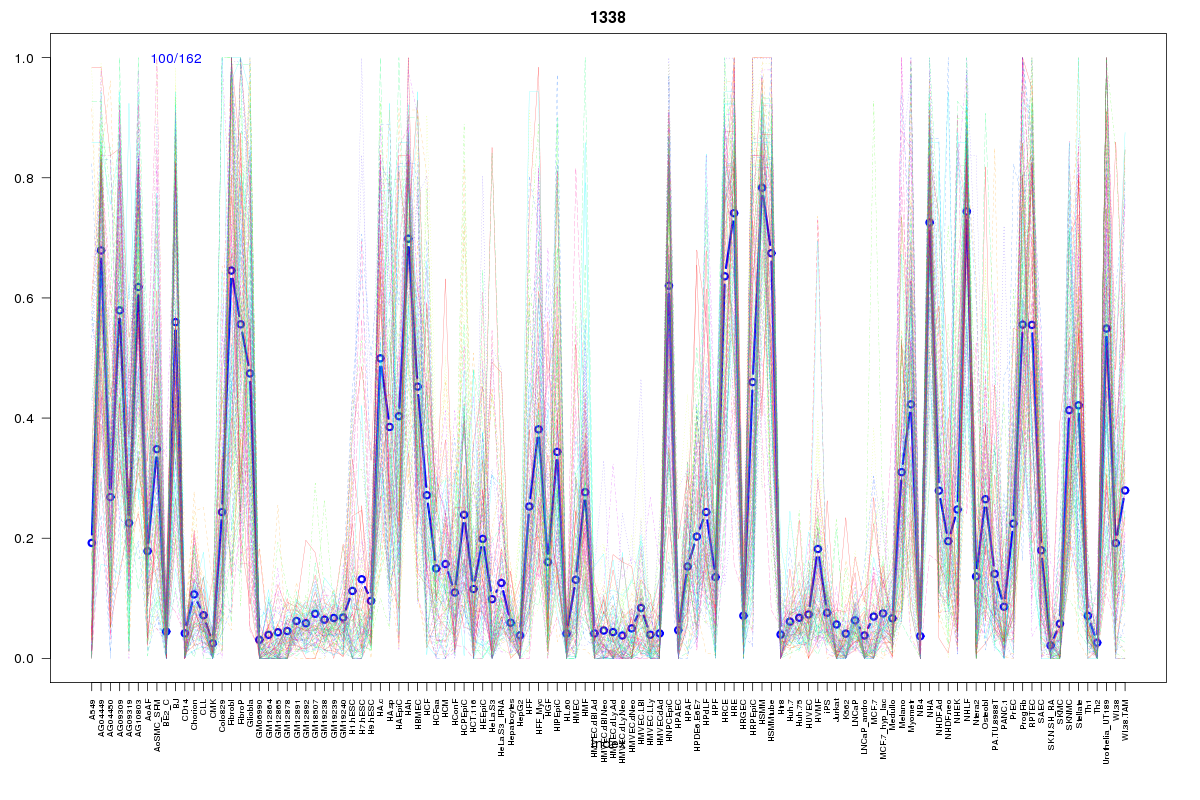 | 1338 | 1 |
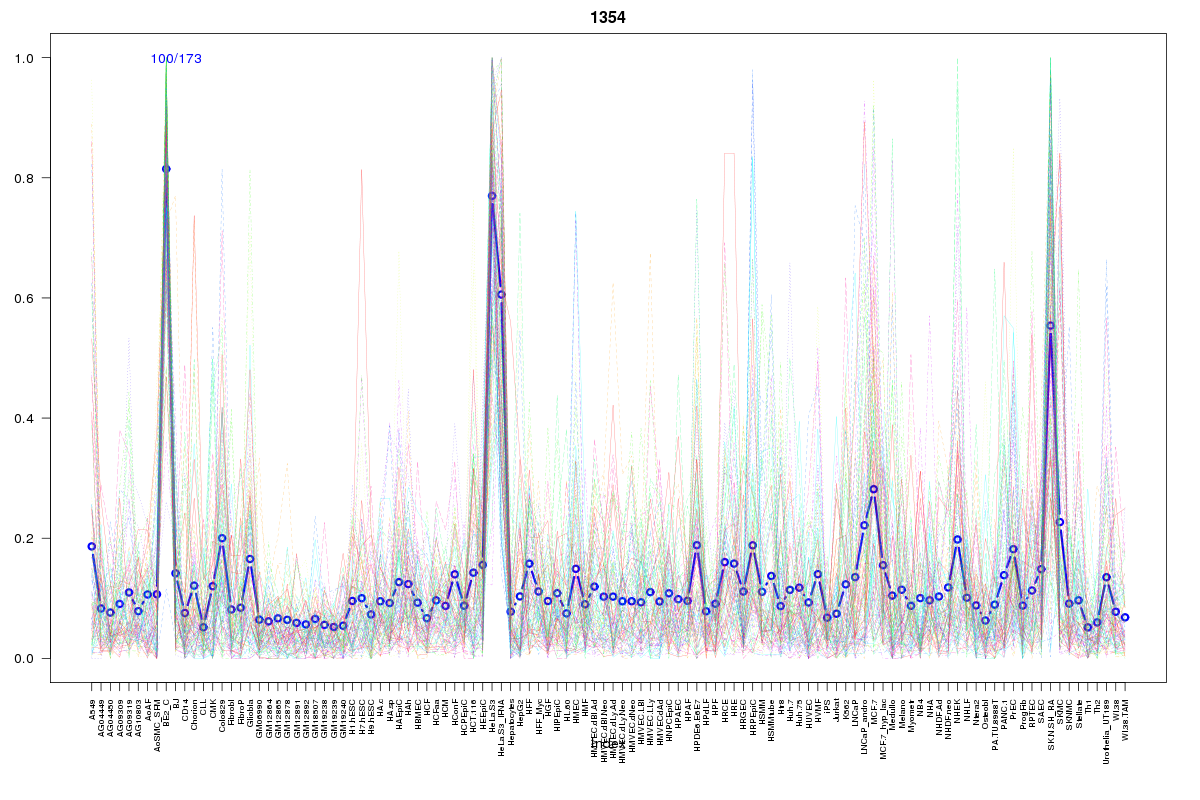 | 1354 | 1 |
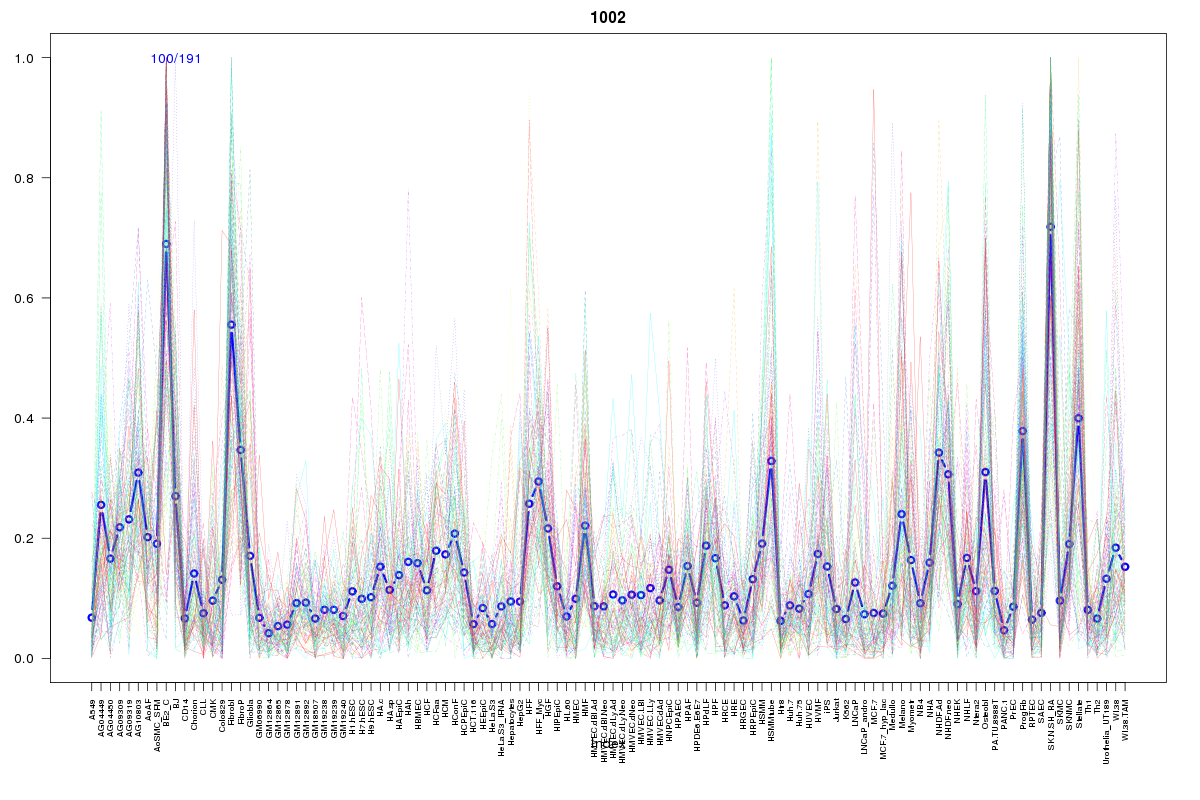 | 1002 | 1 |
Resources
BED file downloads
Connects to 22 DHS sitesTop 10 Correlated DHS Sites
p-values indiciate significant higher or lower correlation| Location | Cluster | P-value |
|---|---|---|
| chr9:132880460-132880610 | 1145 | 0.001 |
| chr9:132949565-132949715 | 1143 | 0.001 |
| chr9:132901240-132901390 | 596 | 0.001 |
| chr9:132900520-132900670 | 548 | 0.001 |
| chr9:132880140-132880290 | 1668 | 0.002 |
| chr9:132945620-132945770 | 1196 | 0.002 |
| chr9:132961685-132961835 | 1080 | 0.006 |
| chr9:132901025-132901175 | 2293 | 0.007 |
| chr9:133038560-133038710 | 1338 | 0.007 |
| chr9:132881120-132881270 | 1676 | 0.008 |
| chr9:132913200-132913350 | 1930 | 0.01 |
External Databases
UCSCEnsembl (ENSG00000107130)