Gene: GNAI2
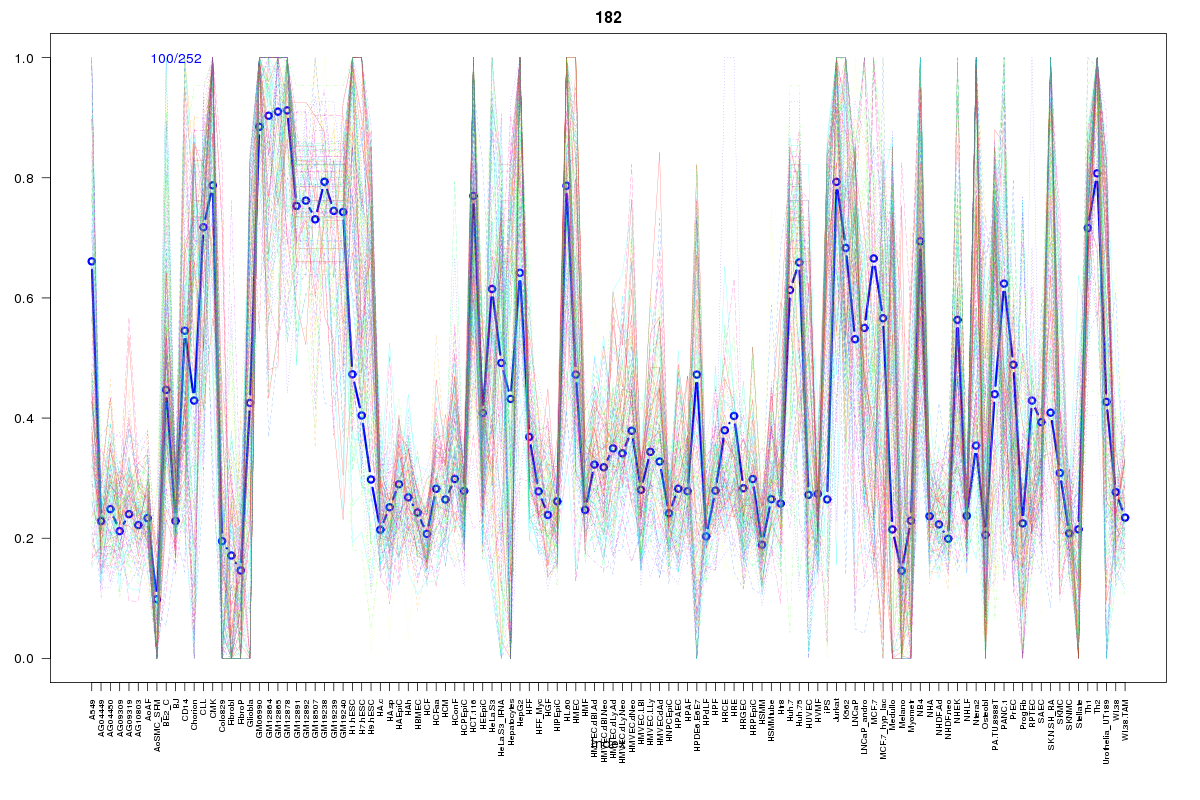
chr3: 50263723-50296330Expression Profile
(log scale)
Graphical Connections
Distribution of linked clusters:
You may find it interesting if many of the connected DHS sites belong to the same cluster.| Cluster Profile | Cluster ID | Number of DHS sites in this cluster |
|---|---|---|
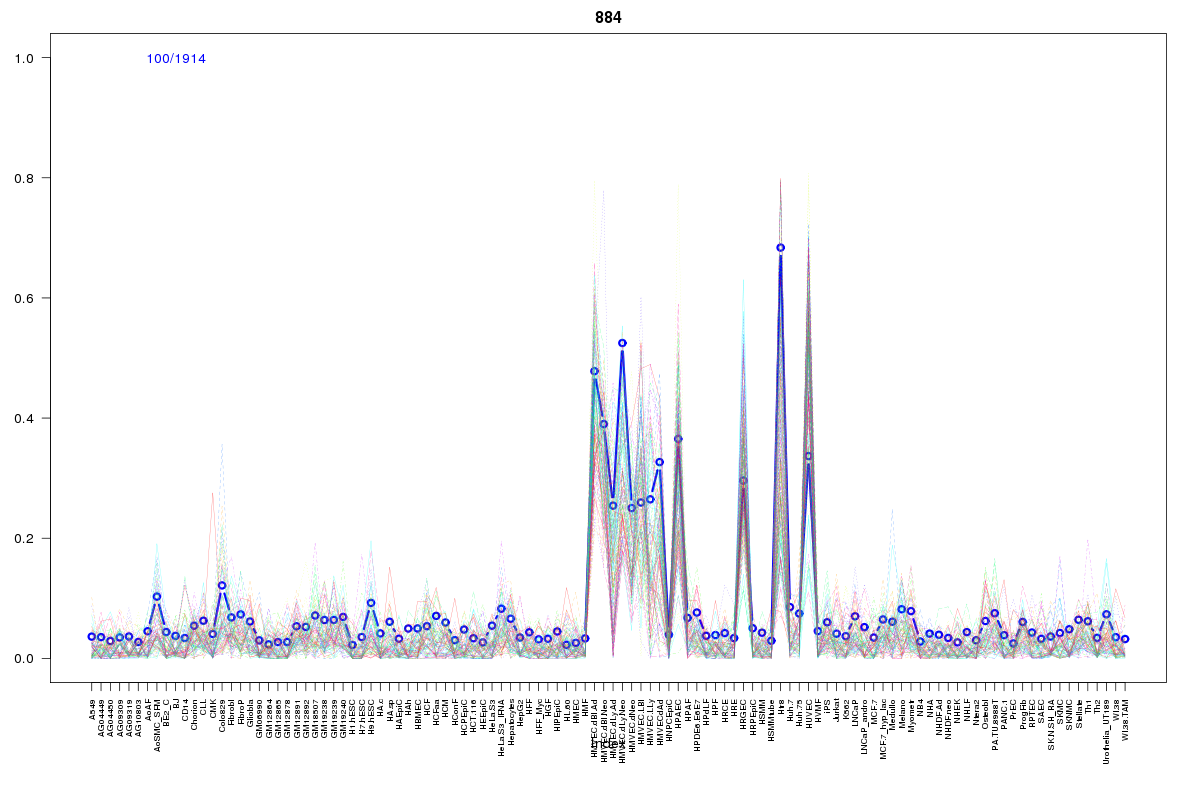 | 884 | 2 |
 | 739 | 2 |
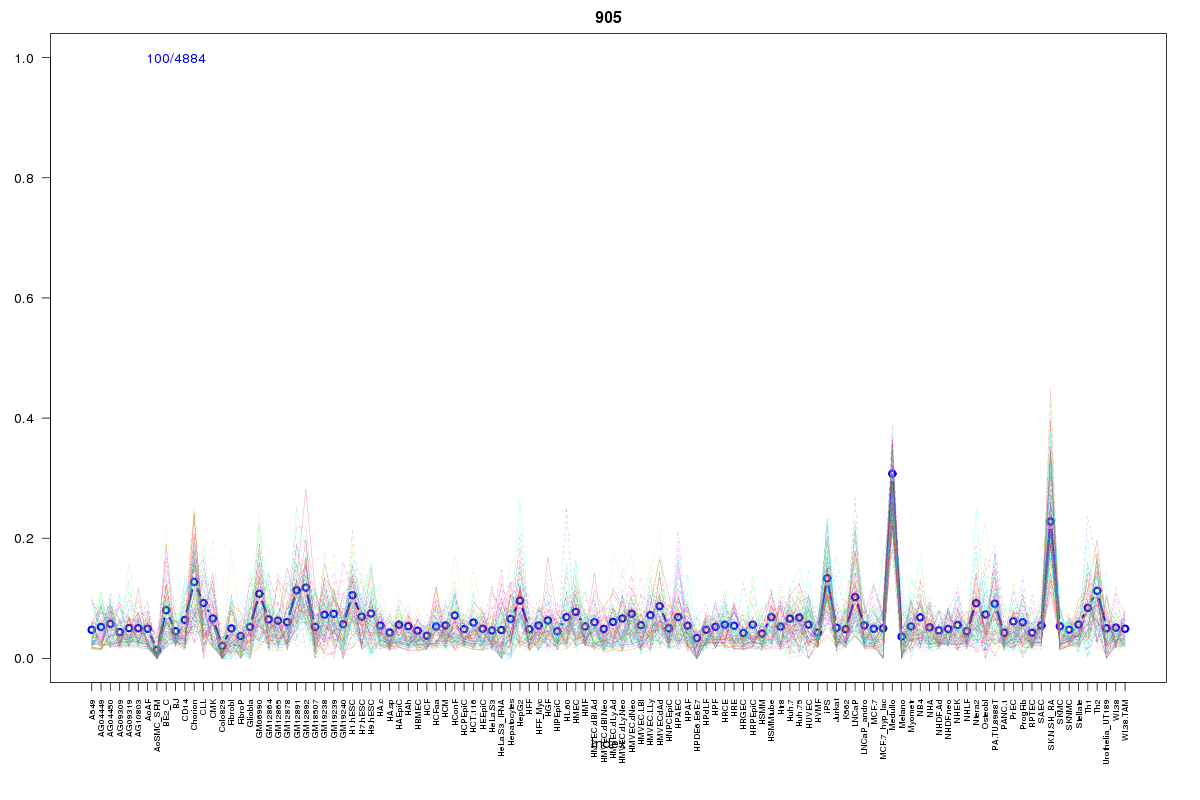 | 905 | 2 |
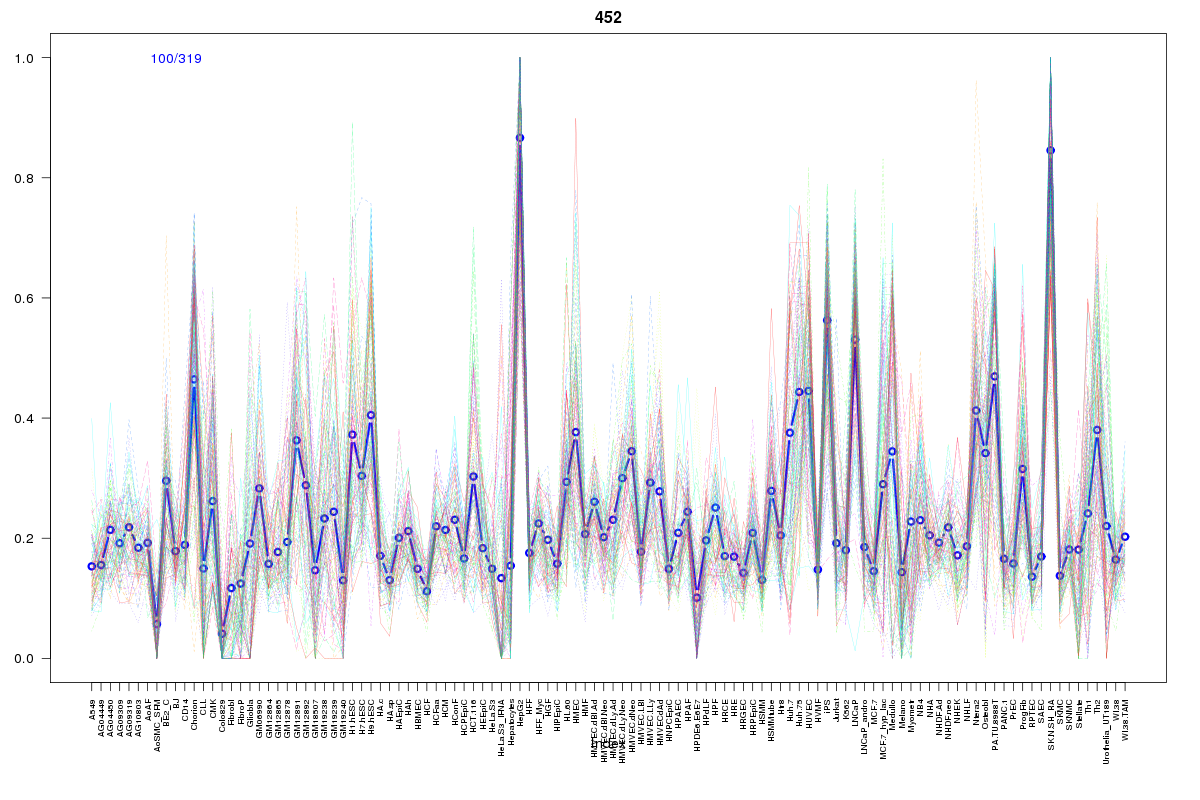 | 452 | 1 |
 | 2143 | 1 |
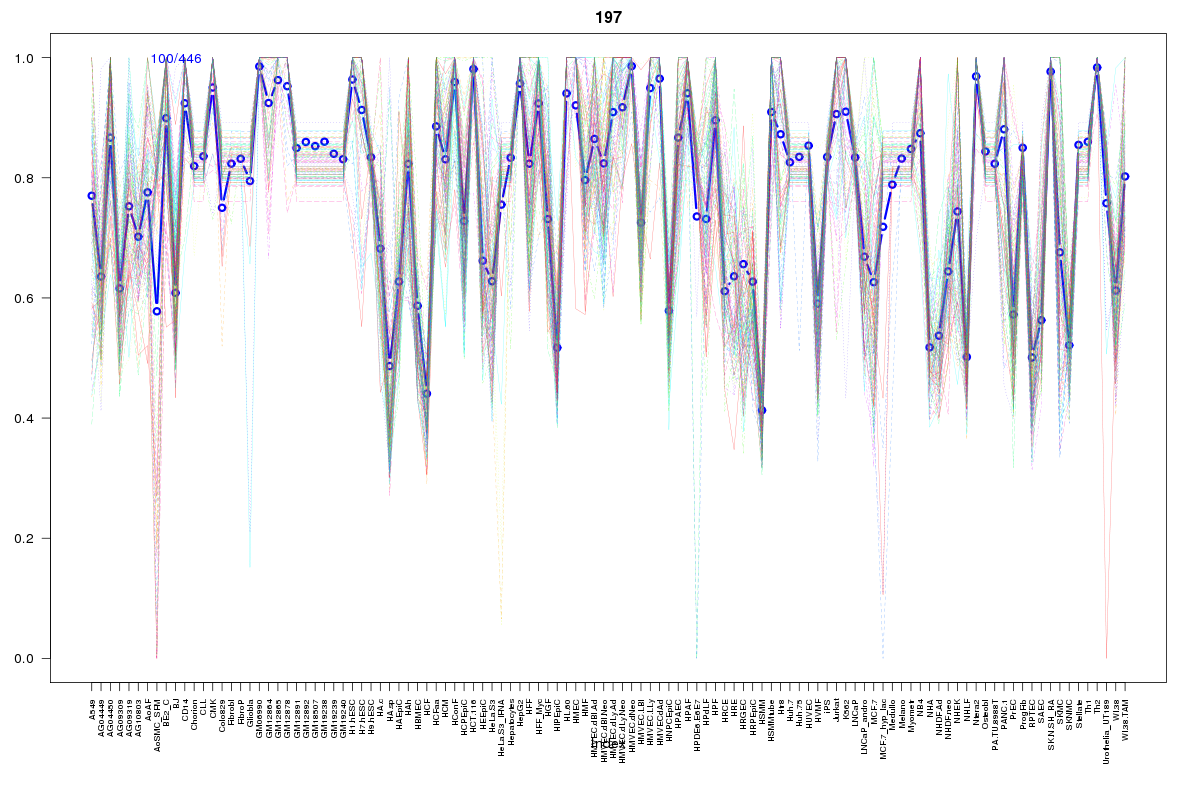 | 197 | 1 |
 | 1584 | 1 |
 | 615 | 1 |
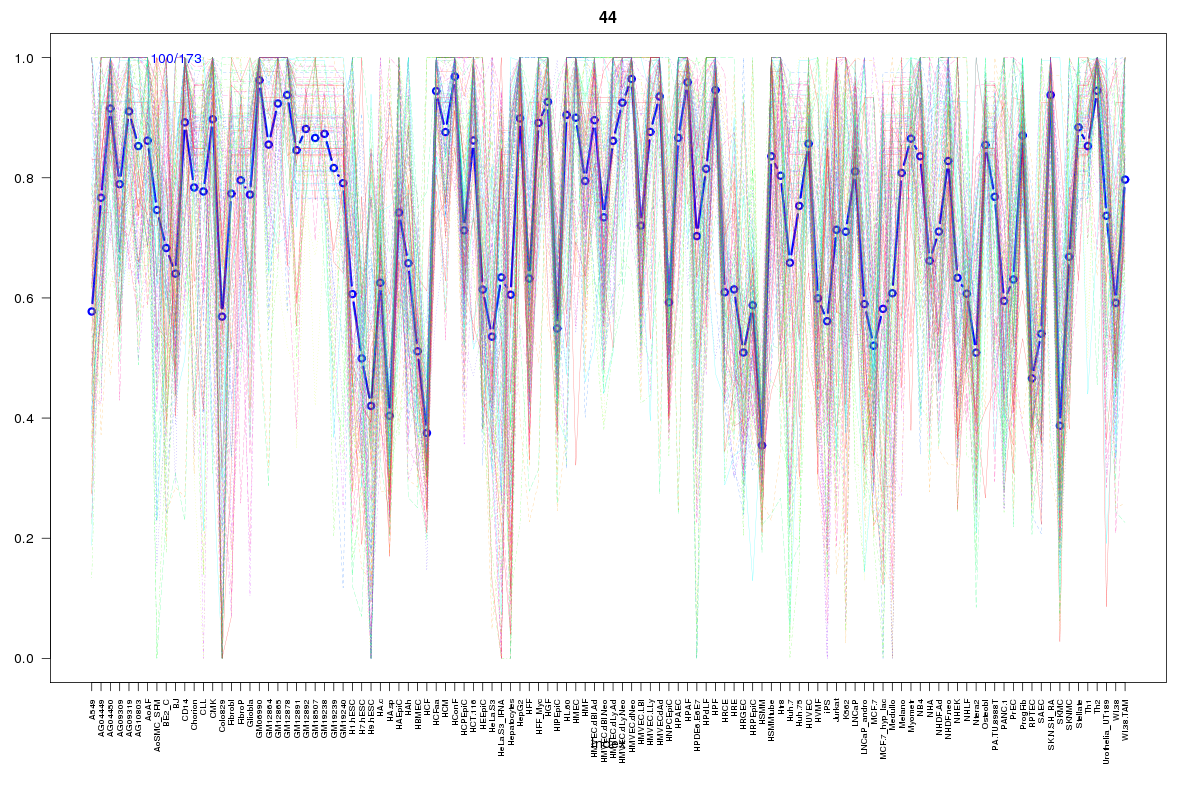 | 44 | 1 |
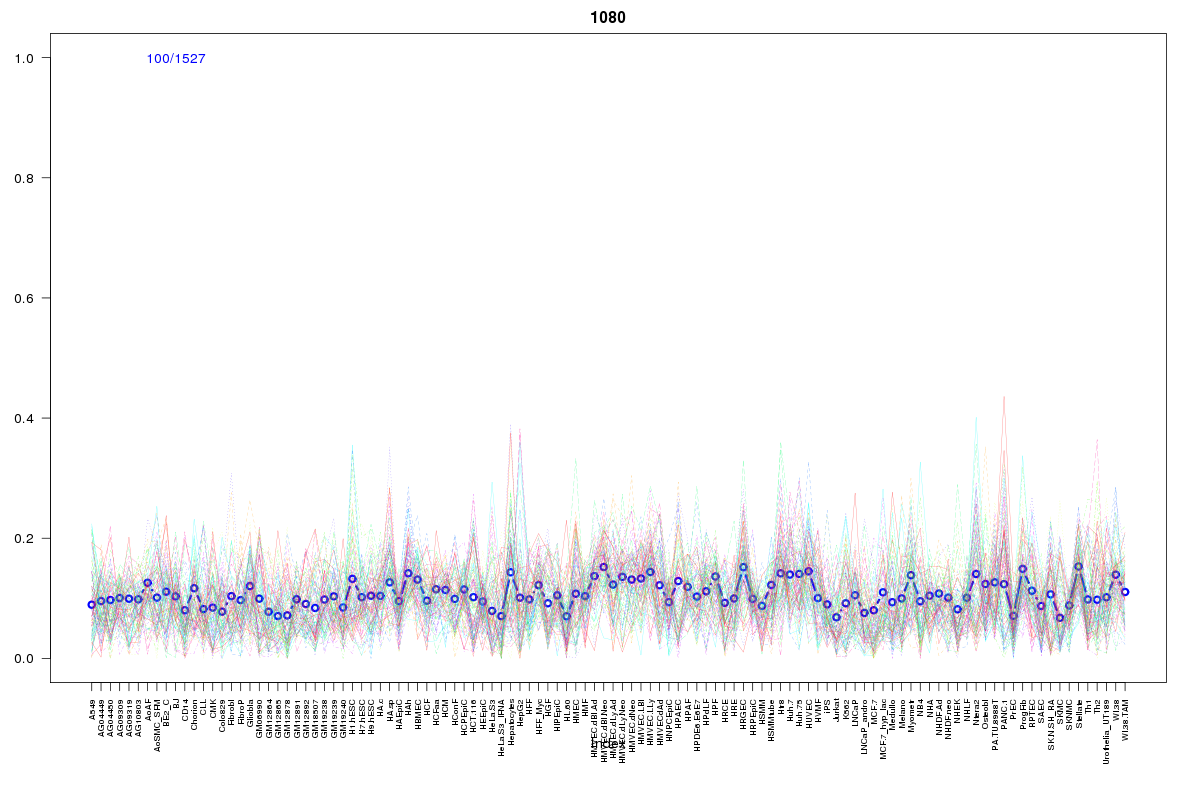 | 1080 | 1 |
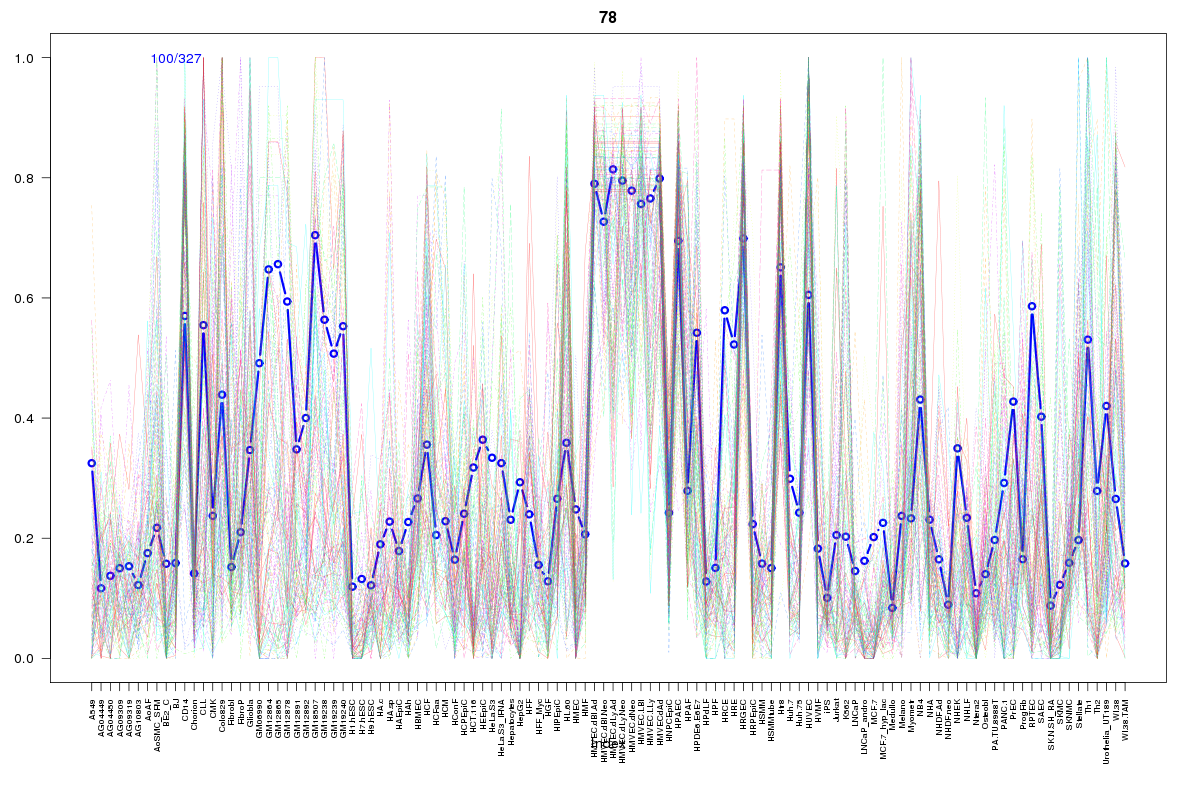 | 78 | 1 |
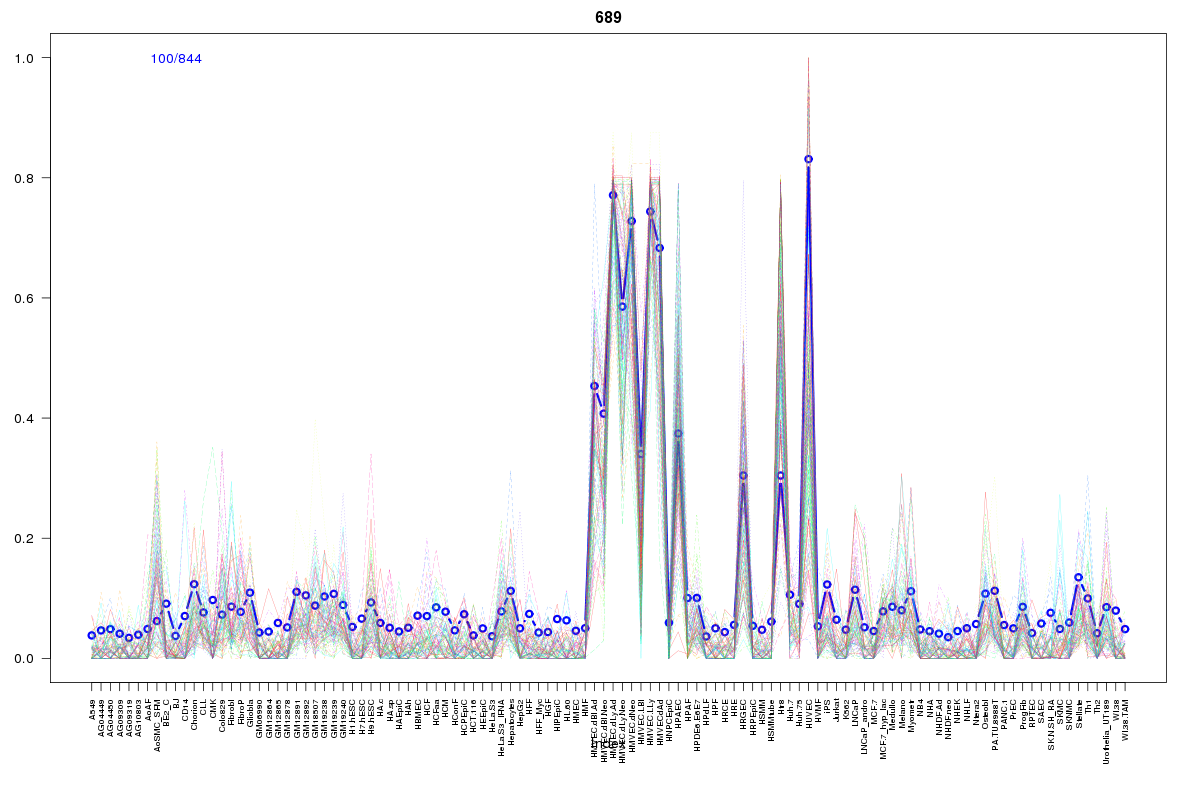 | 689 | 1 |
 | 979 | 1 |
 | 296 | 1 |
 | 935 | 1 |
 | 2391 | 1 |
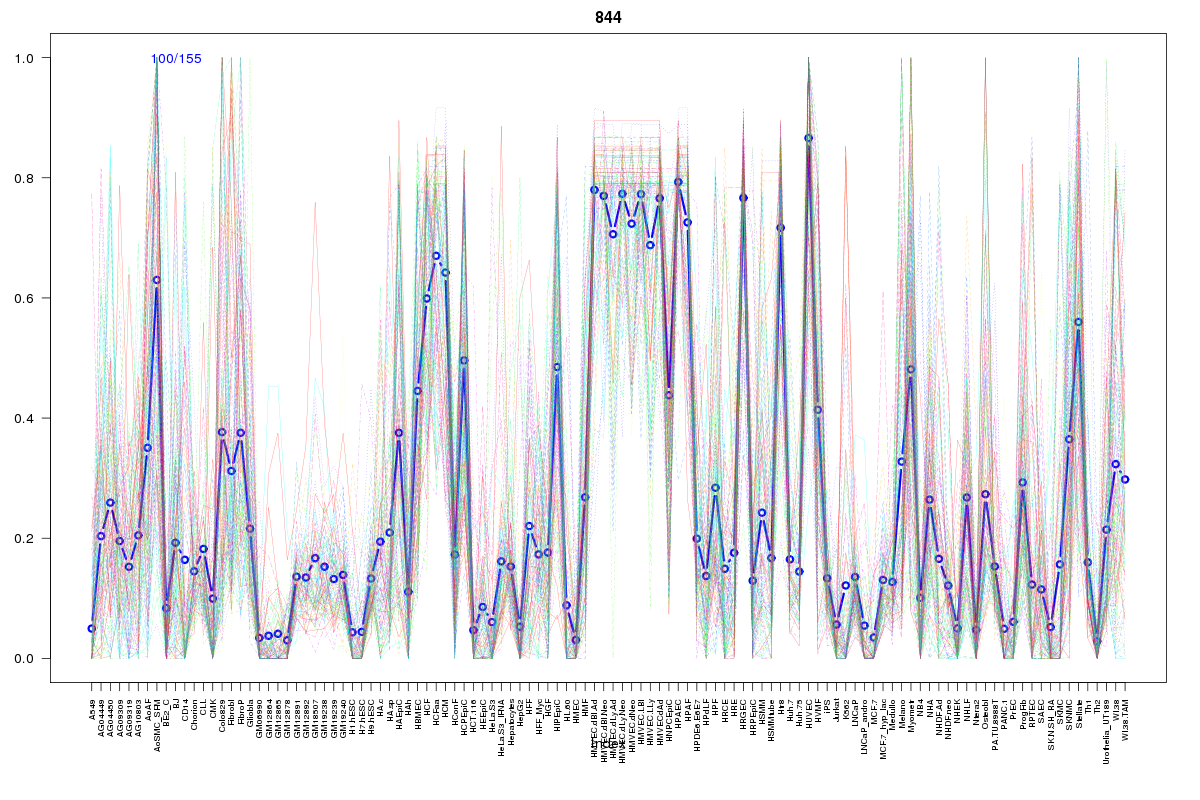 | 844 | 1 |
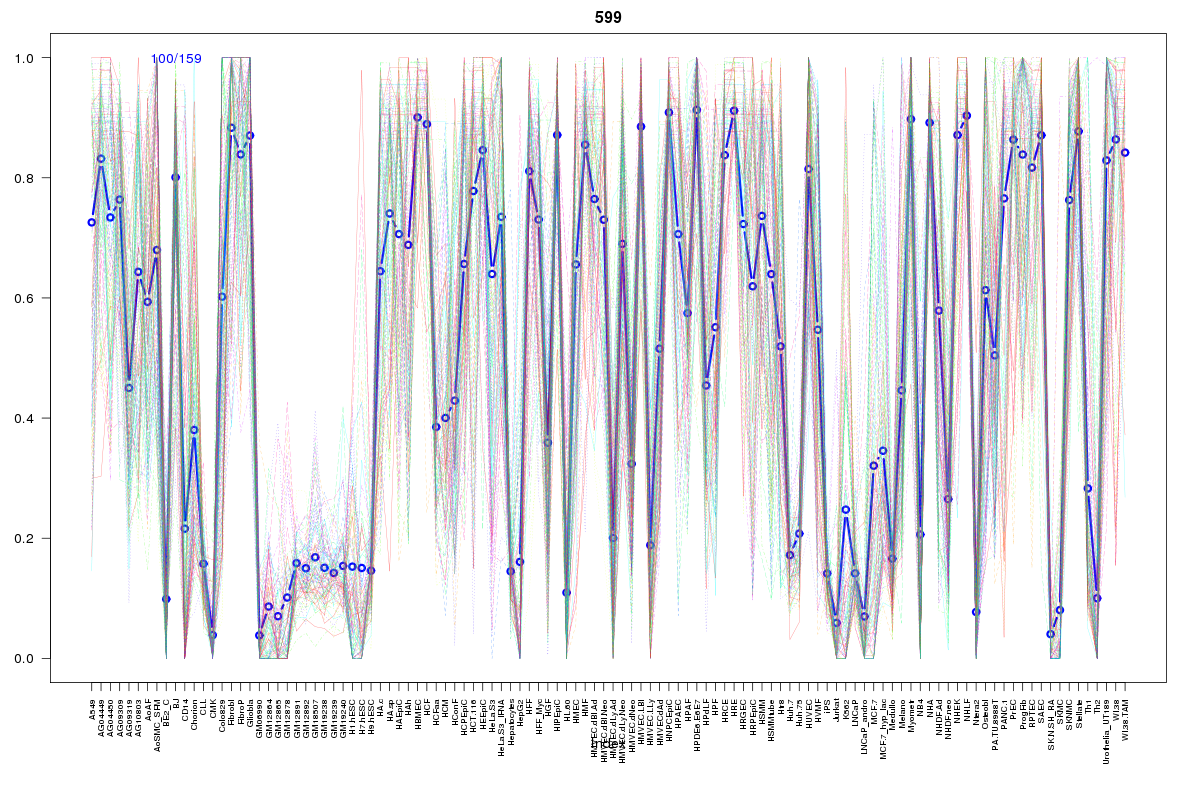 | 599 | 1 |
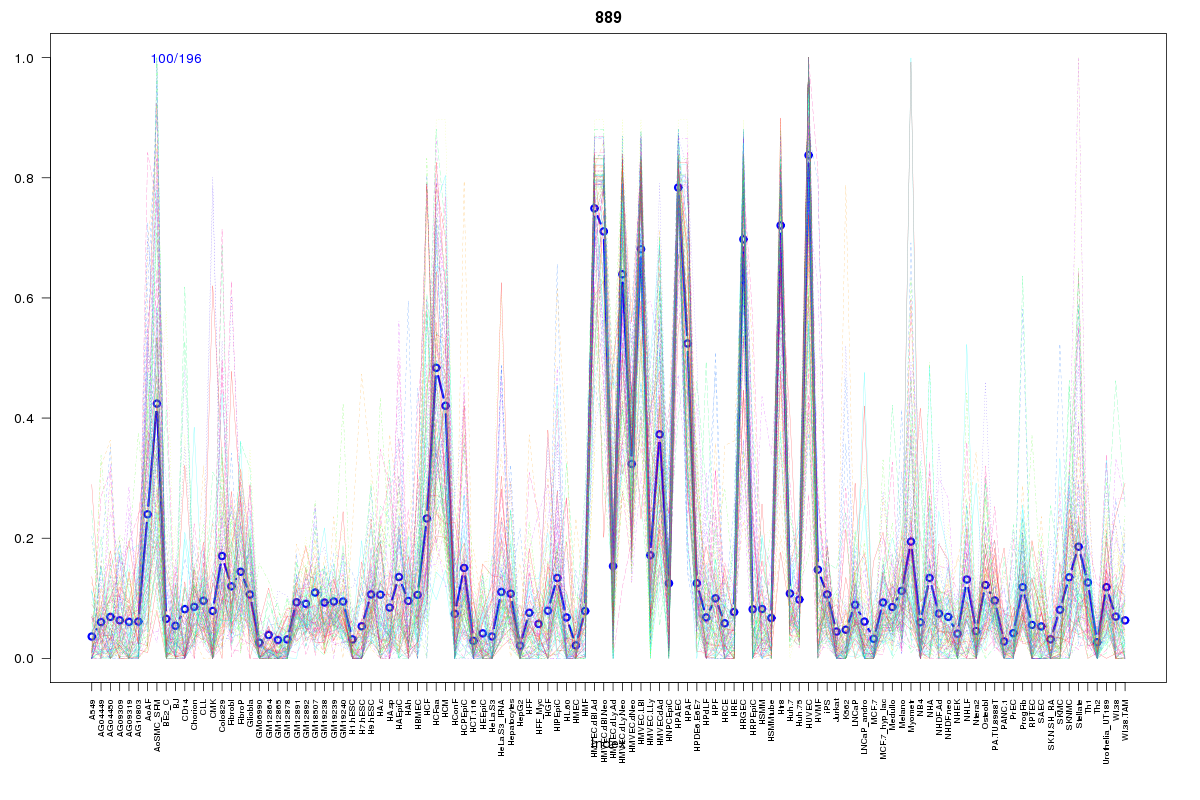 | 889 | 1 |
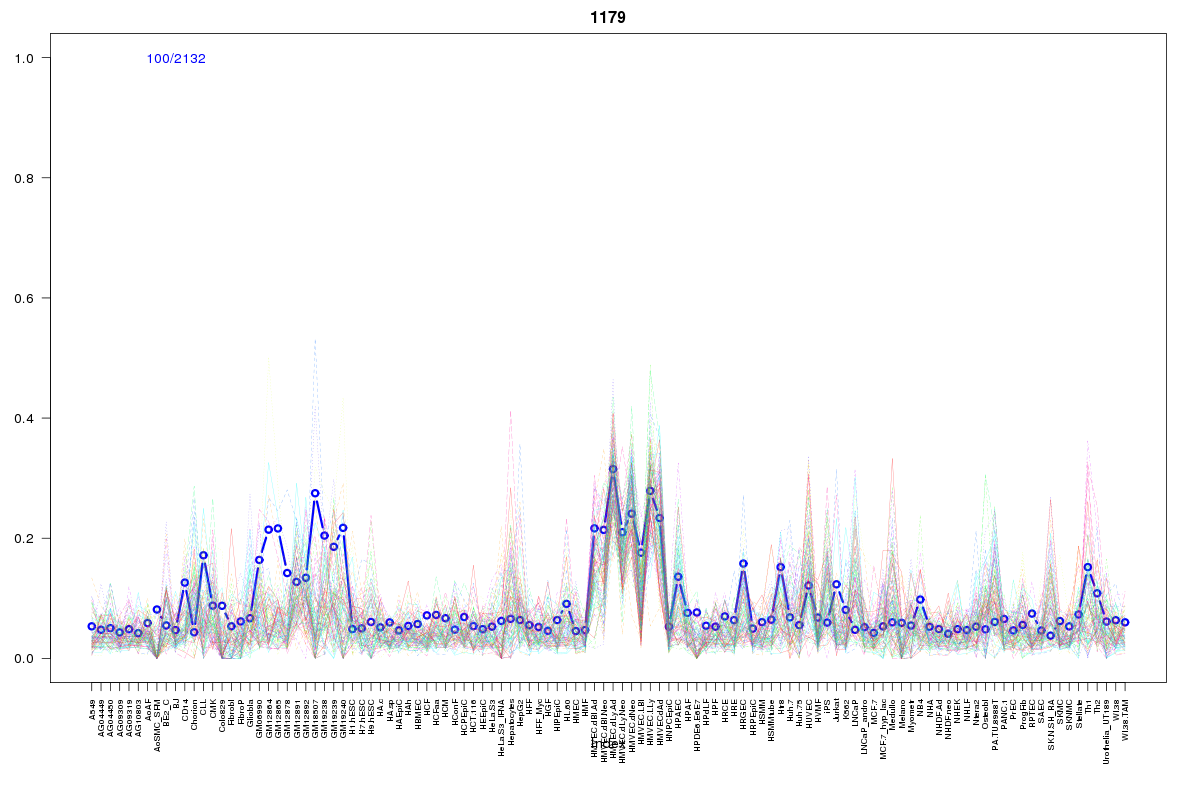 | 1179 | 1 |
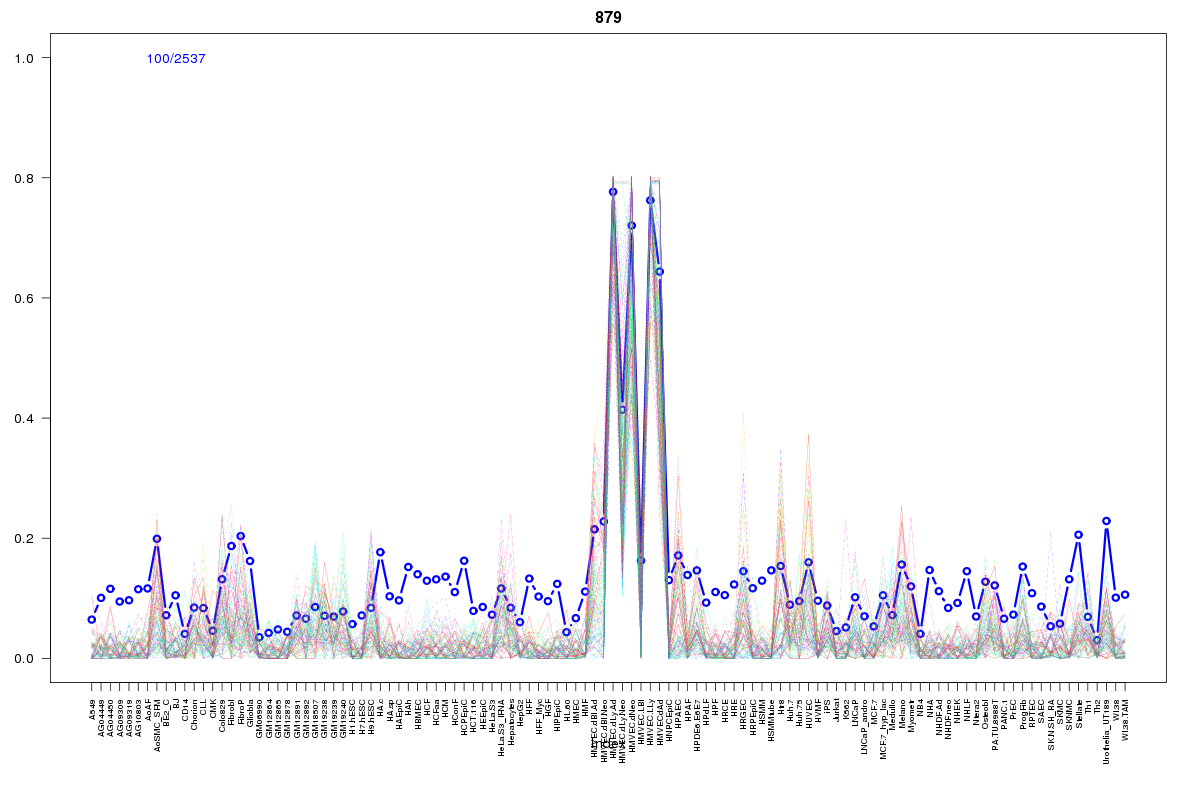 | 879 | 1 |
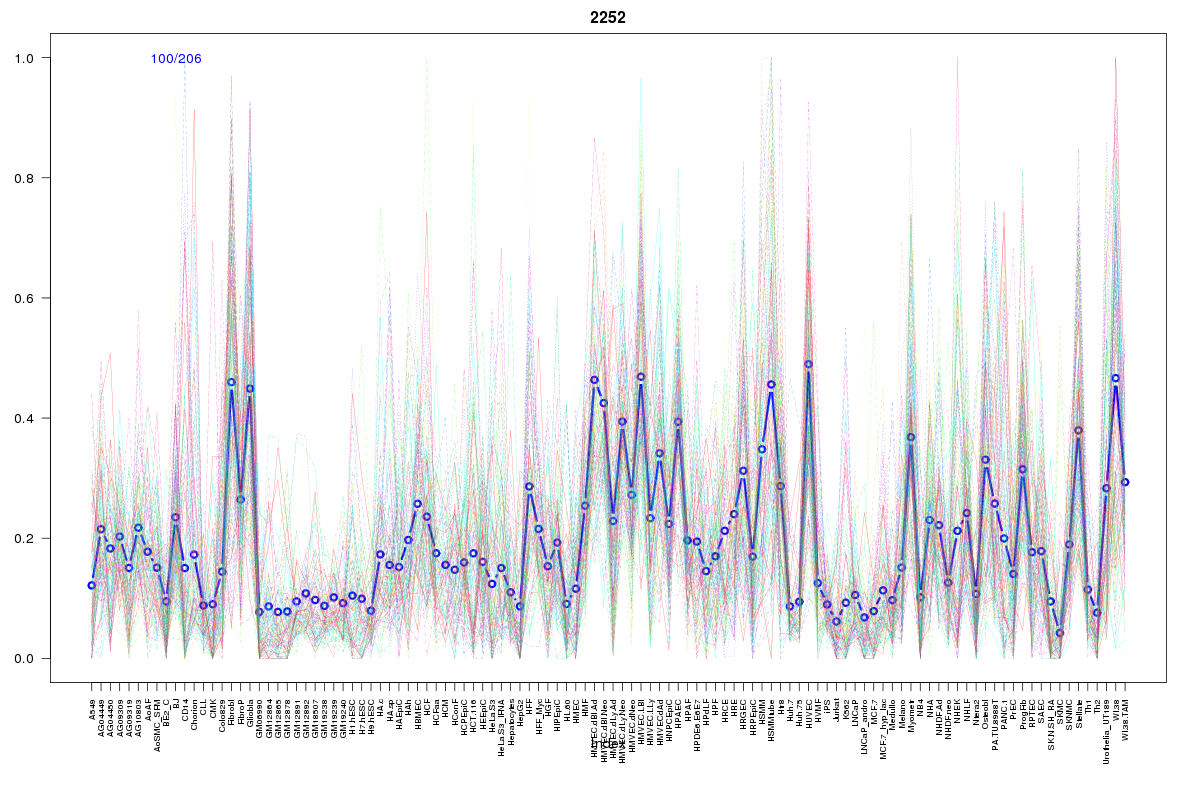 | 2252 | 1 |
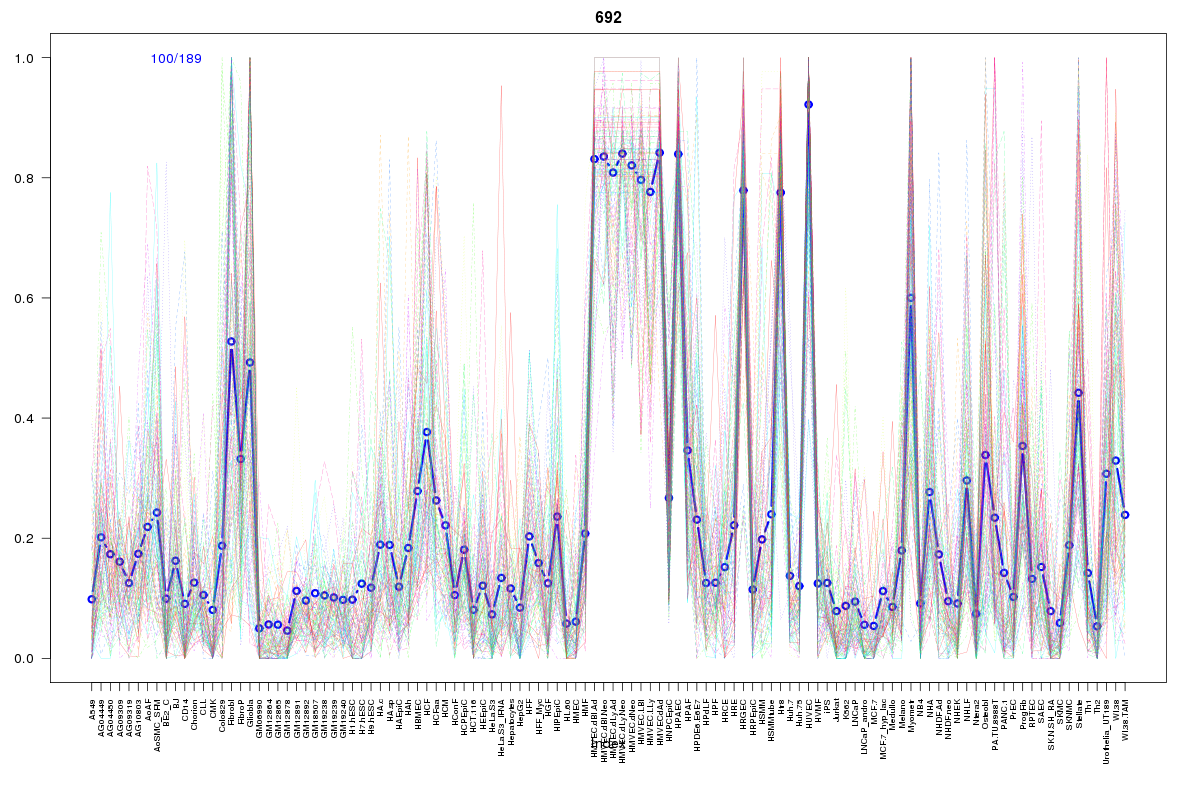 | 692 | 1 |
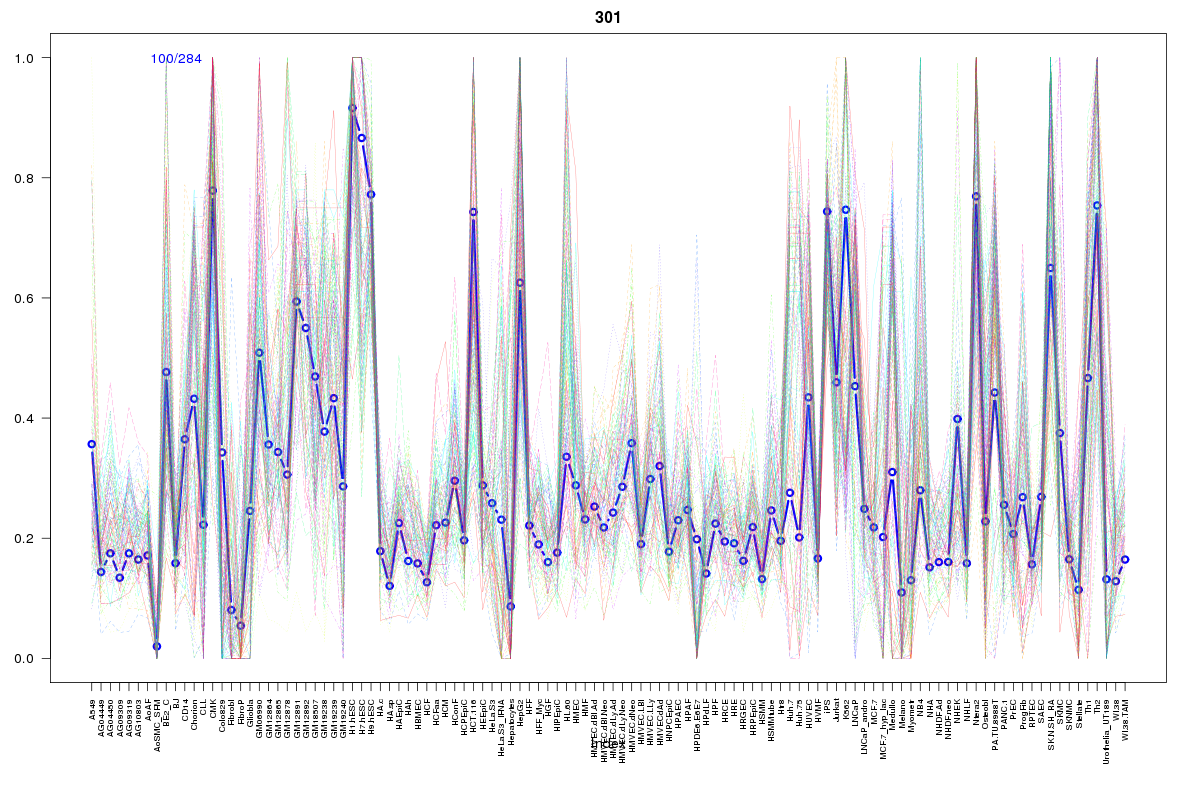 | 301 | 1 |
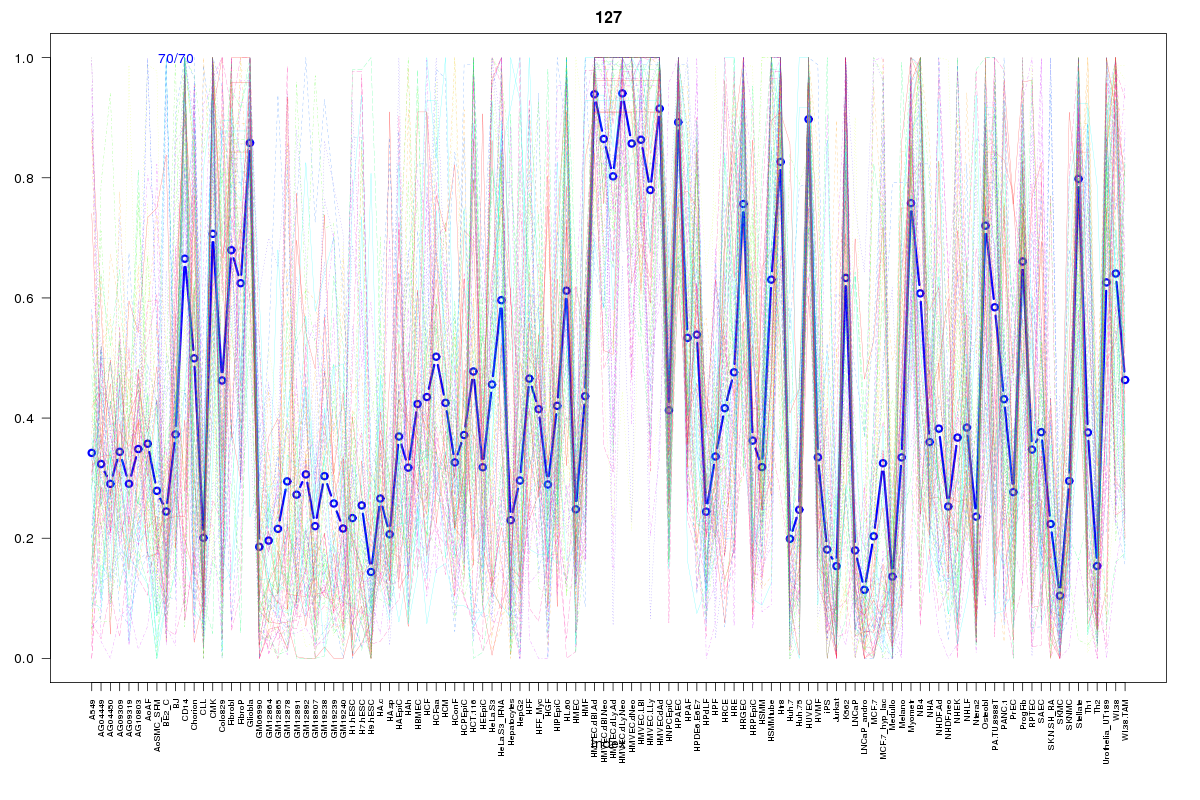 | 127 | 1 |
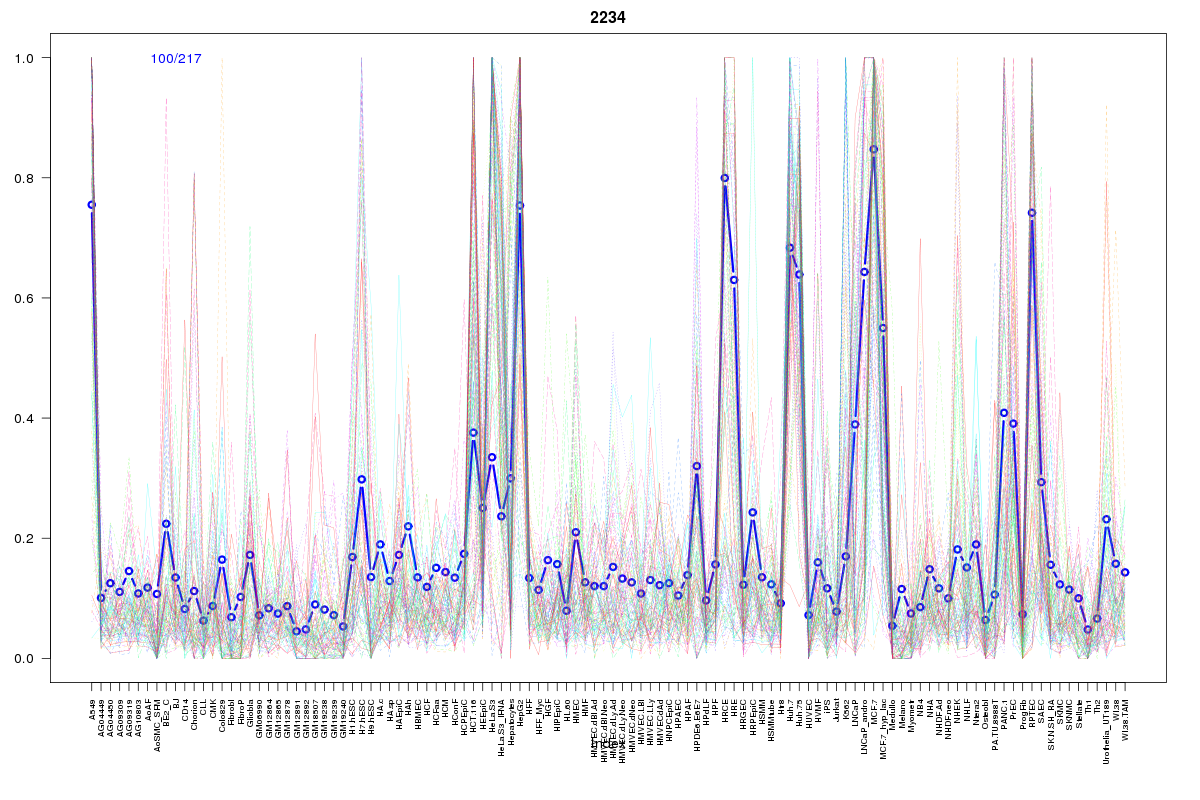 | 2234 | 1 |
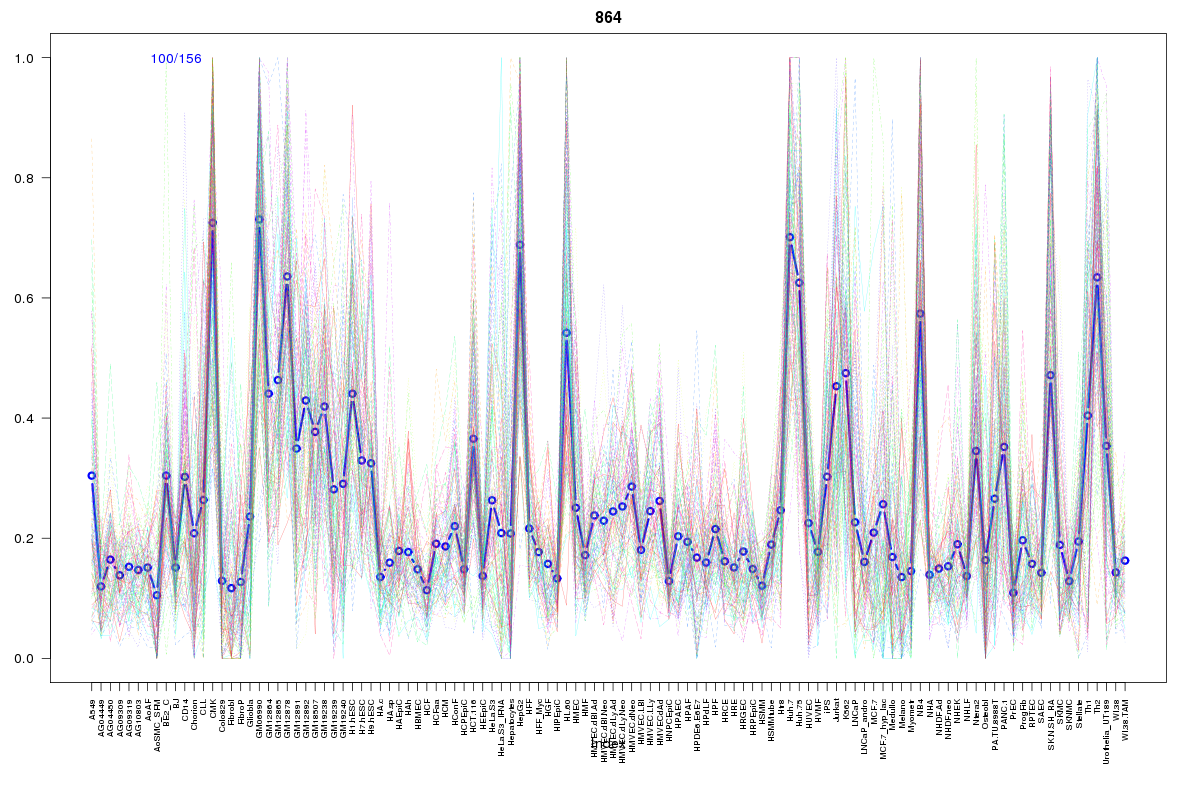 | 864 | 1 |
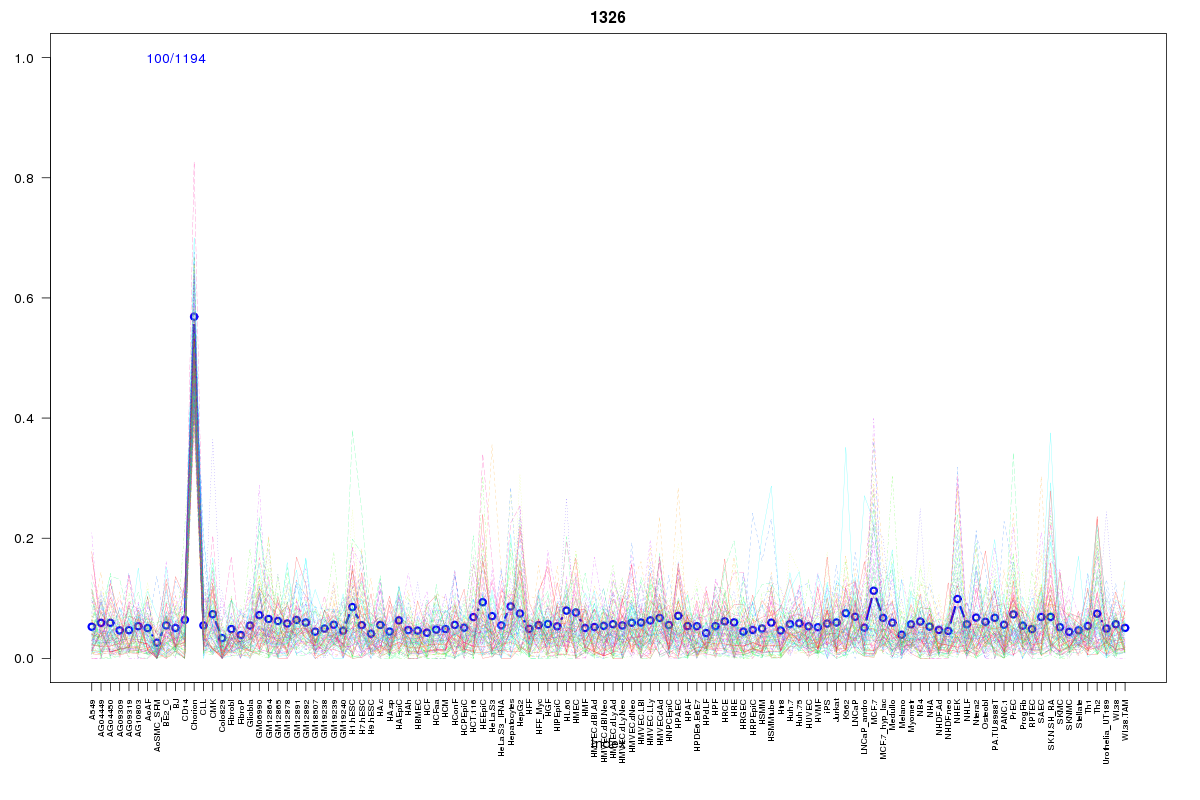 | 1326 | 1 |
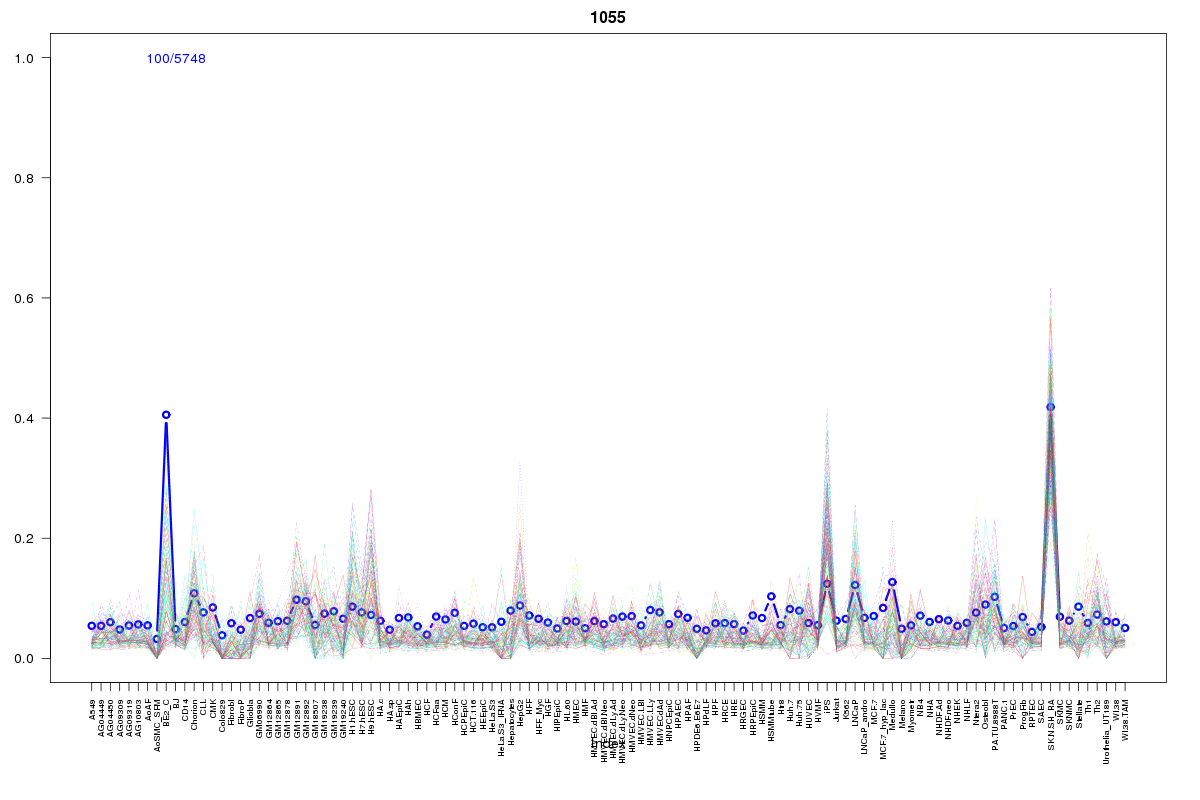 | 1055 | 1 |
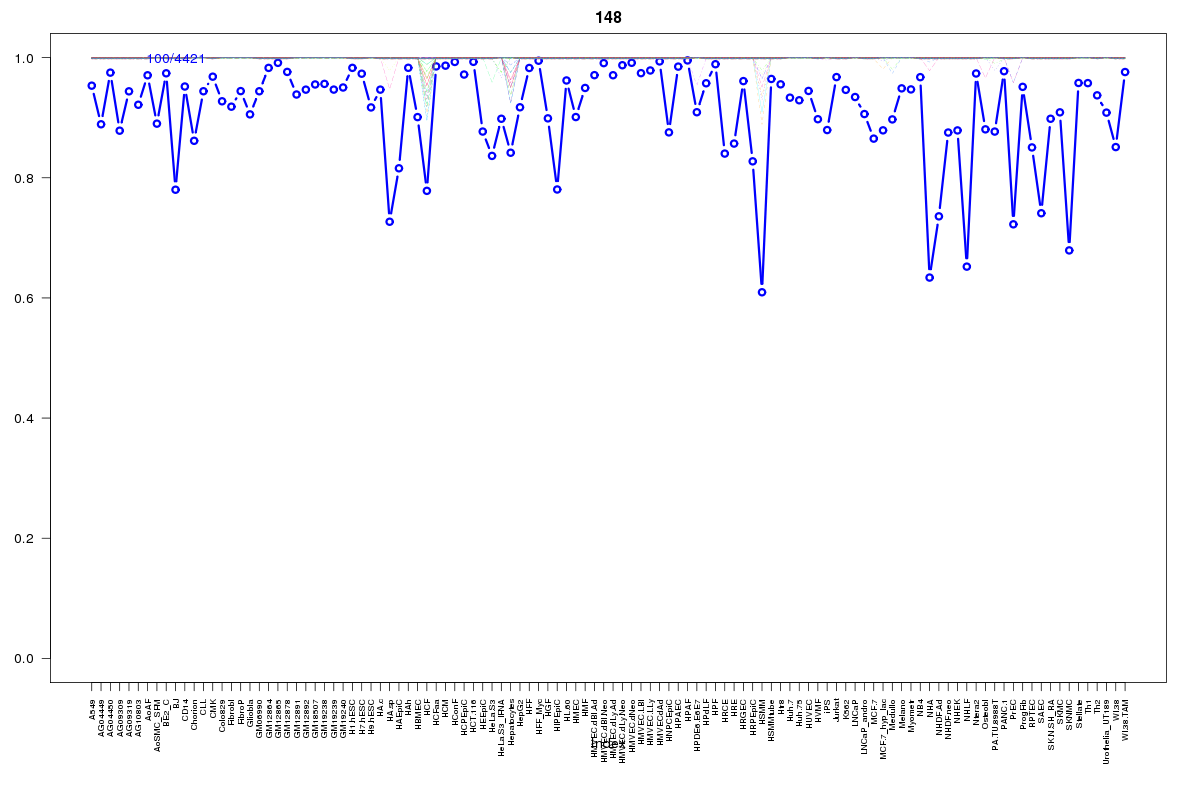 | 148 | 1 |
 | 1078 | 1 |
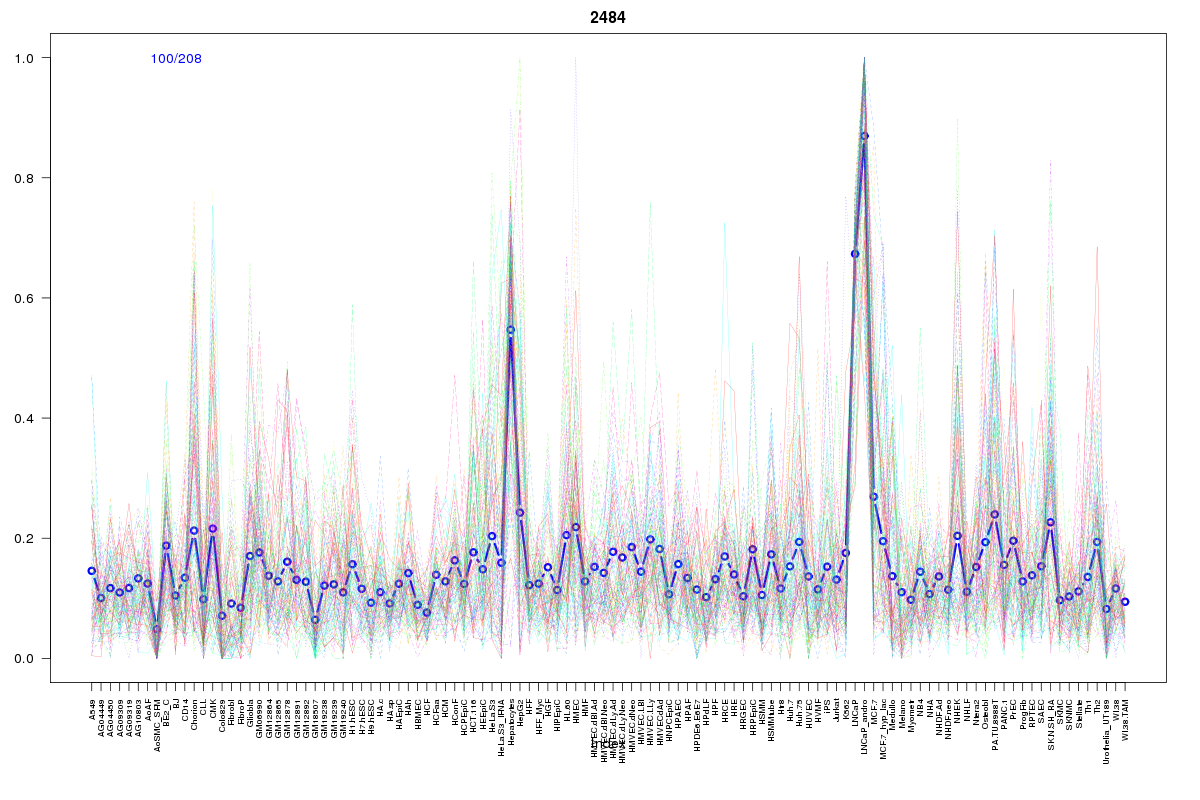 | 2484 | 1 |
 | 1008 | 1 |
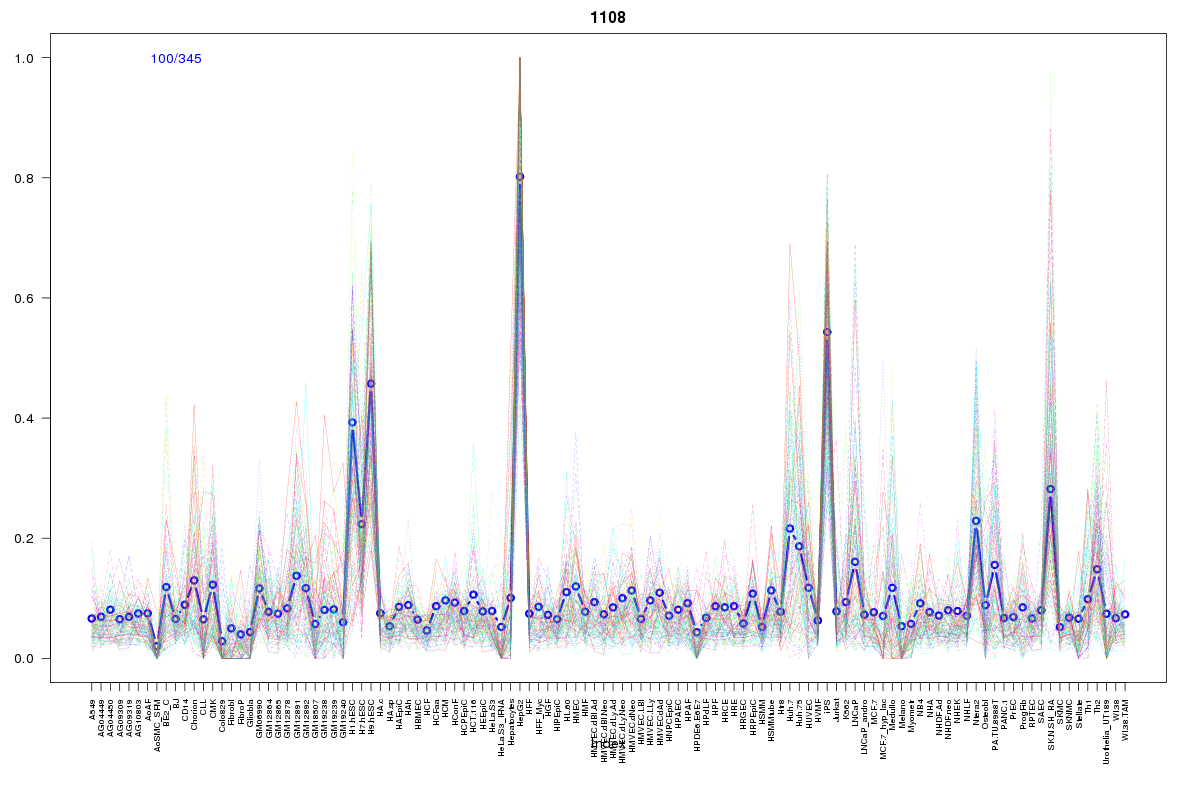 | 1108 | 1 |
 | 182 | 1 |
Resources
BED file downloads
Connects to 38 DHS sitesTop 10 Correlated DHS Sites
p-values indiciate significant higher or lower correlation| Location | Cluster | P-value |
|---|---|---|
| chr3:50280820-50280970 | 78 | 0 |
| chr3:50371280-50371430 | 844 | 0 |
| chr3:50292440-50292590 | 692 | 0.001 |
| chr3:50208260-50208410 | 127 | 0.003 |
| chr3:50284180-50284330 | 296 | 0.004 |
| chr3:50195760-50195910 | 2252 | 0.004 |
| chr3:50361220-50361370 | 739 | 0.004 |
| chr3:50360640-50360790 | 739 | 0.005 |
| chr3:50360925-50361075 | 884 | 0.007 |
| chr3:50285980-50286130 | 2391 | 0.008 |
| chr3:50371440-50371590 | 889 | 0.01 |
External Databases
UCSCEnsembl (ENSG00000114353)