Gene: TMEM59
chr1: 54497346-54513686Expression Profile
(log scale)
Graphical Connections
Distribution of linked clusters:
You may find it interesting if many of the connected DHS sites belong to the same cluster.| Cluster Profile | Cluster ID | Number of DHS sites in this cluster |
|---|---|---|
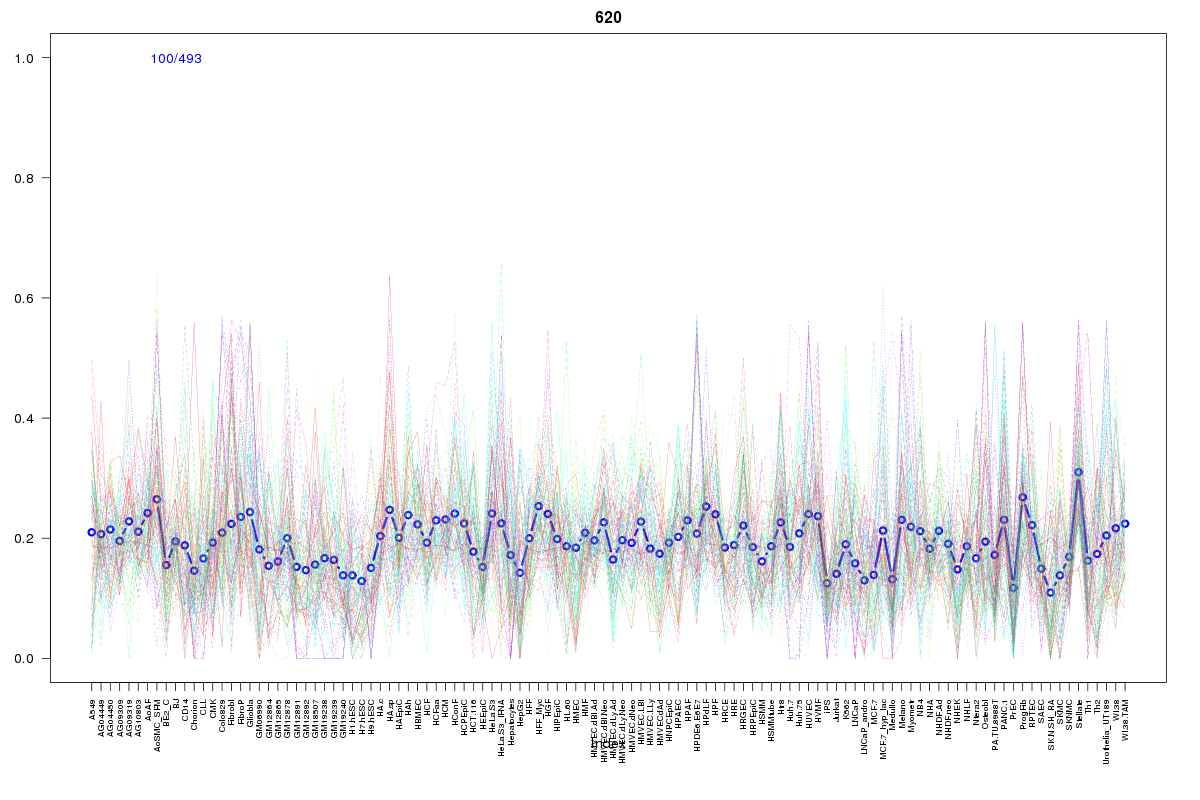 | 620 | 2 |
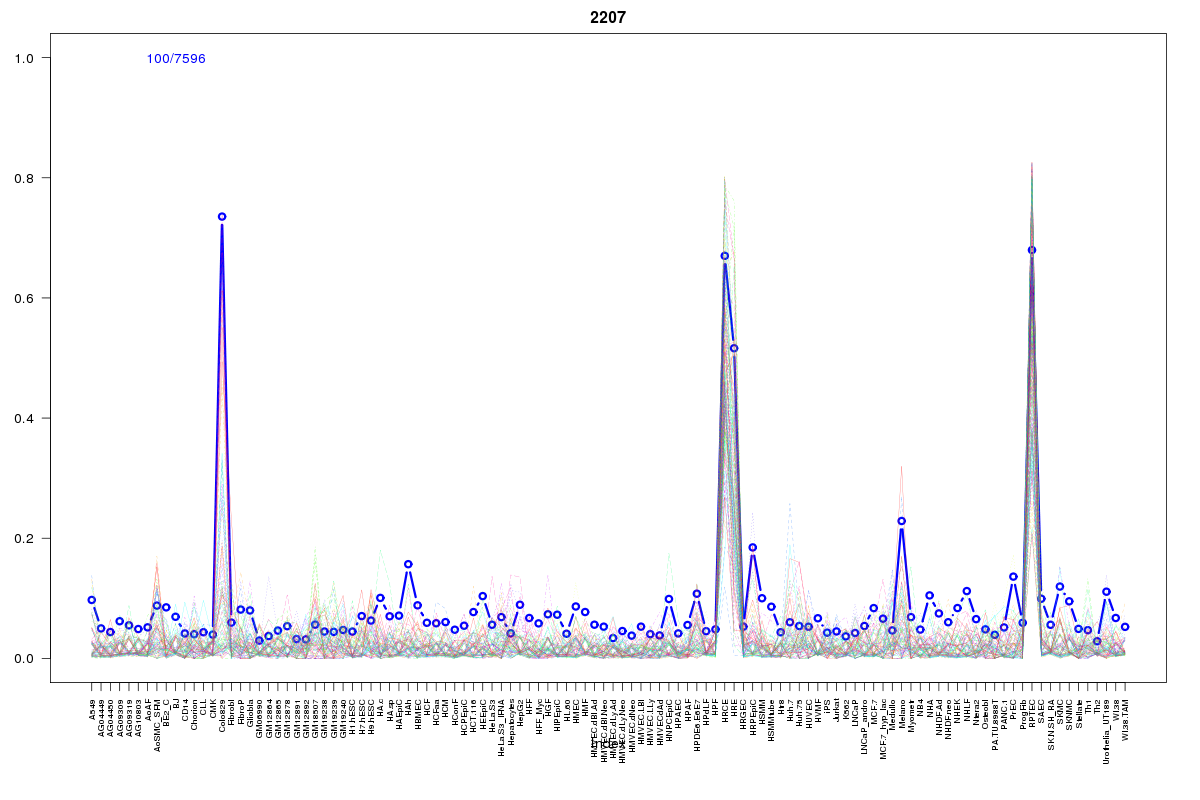 | 2207 | 1 |
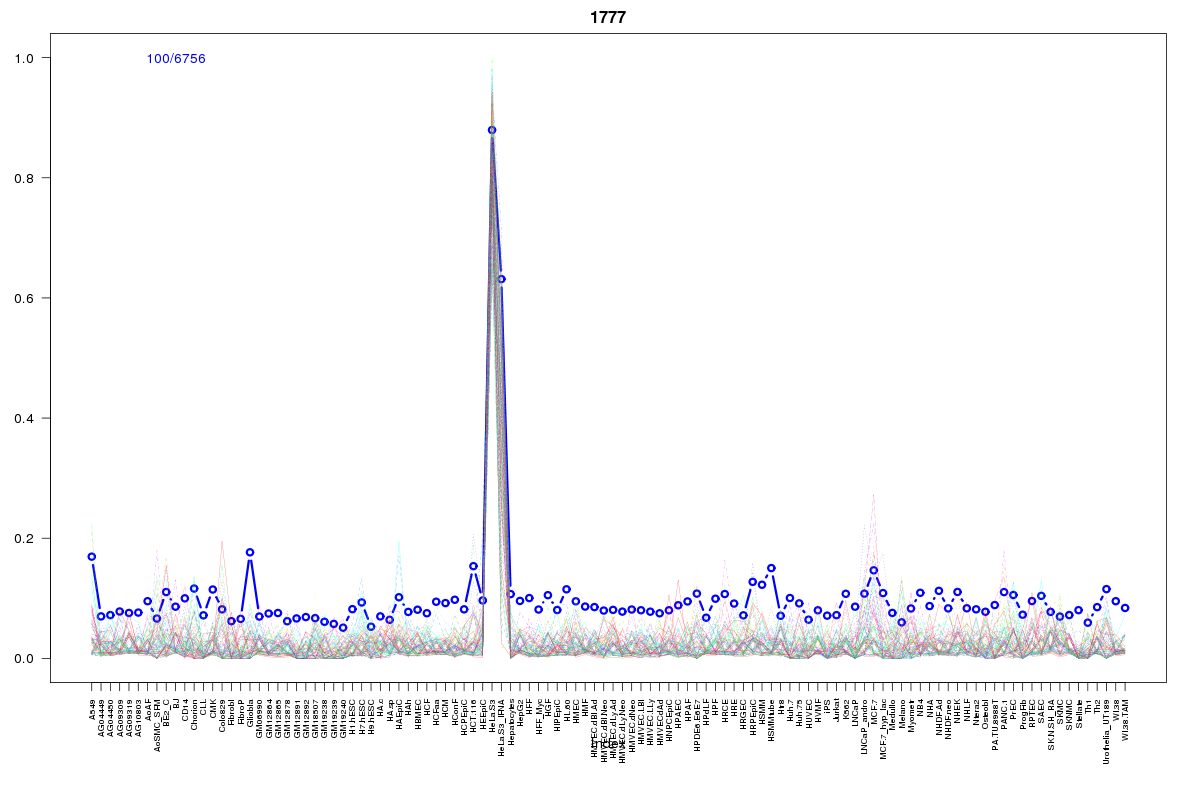 | 1777 | 1 |
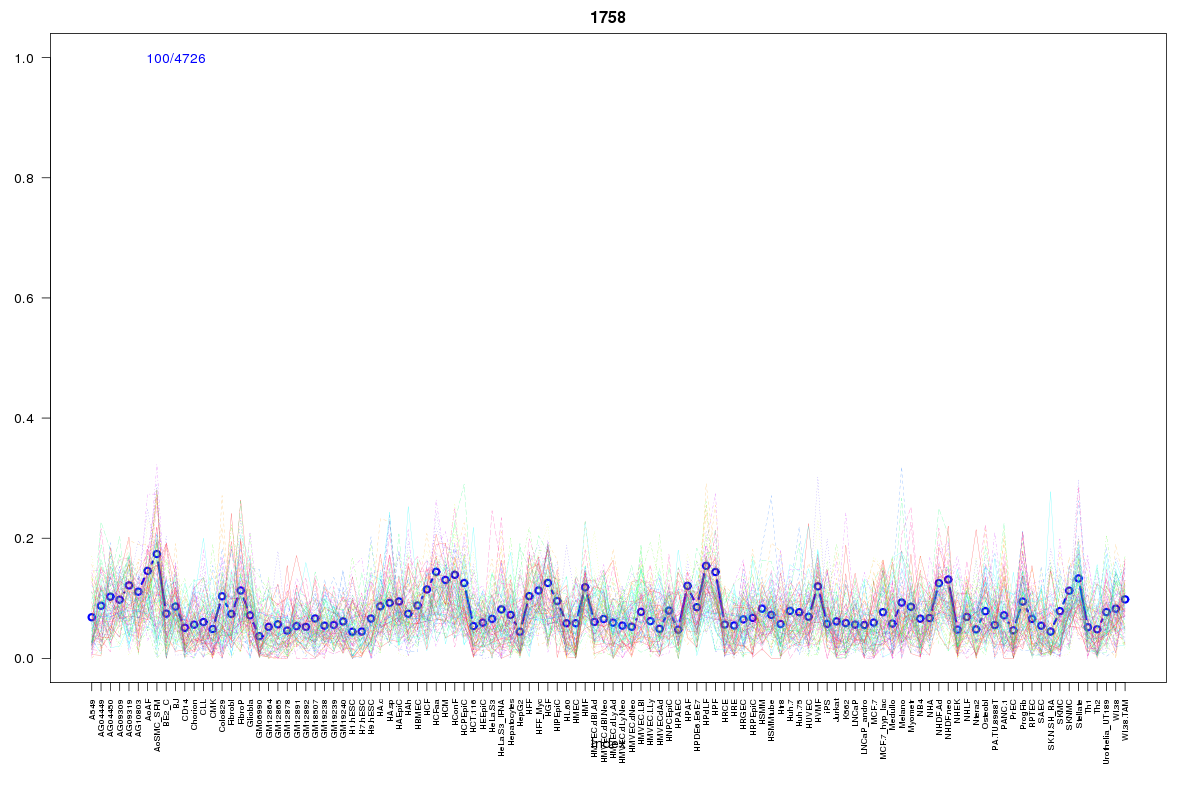 | 1758 | 1 |
 | 421 | 1 |
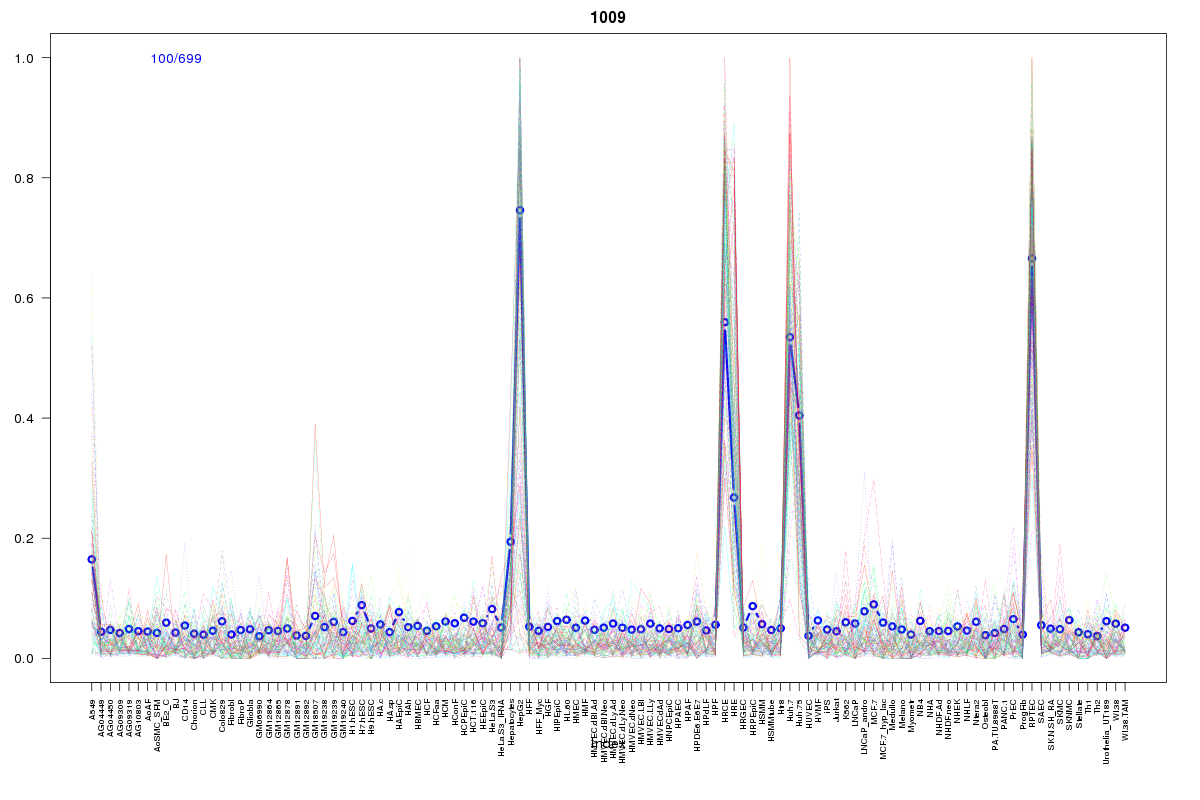 | 1009 | 1 |
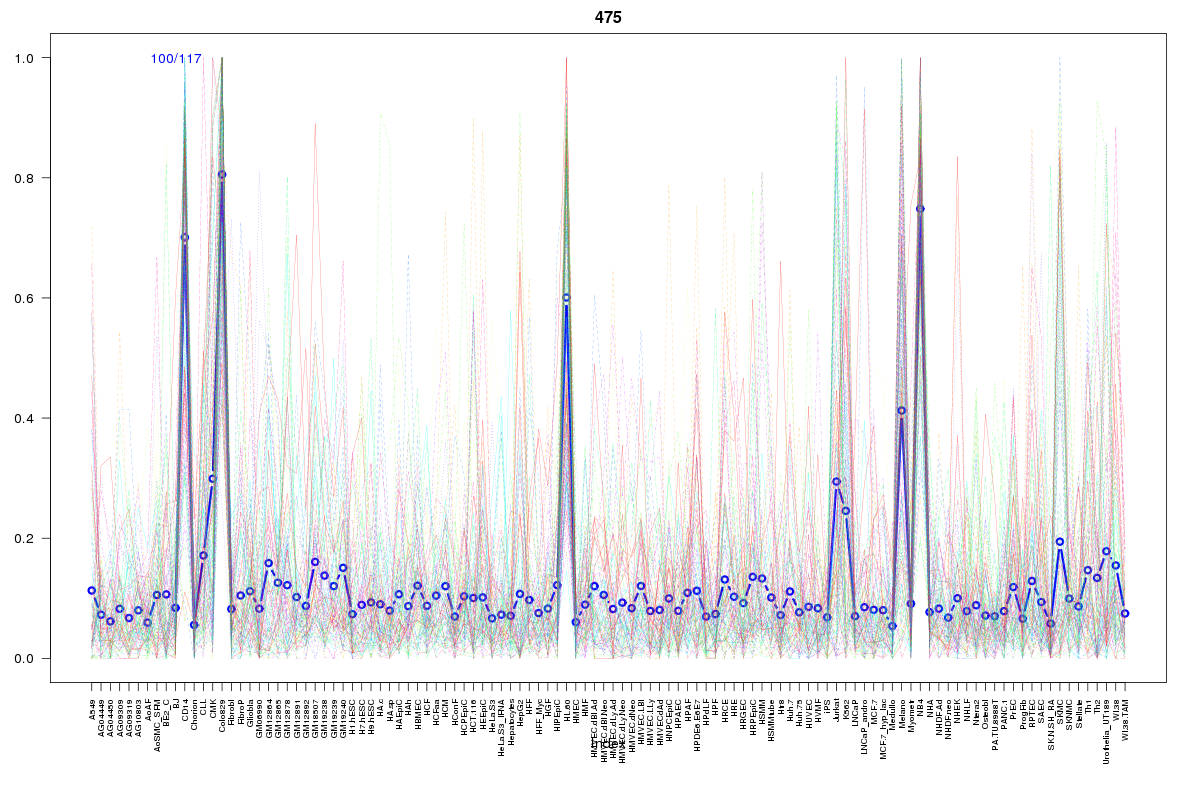 | 475 | 1 |
 | 1095 | 1 |
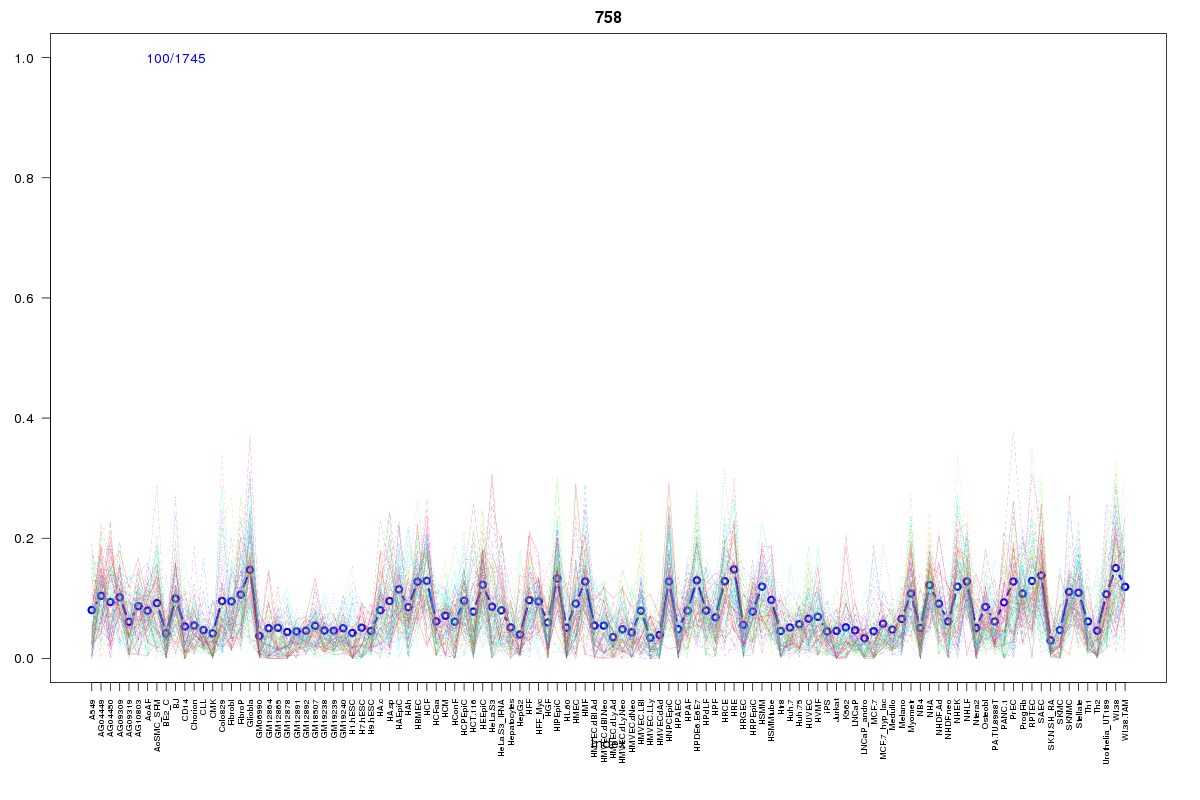 | 758 | 1 |
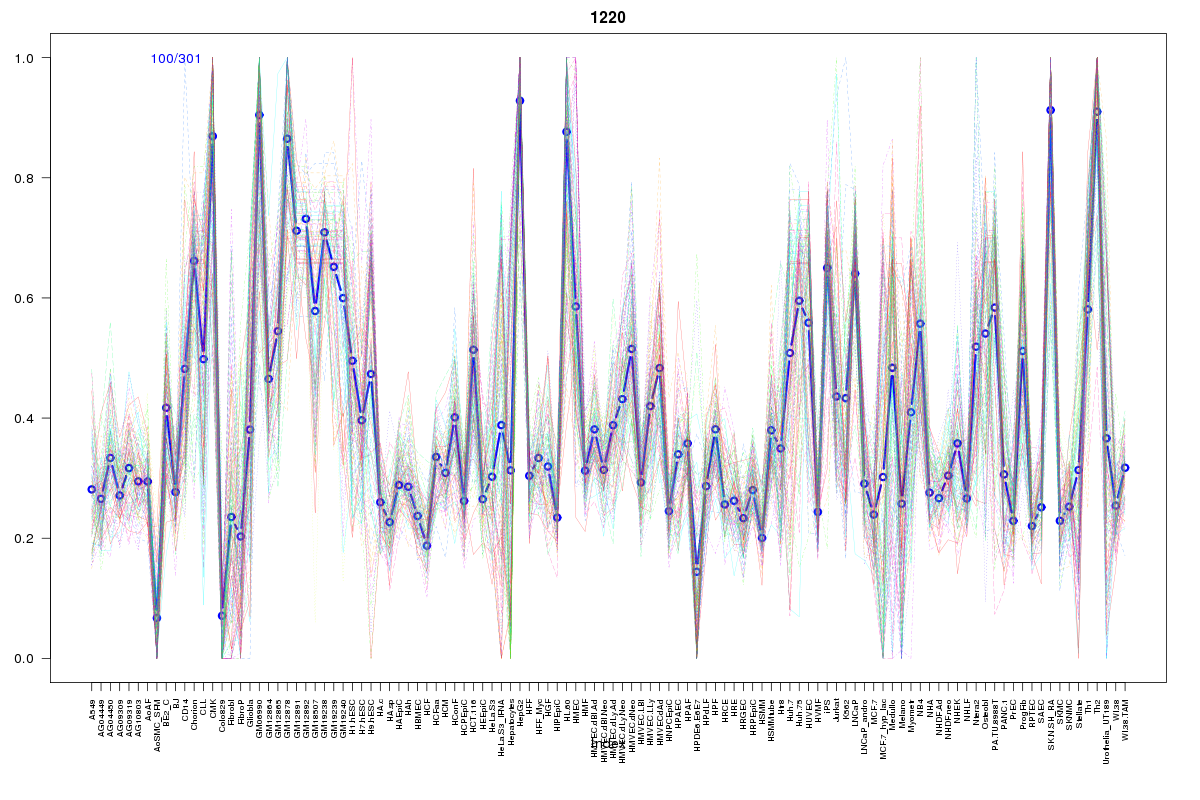 | 1220 | 1 |
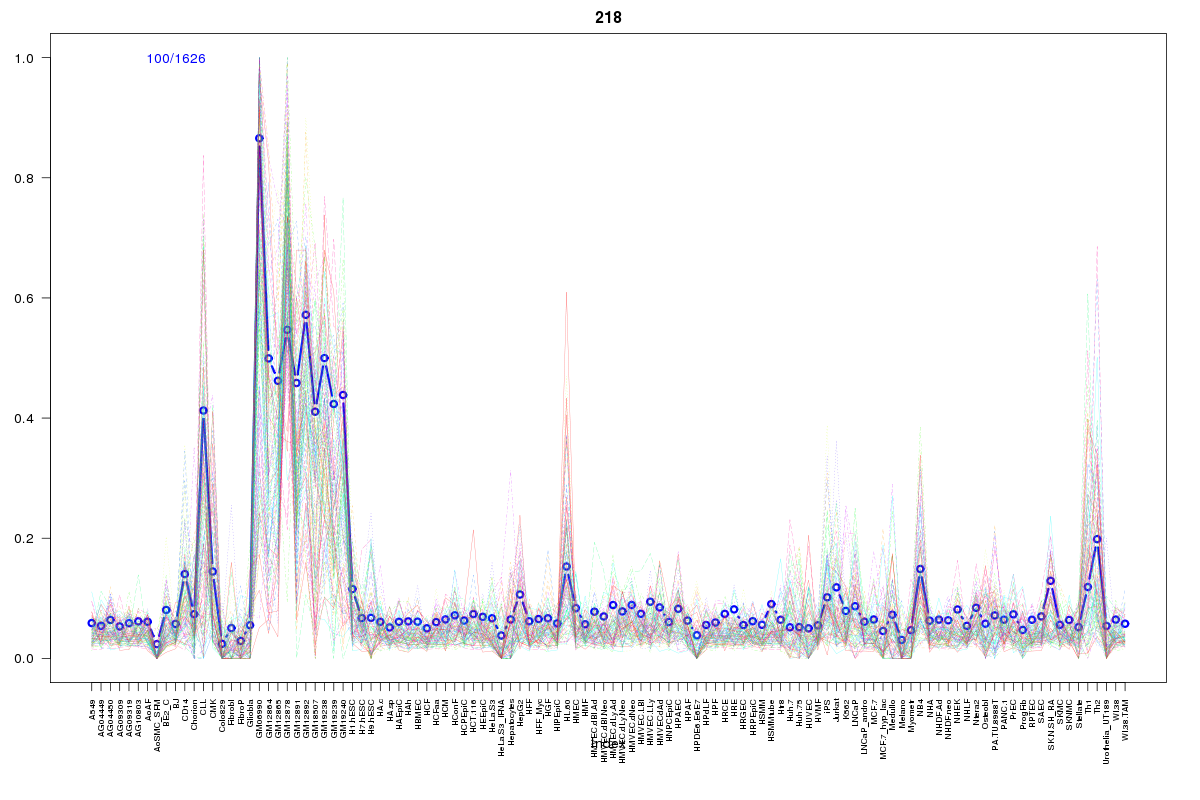 | 218 | 1 |
 | 860 | 1 |
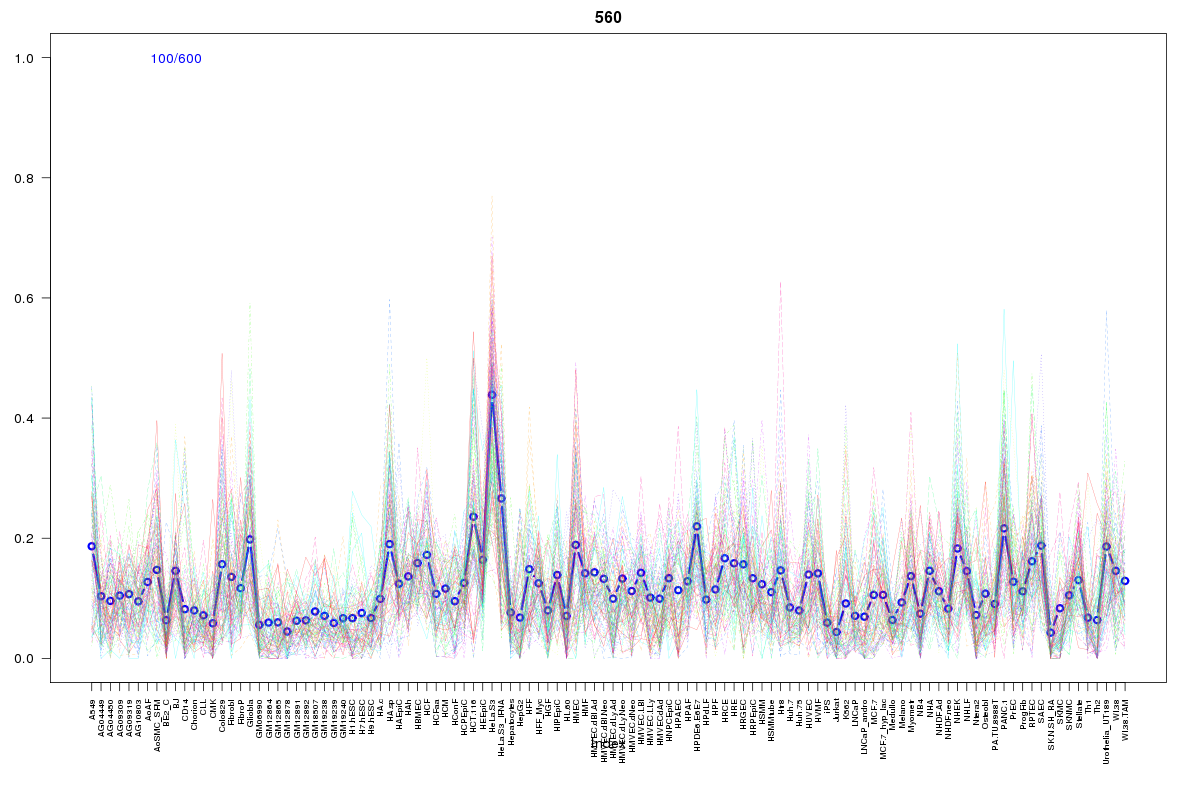 | 560 | 1 |
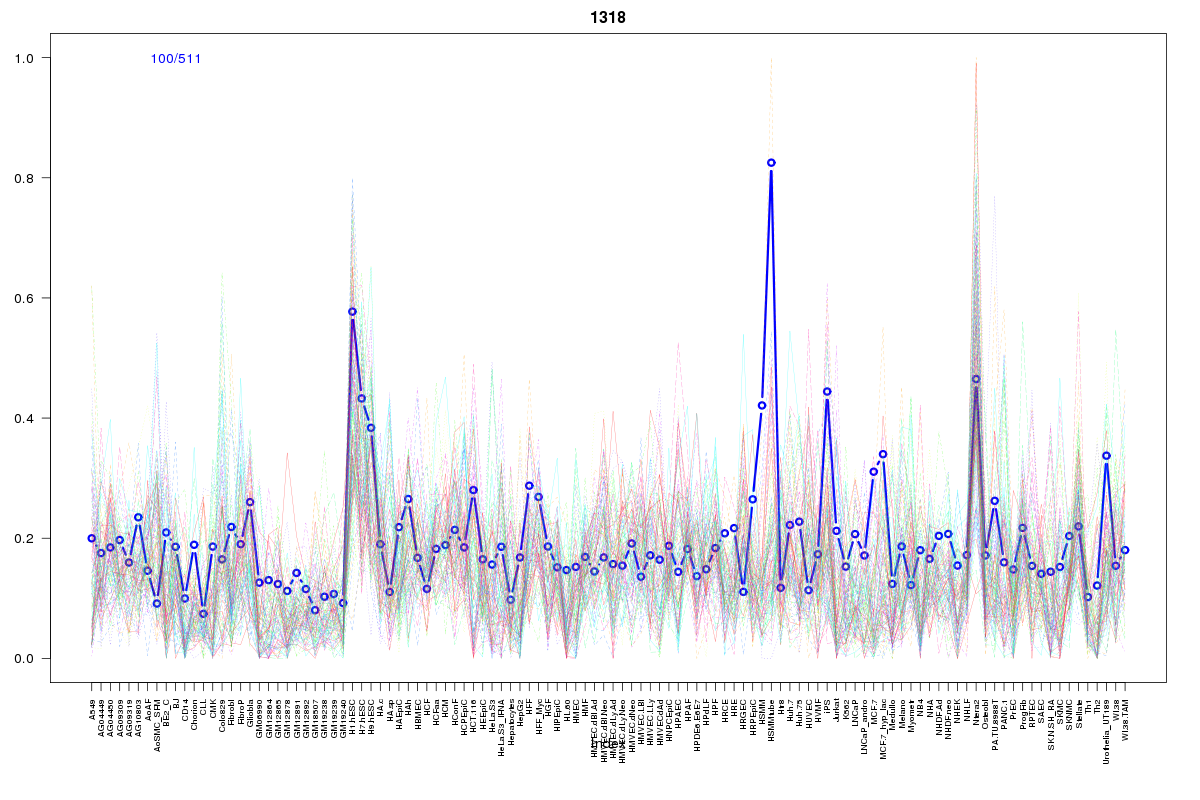 | 1318 | 1 |
Resources
BED file downloads
Connects to 15 DHS sitesTop 10 Correlated DHS Sites
p-values indiciate significant higher or lower correlation| Location | Cluster | P-value |
|---|---|---|
| chr1:54518000-54518150 | 620 | 0.001 |
| chr1:54584480-54584630 | 1095 | 0.011 |
| chr1:54448540-54448690 | 2207 | 0.012 |
| chr1:54481165-54481315 | 1777 | 0.013 |
| chr1:54518160-54518310 | 620 | 0.016 |
| chr1:54422320-54422470 | 560 | 0.016 |
| chr1:54584805-54584955 | 758 | 0.019 |
| chr1:54448120-54448270 | 1318 | 0.02 |
| chr1:54413705-54413855 | 860 | 0.02 |
| chr1:54546340-54546490 | 1009 | 0.022 |
| chr1:54512880-54513030 | 1758 | 0.024 |
External Databases
UCSCEnsembl (ENSG00000116209)