Gene: AKT3
chr1: 243651534-244006538Expression Profile
(log scale)
Graphical Connections
Distribution of linked clusters:
You may find it interesting if many of the connected DHS sites belong to the same cluster.| Cluster Profile | Cluster ID | Number of DHS sites in this cluster |
|---|---|---|
 | 934 | 2 |
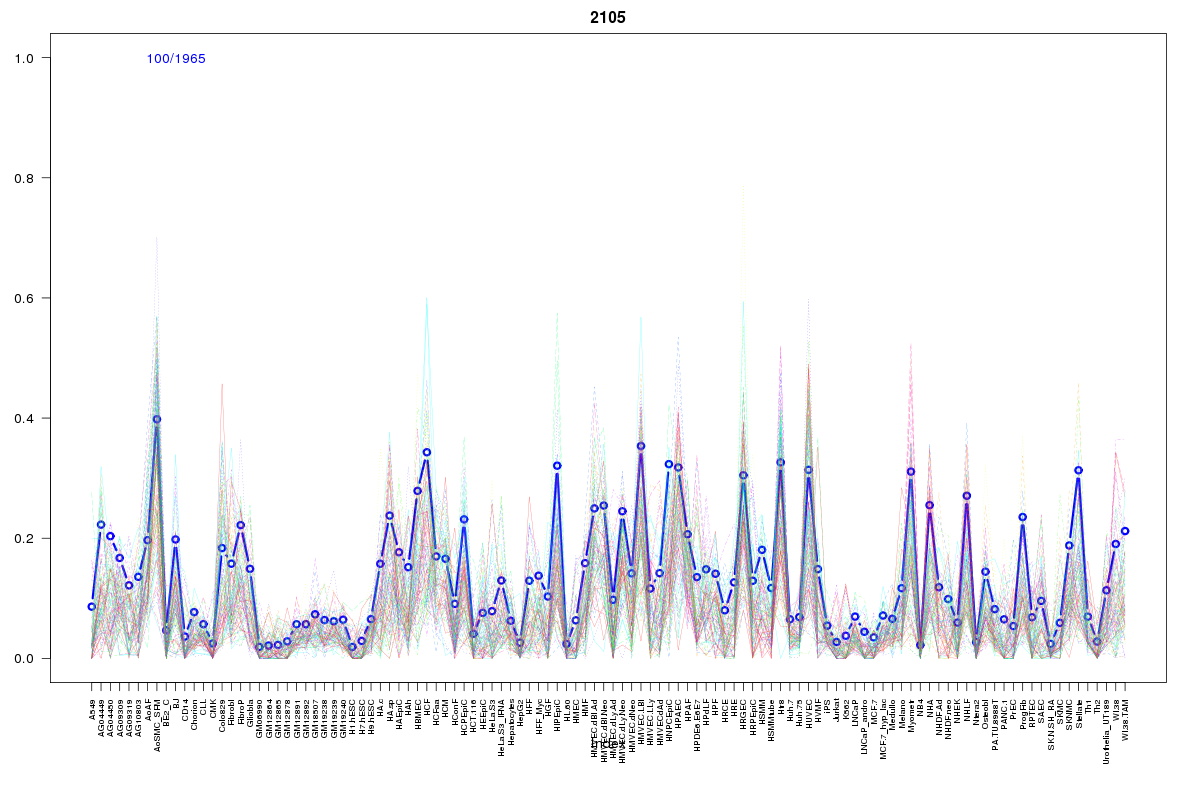 | 2105 | 2 |
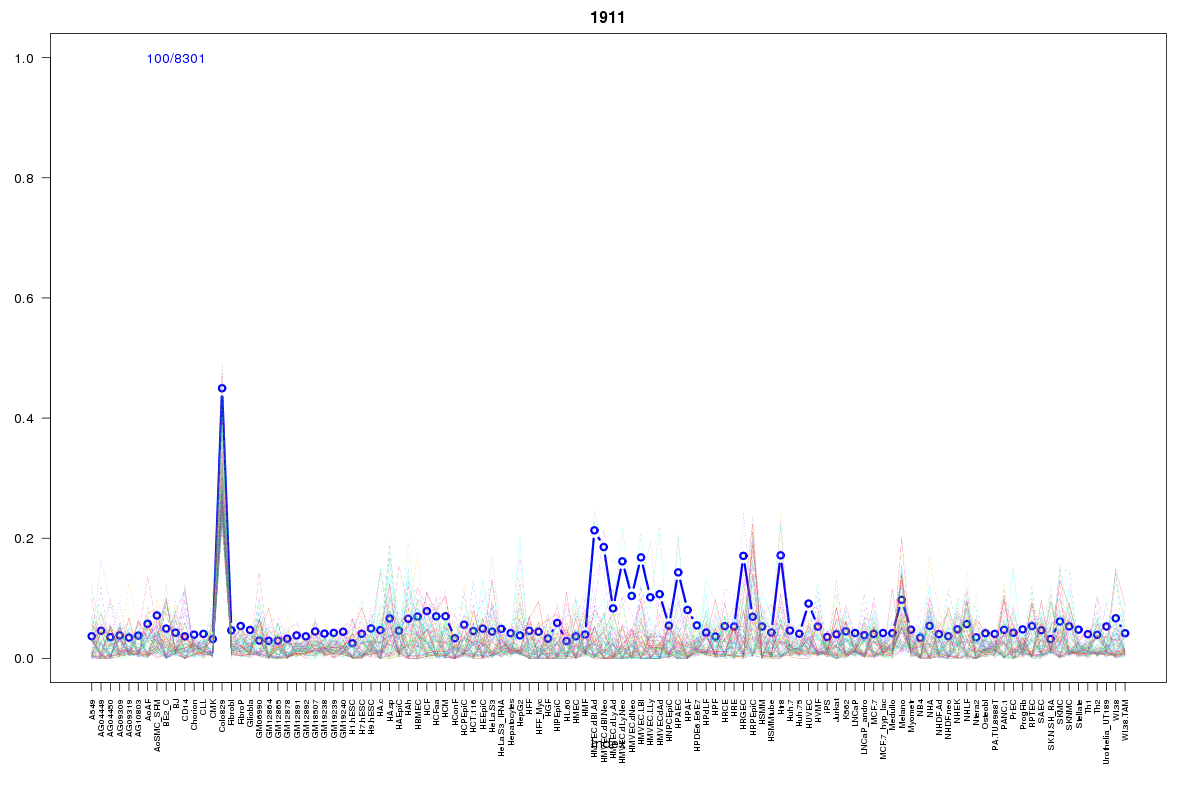 | 1911 | 2 |
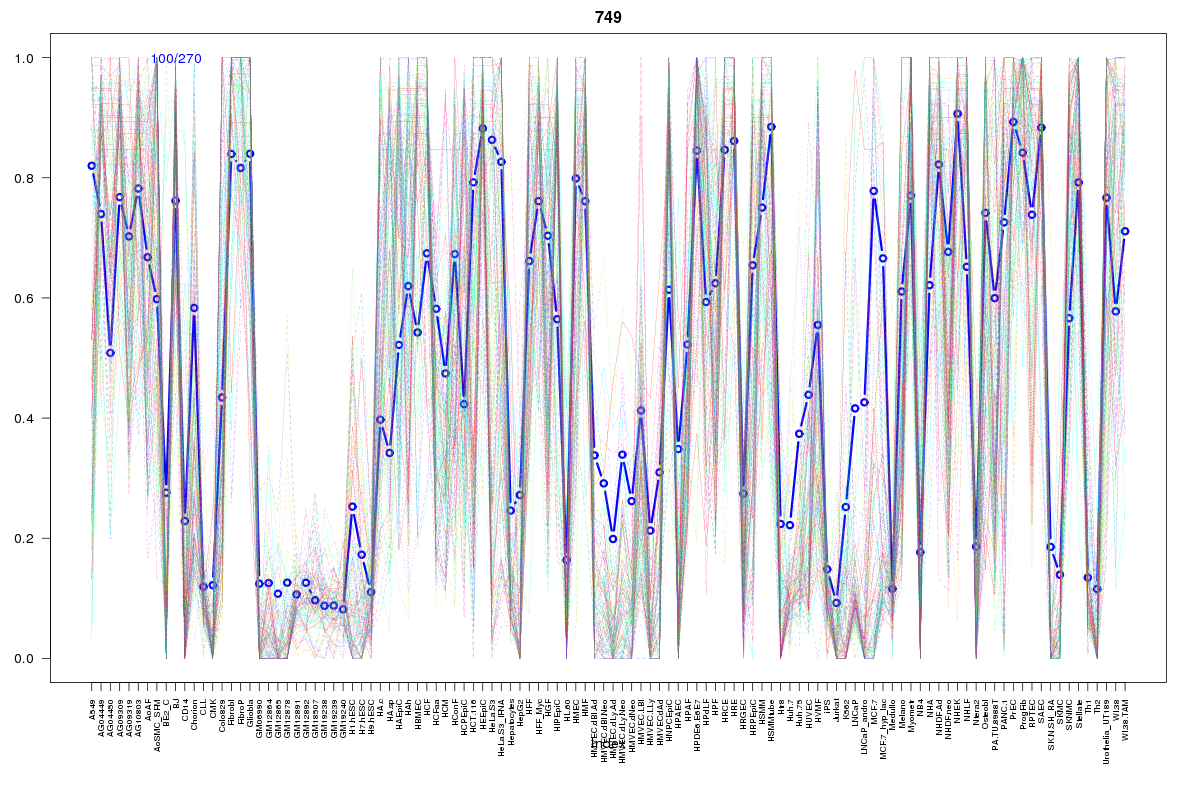 | 749 | 1 |
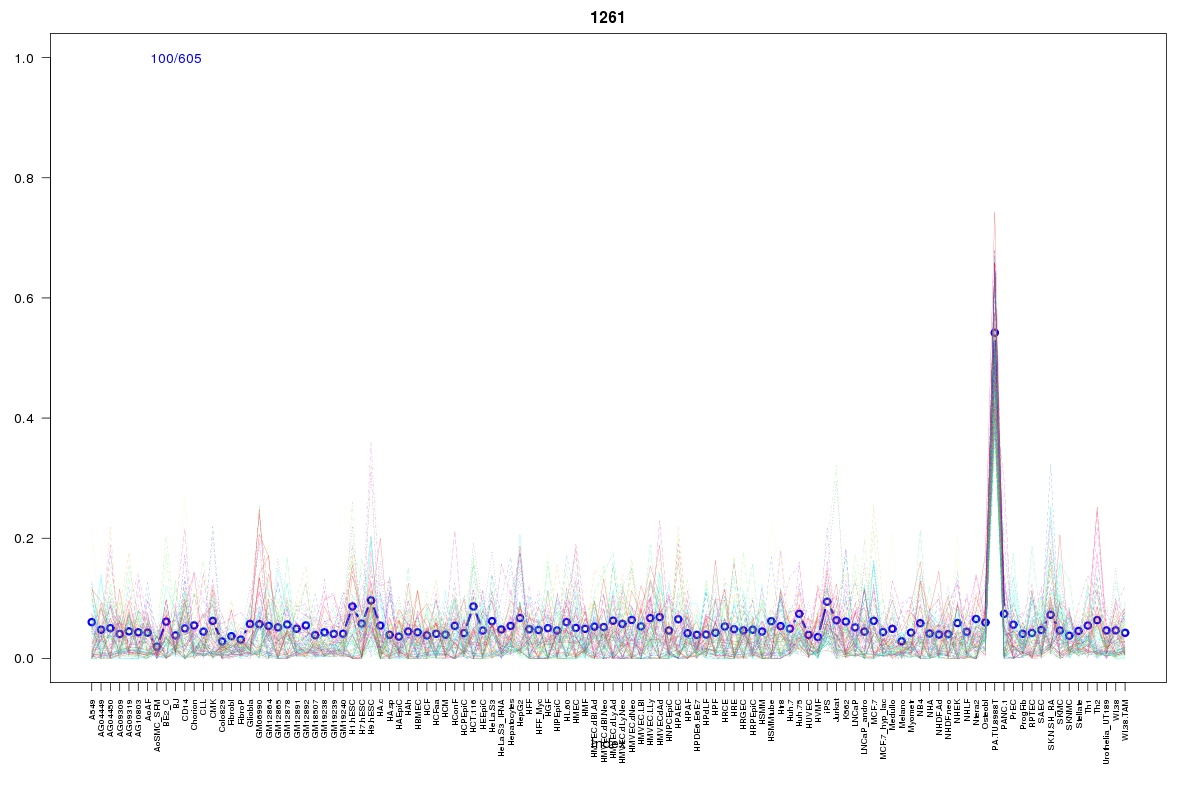 | 1261 | 1 |
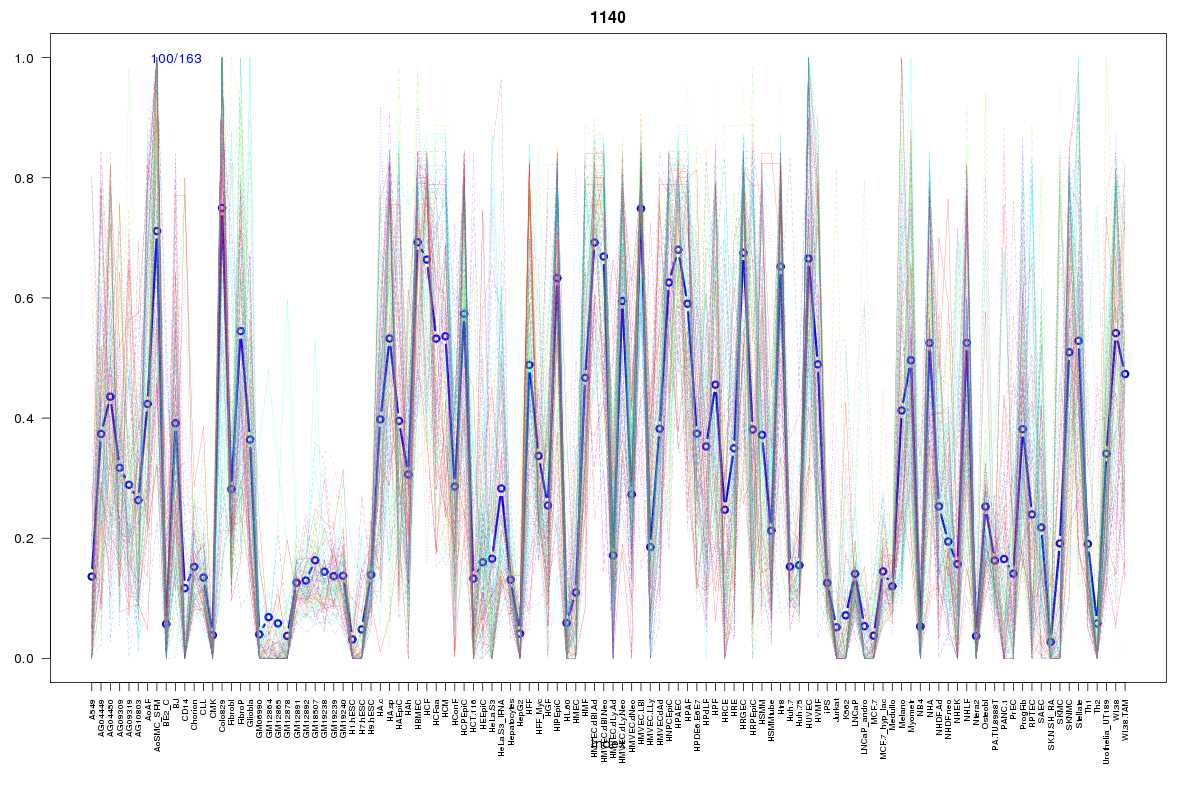 | 1140 | 1 |
 | 655 | 1 |
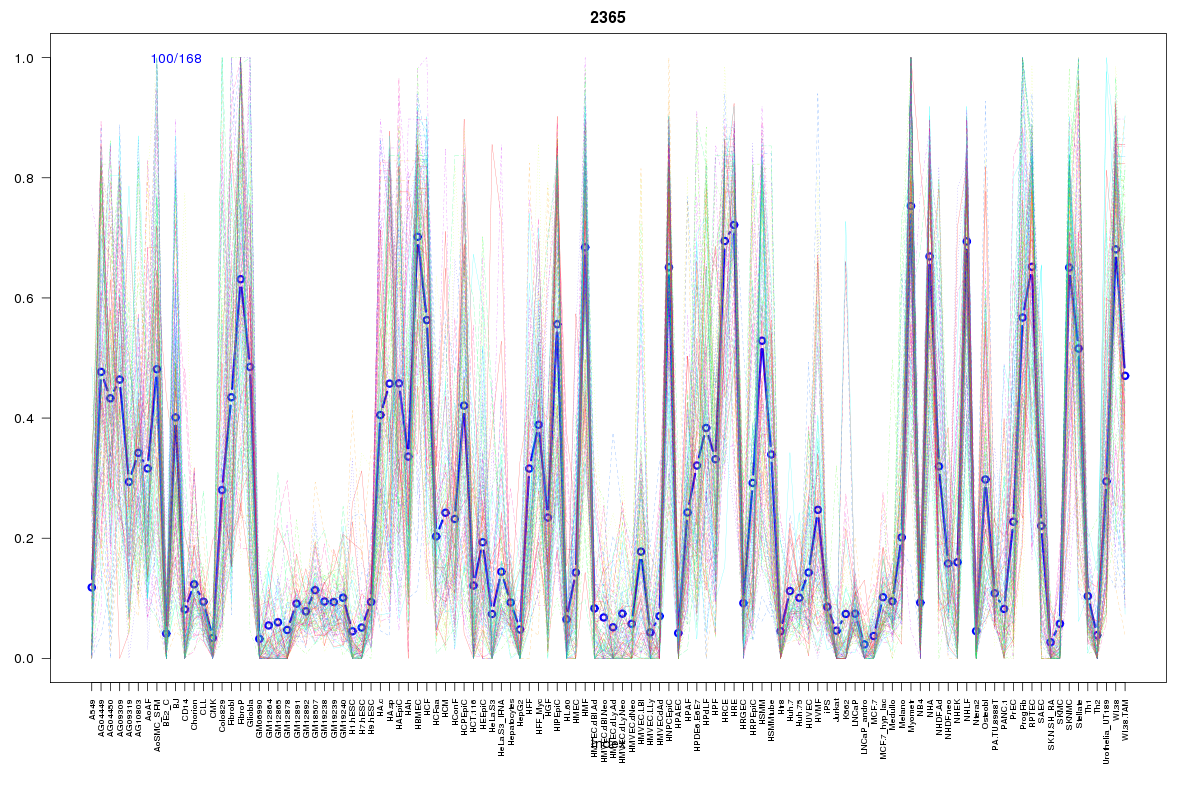 | 2365 | 1 |
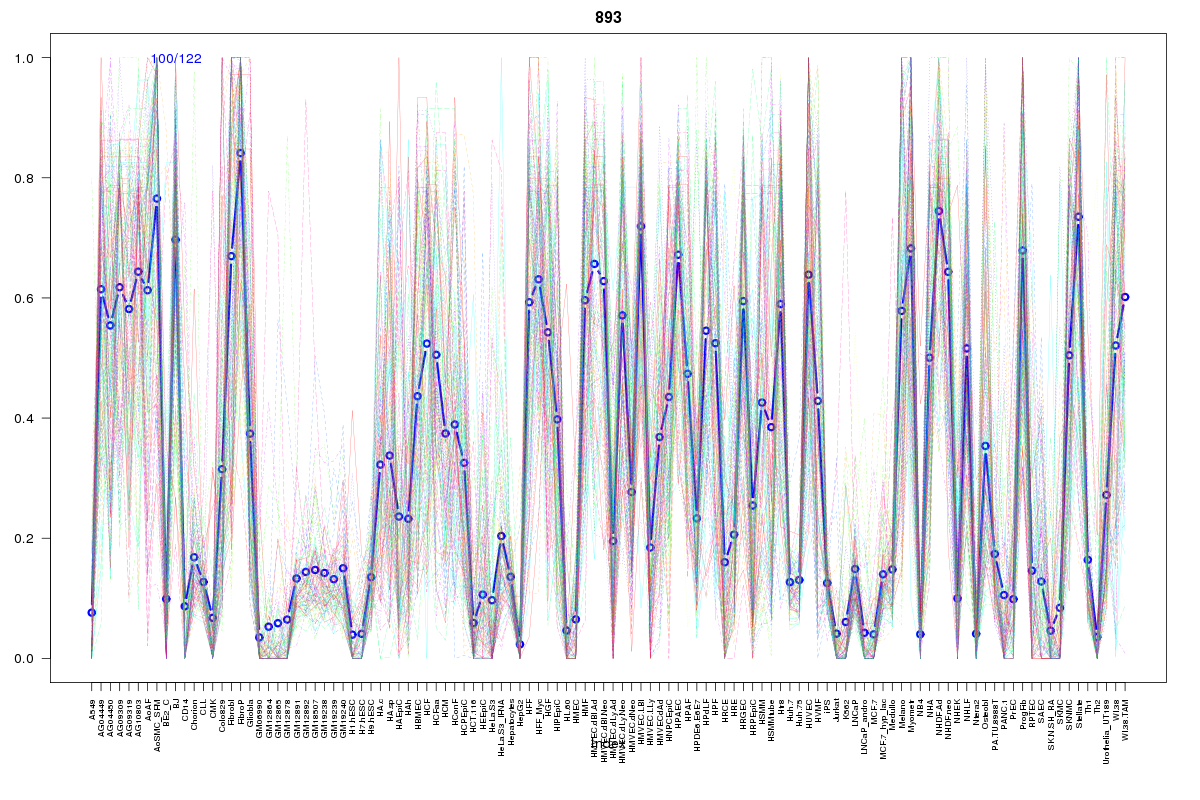 | 893 | 1 |
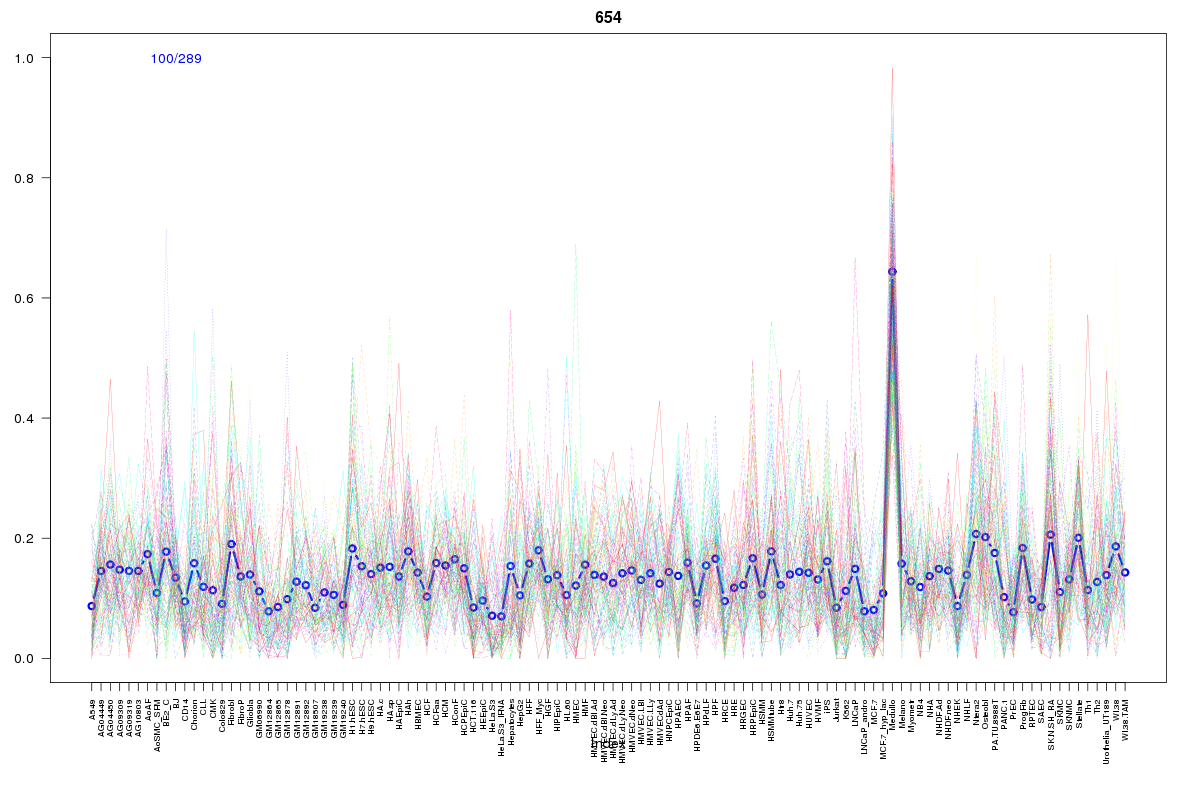 | 654 | 1 |
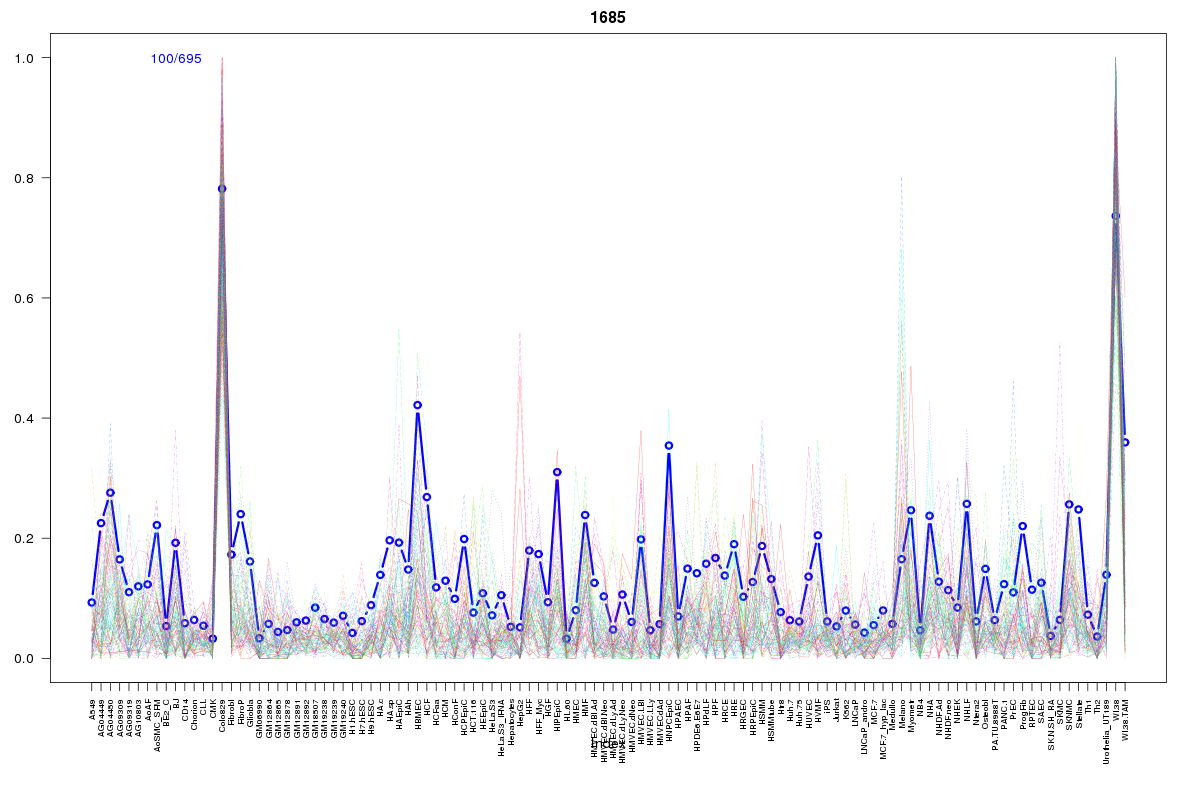 | 1685 | 1 |
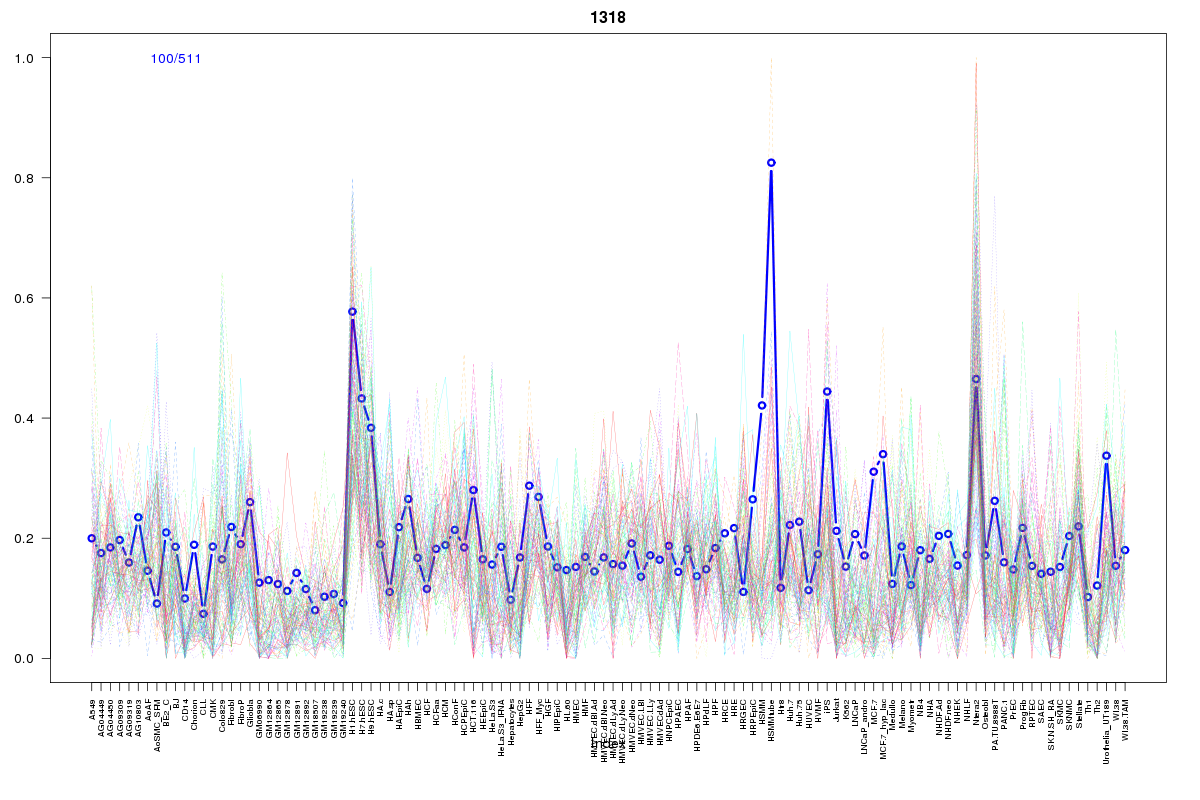 | 1318 | 1 |
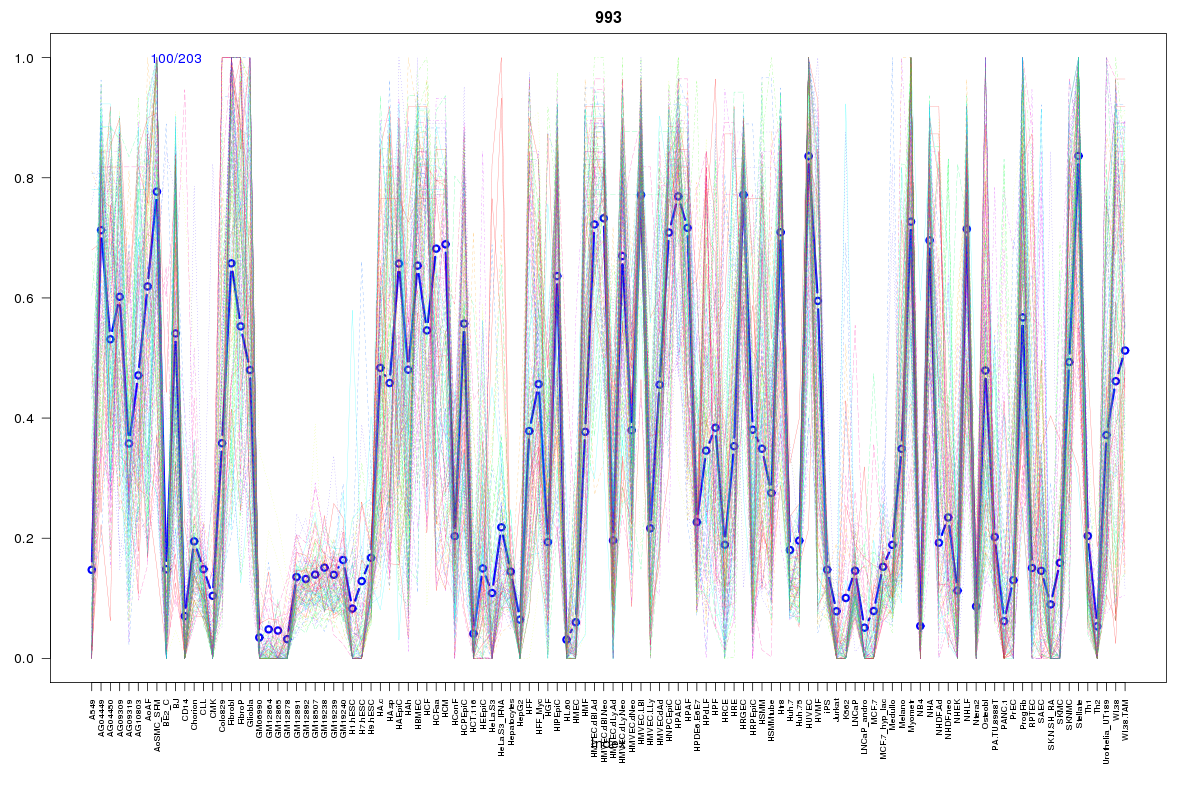 | 993 | 1 |
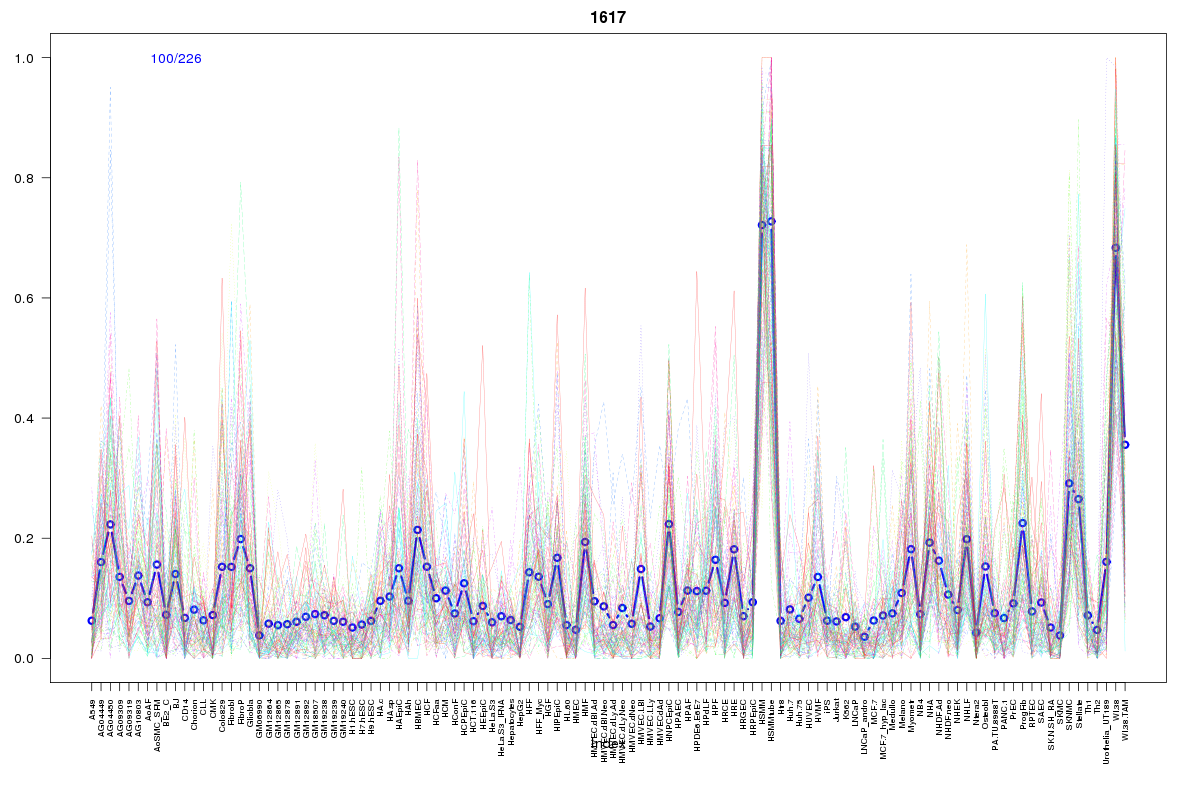 | 1617 | 1 |
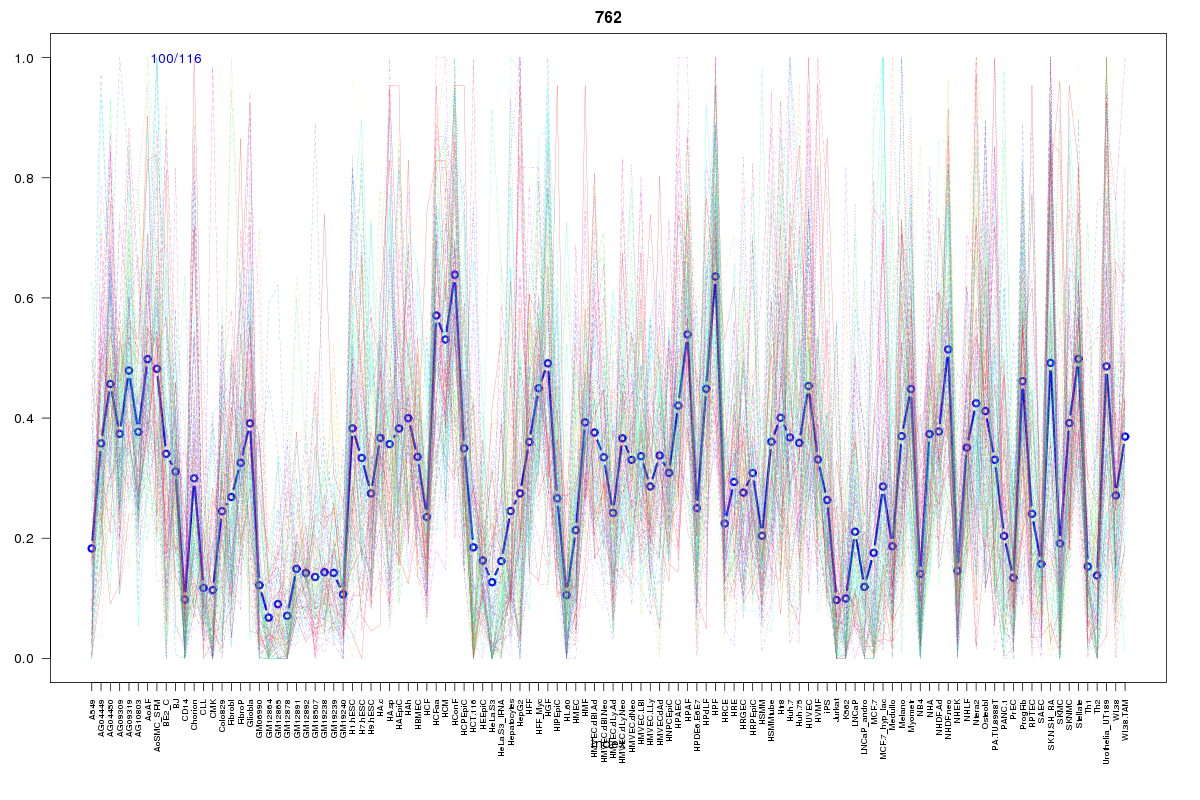 | 762 | 1 |
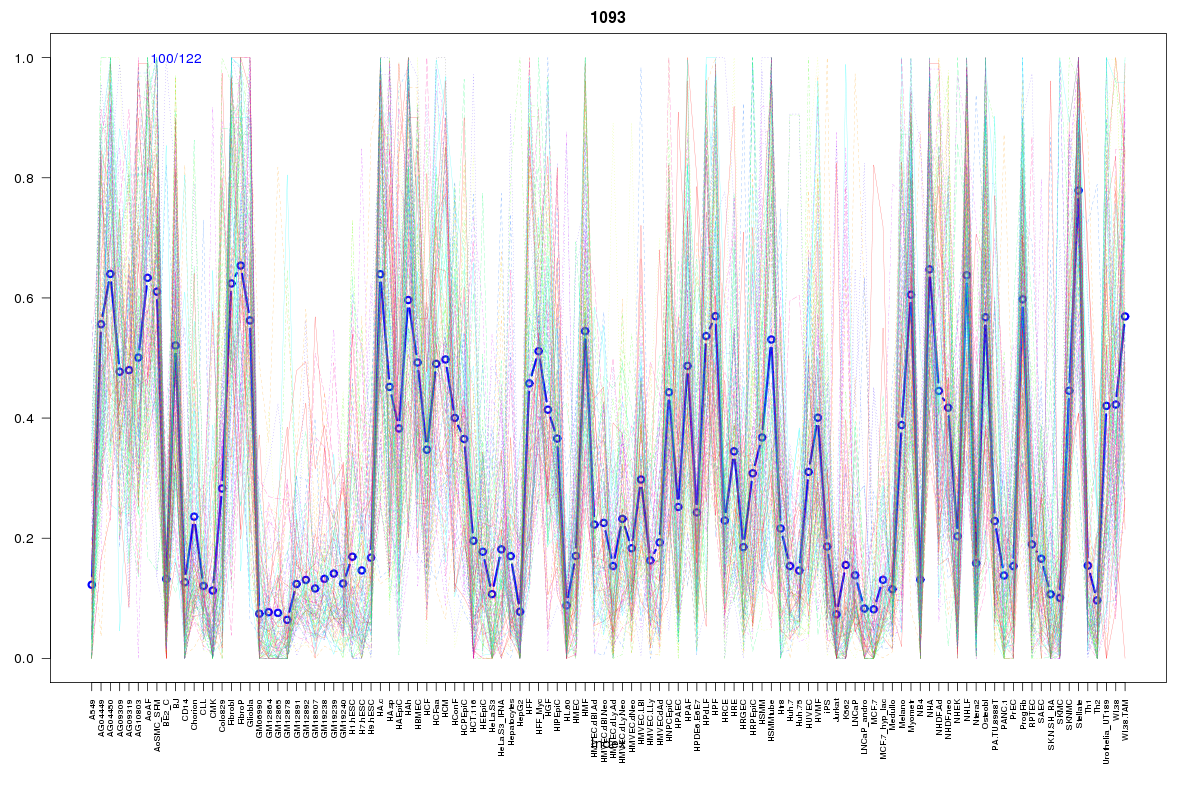 | 1093 | 1 |
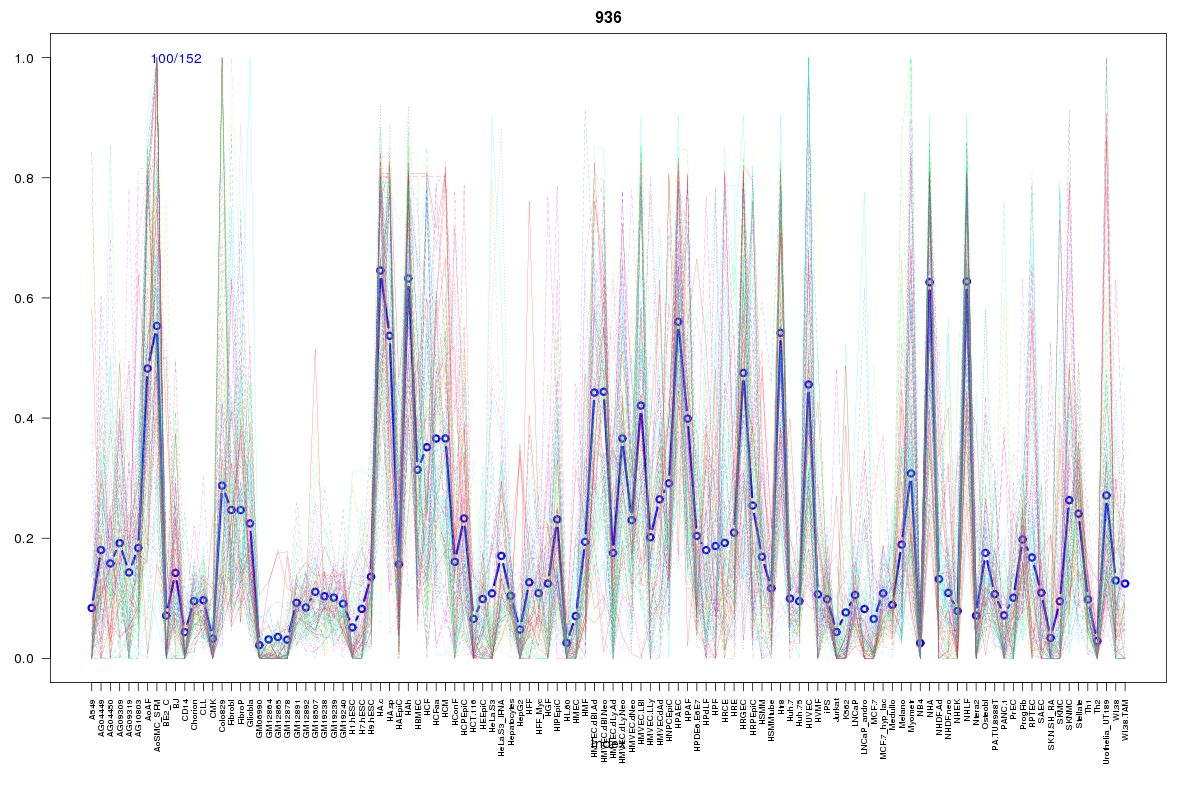 | 936 | 1 |
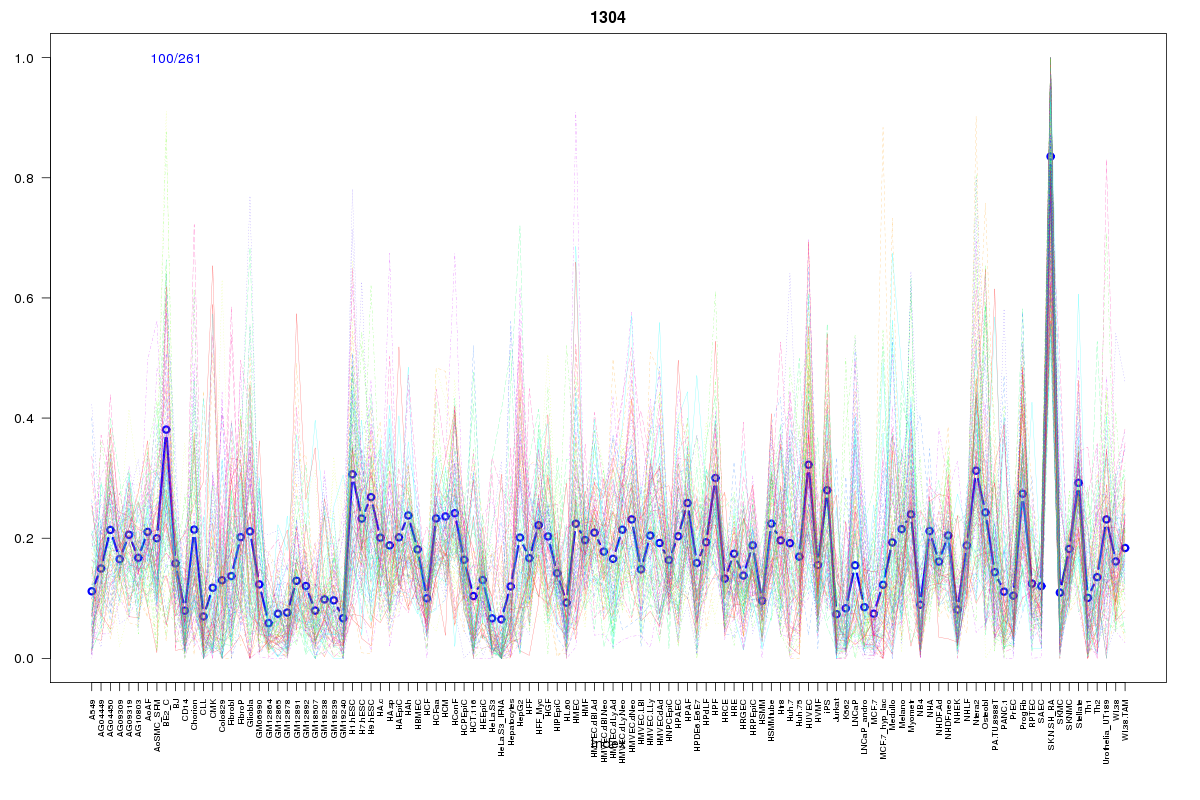 | 1304 | 1 |
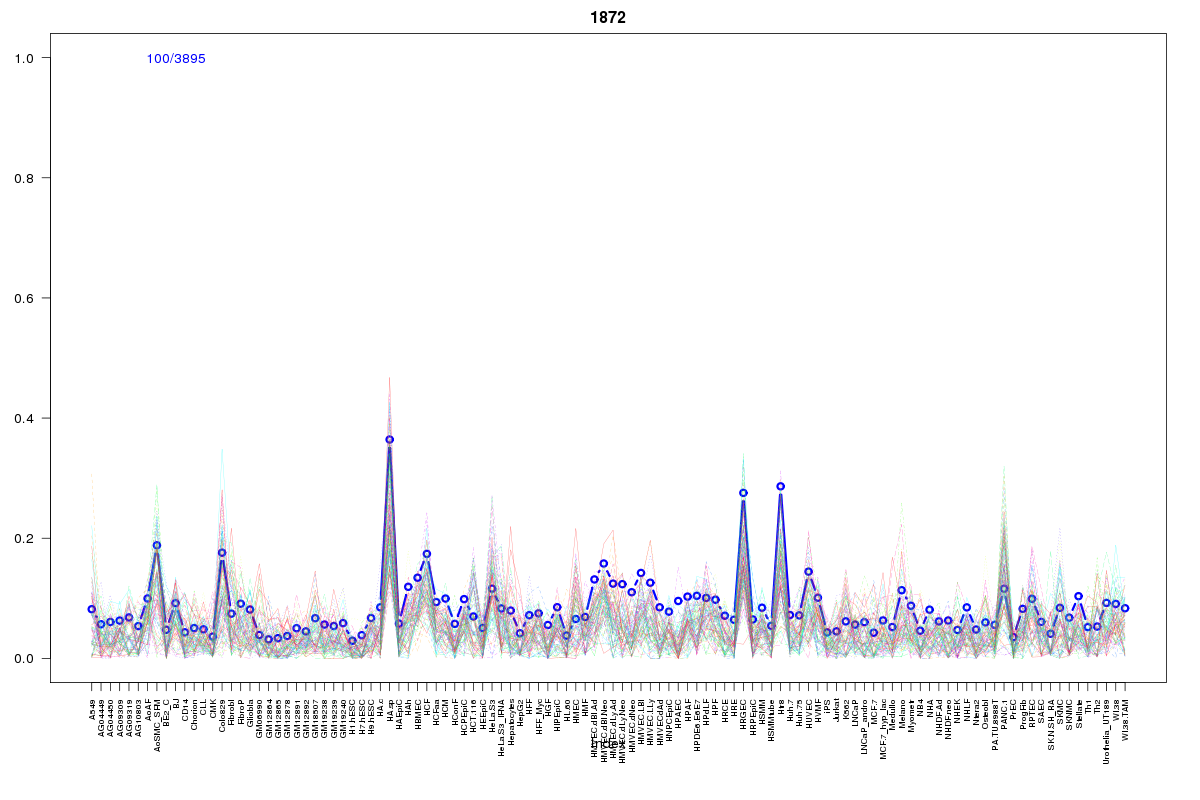 | 1872 | 1 |
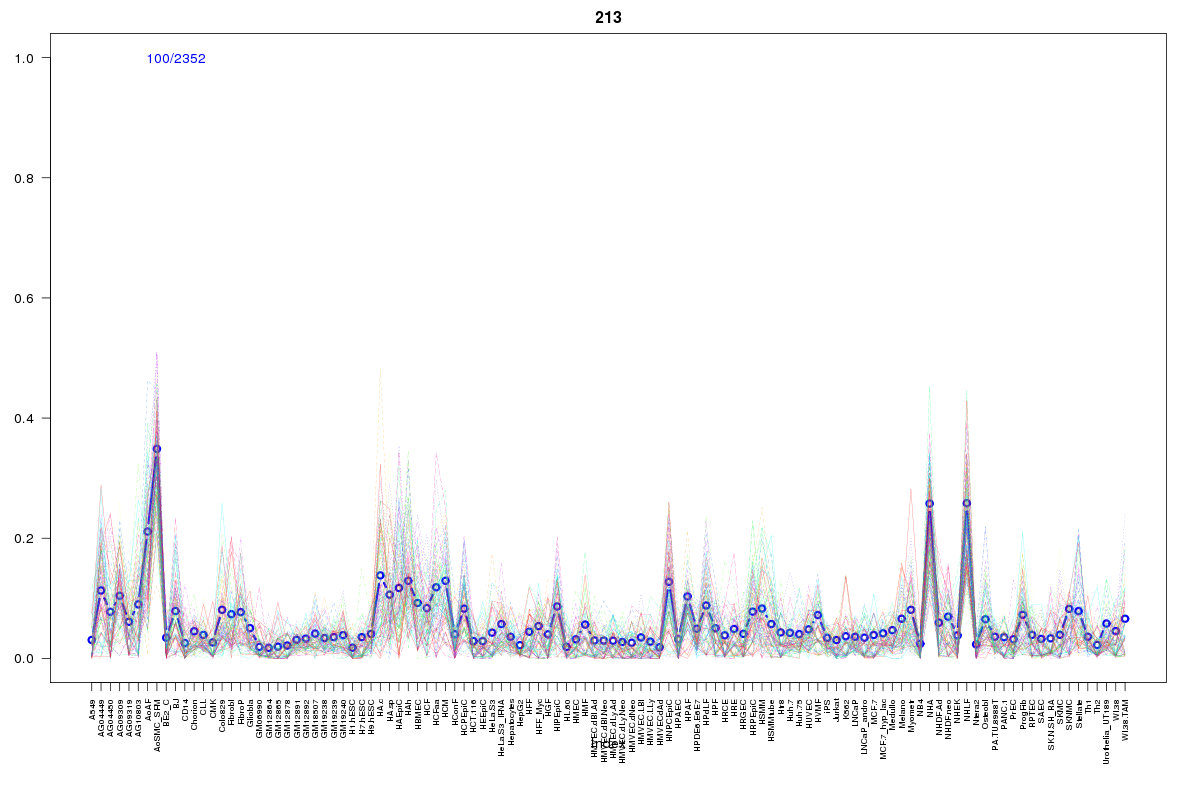 | 213 | 1 |
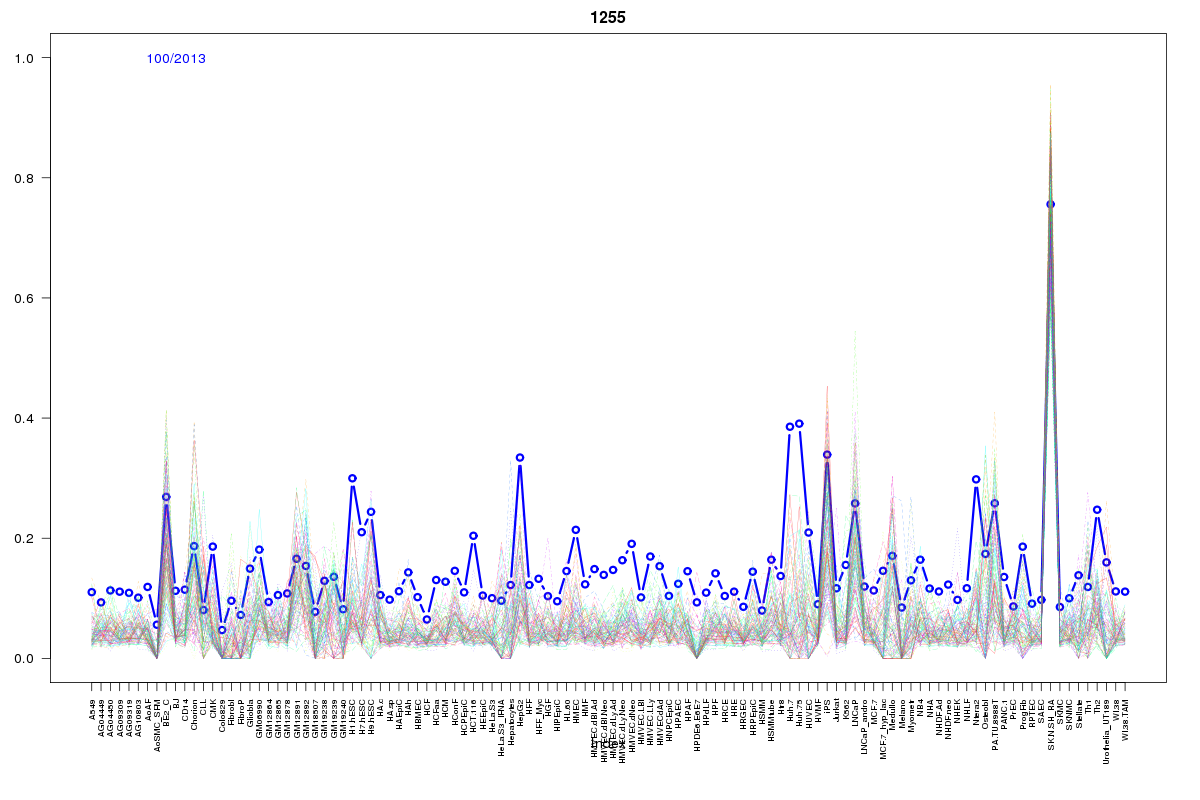 | 1255 | 1 |
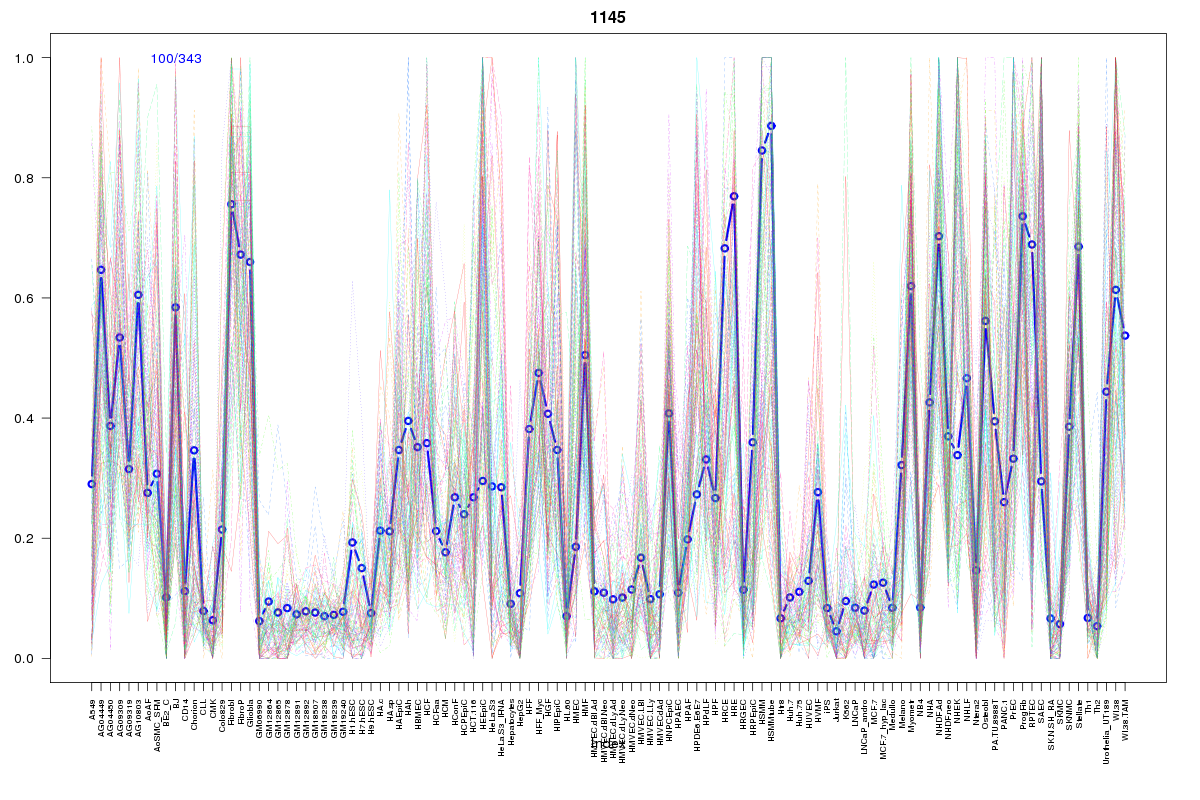 | 1145 | 1 |
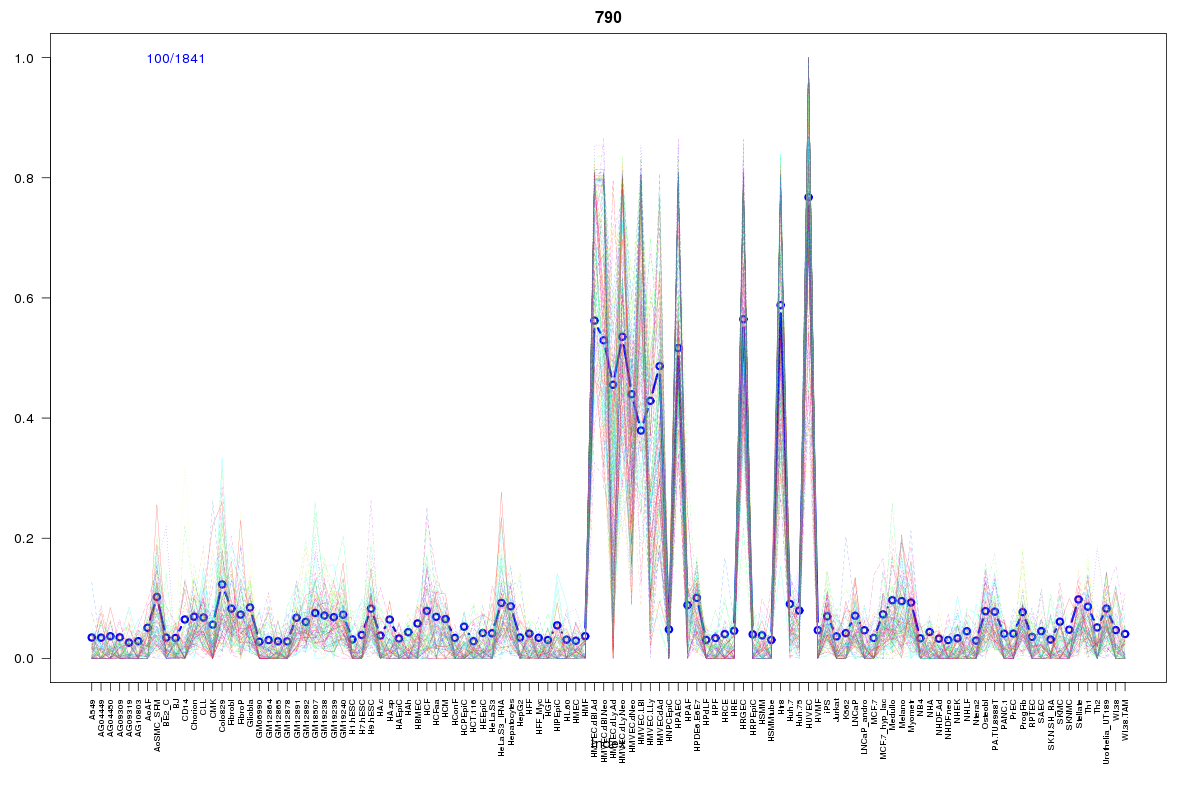 | 790 | 1 |
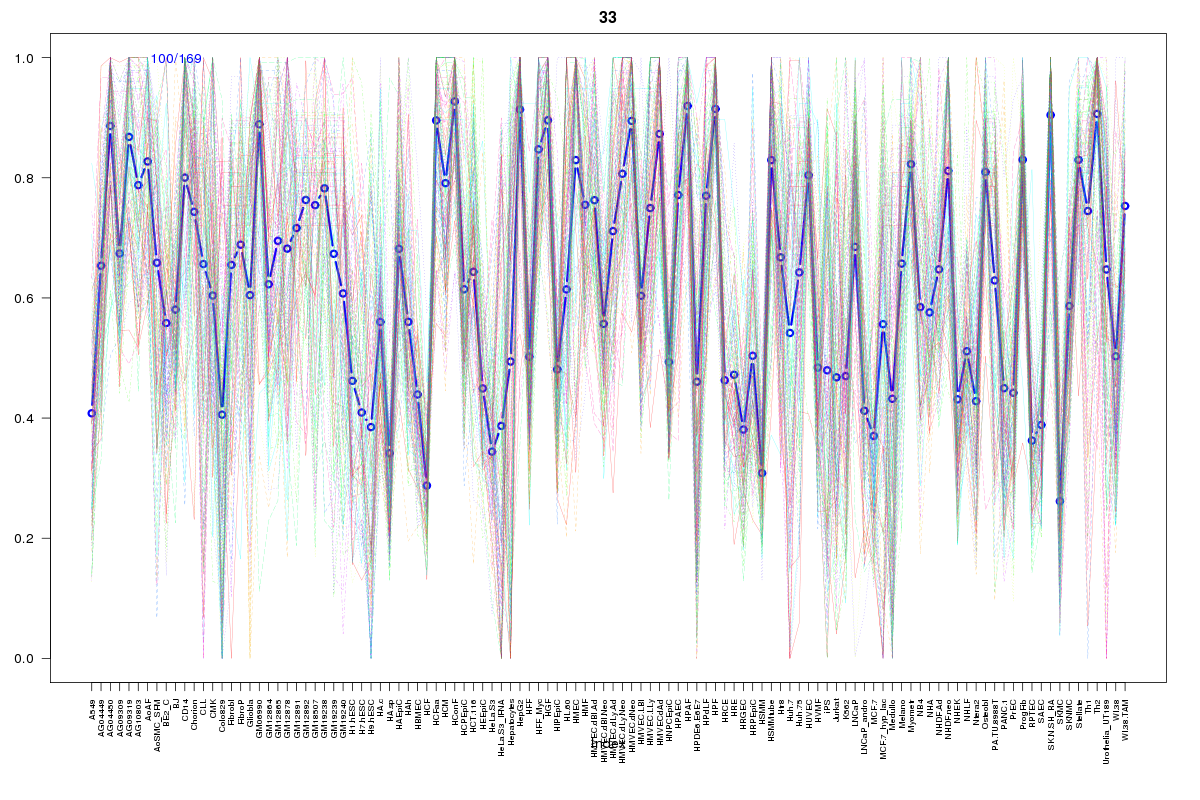 | 33 | 1 |
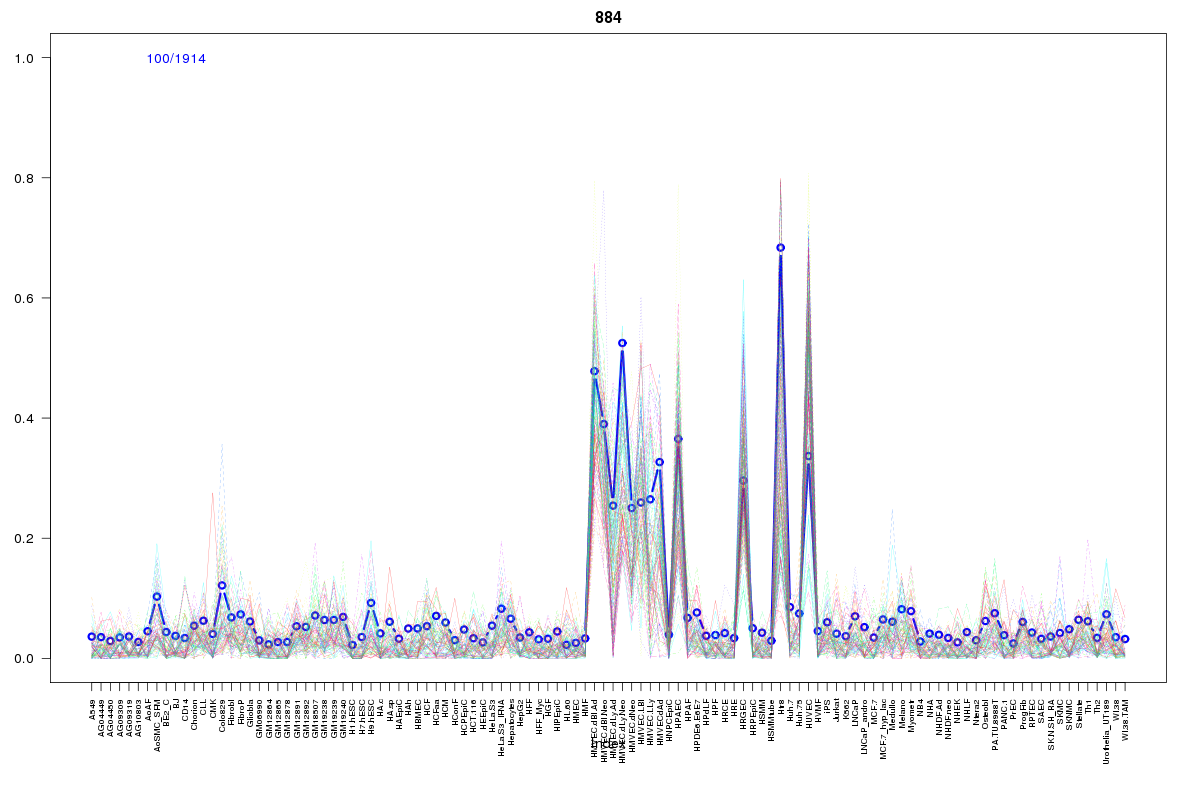 | 884 | 1 |
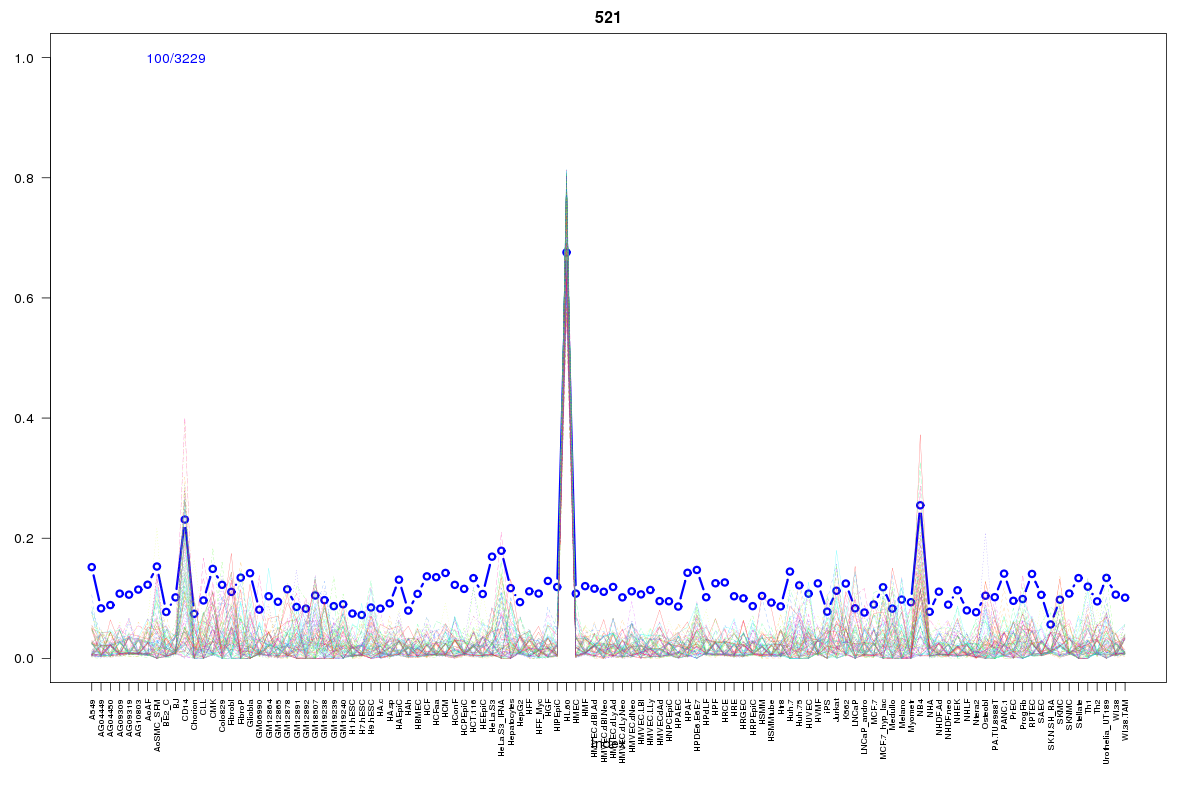 | 521 | 1 |
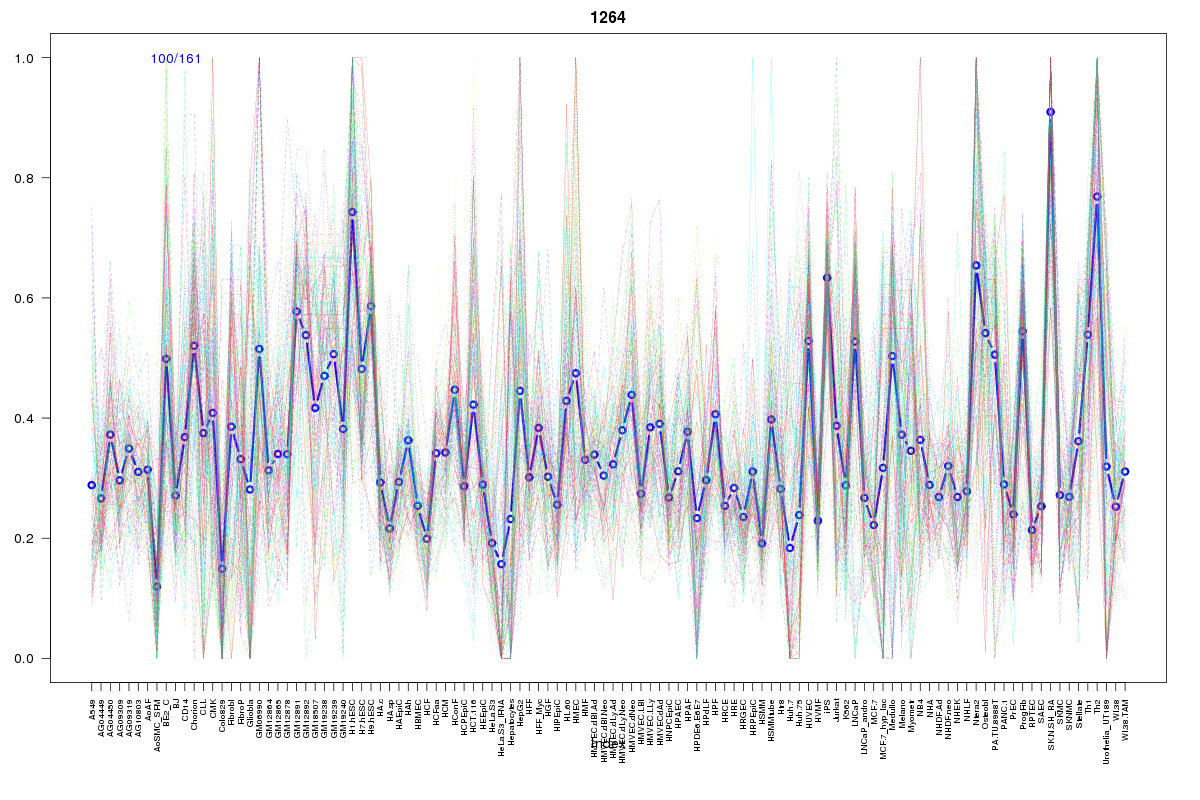 | 1264 | 1 |
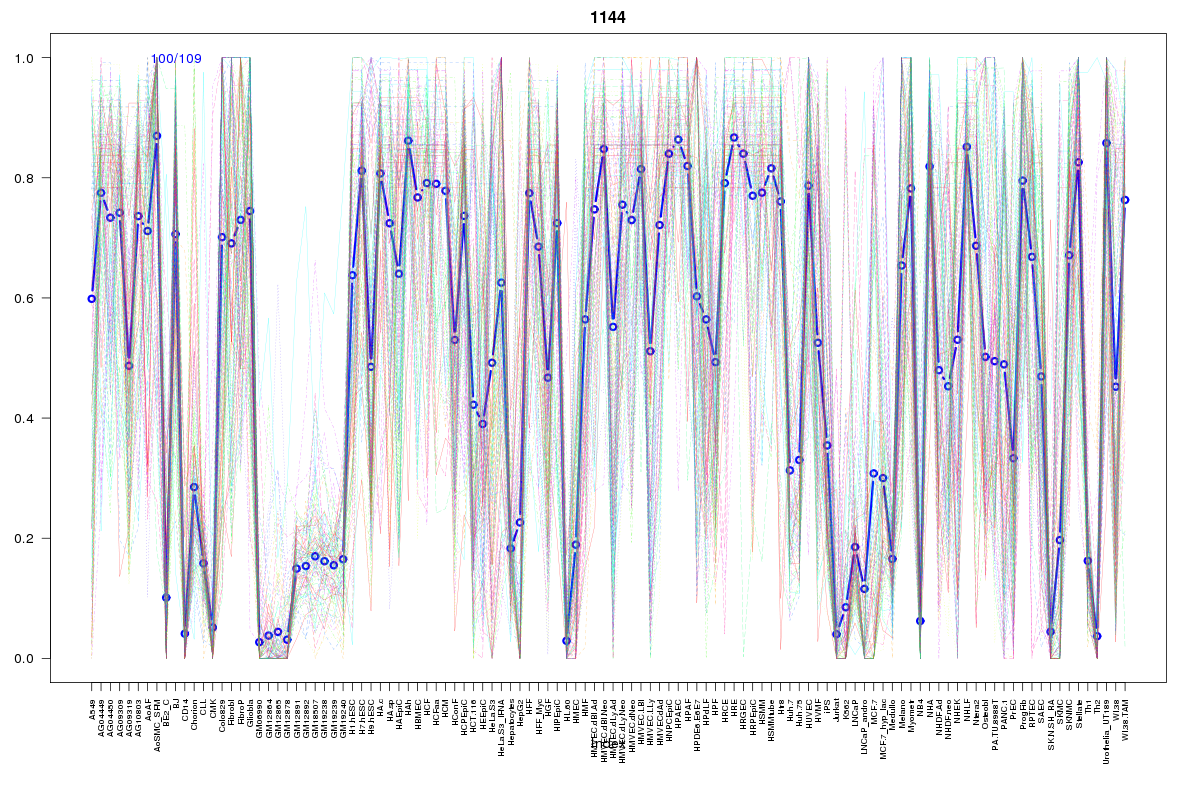 | 1144 | 1 |
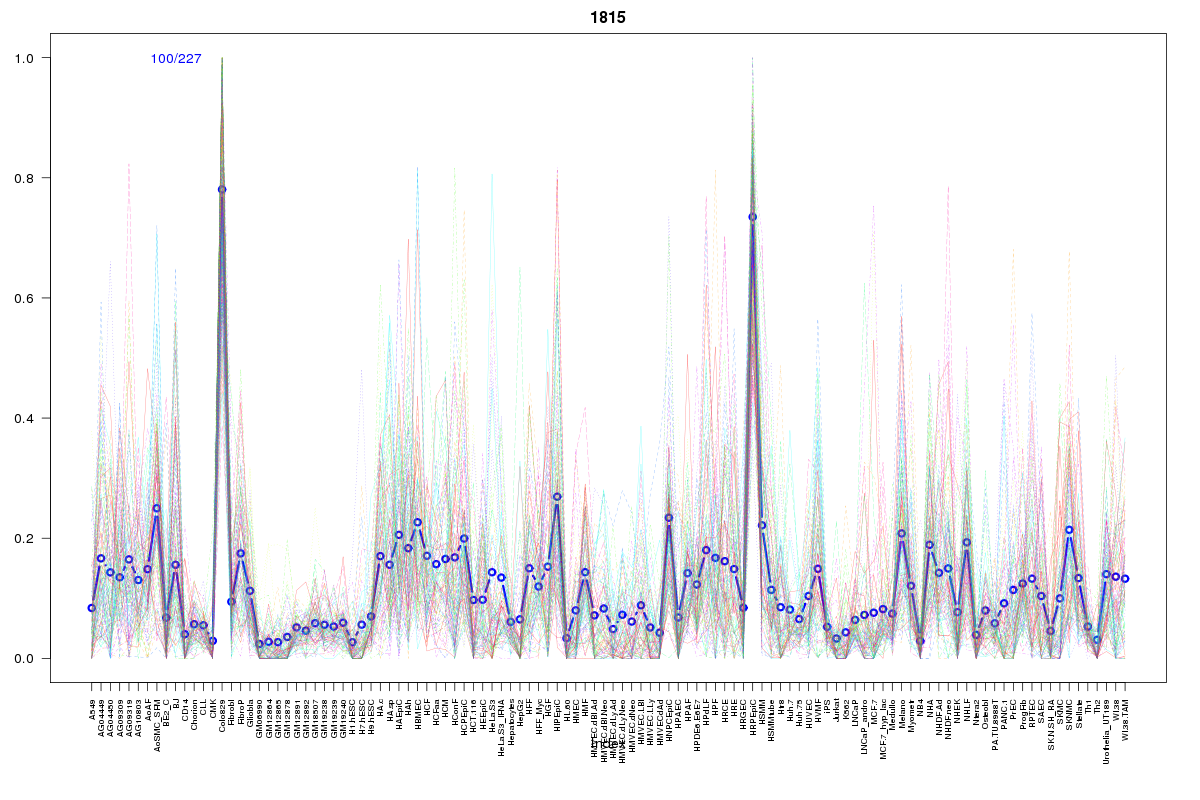 | 1815 | 1 |
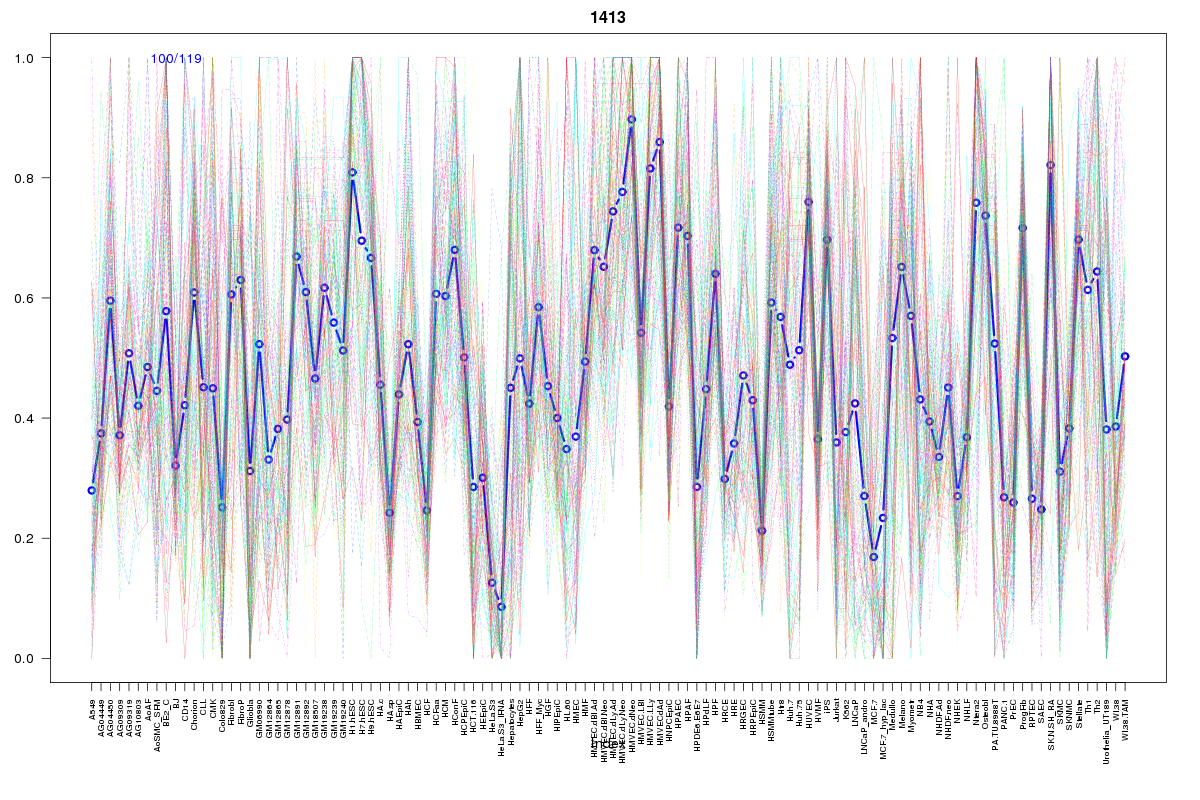 | 1413 | 1 |
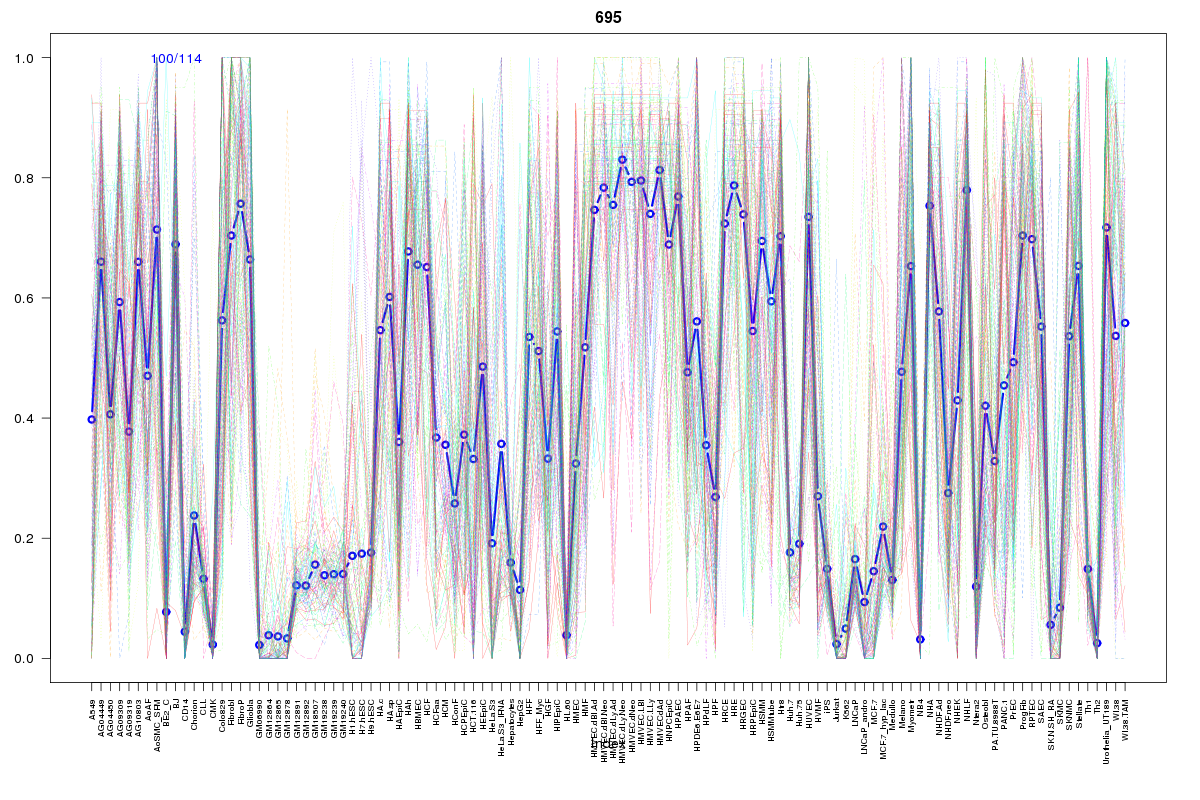 | 695 | 1 |
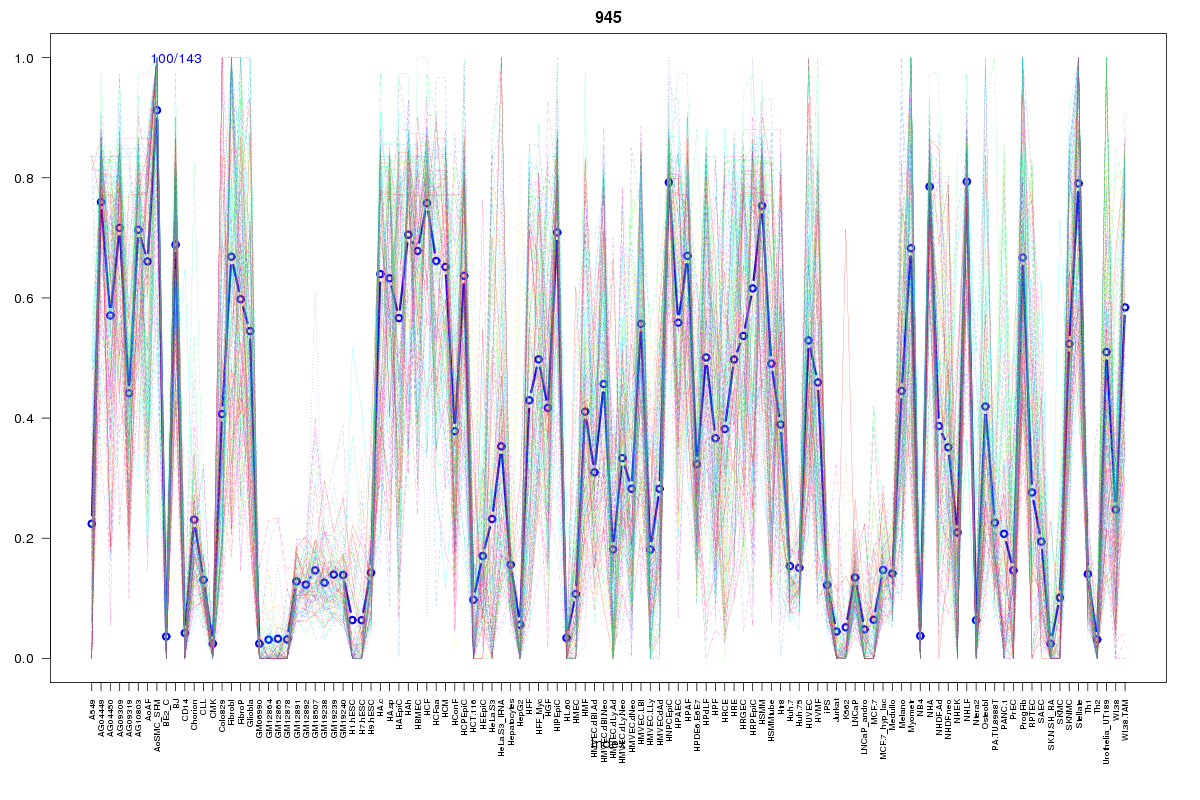 | 945 | 1 |
 | 2059 | 1 |
 | 979 | 1 |
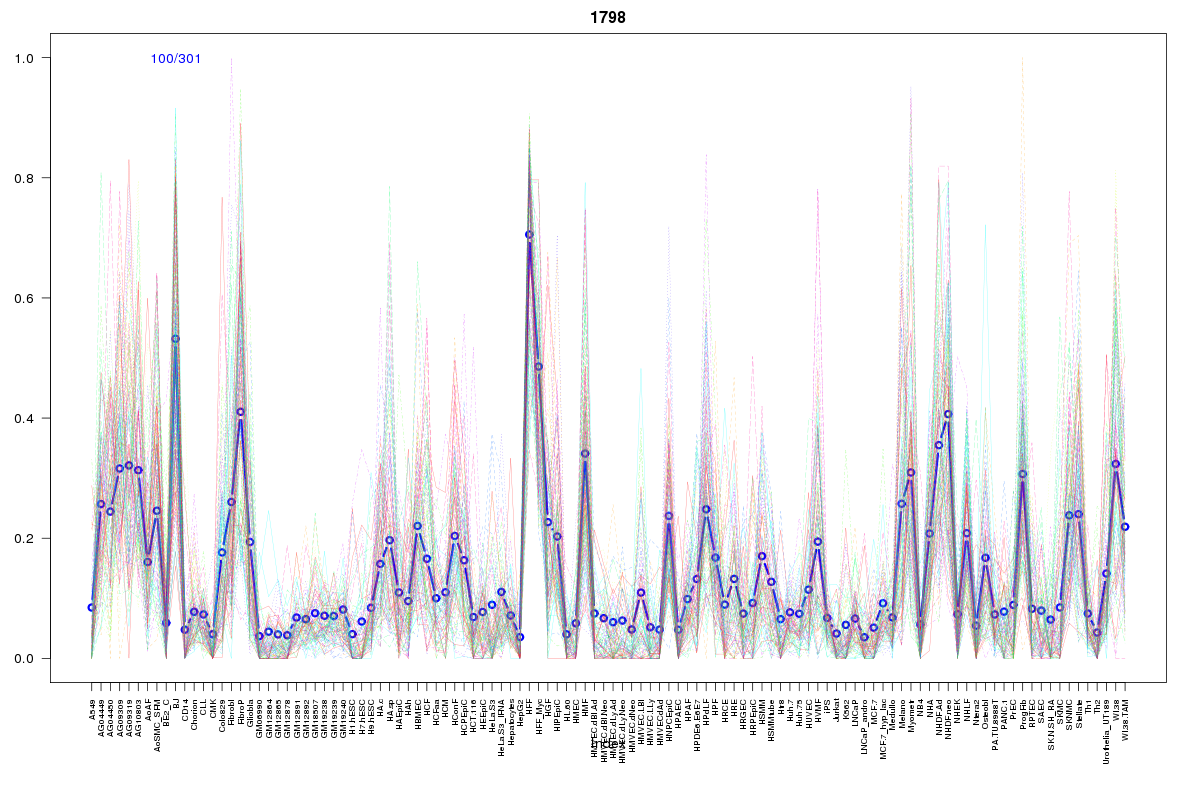 | 1798 | 1 |
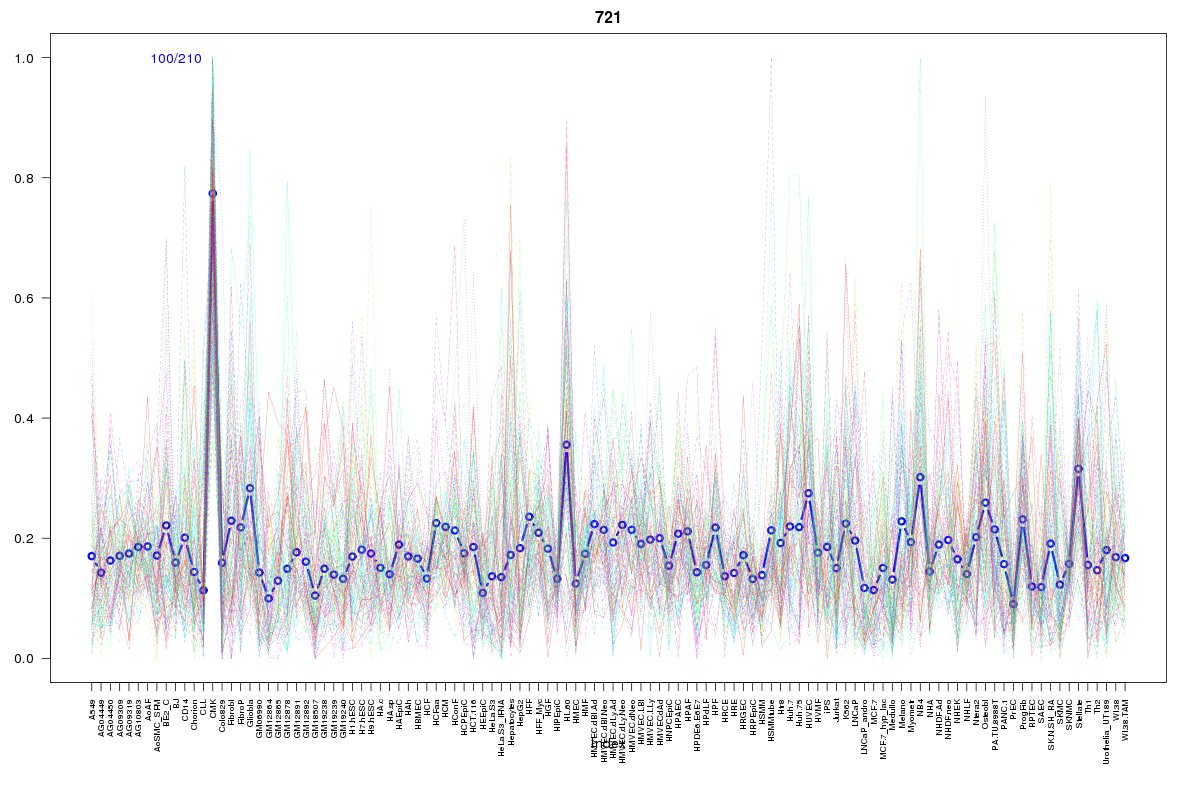 | 721 | 1 |
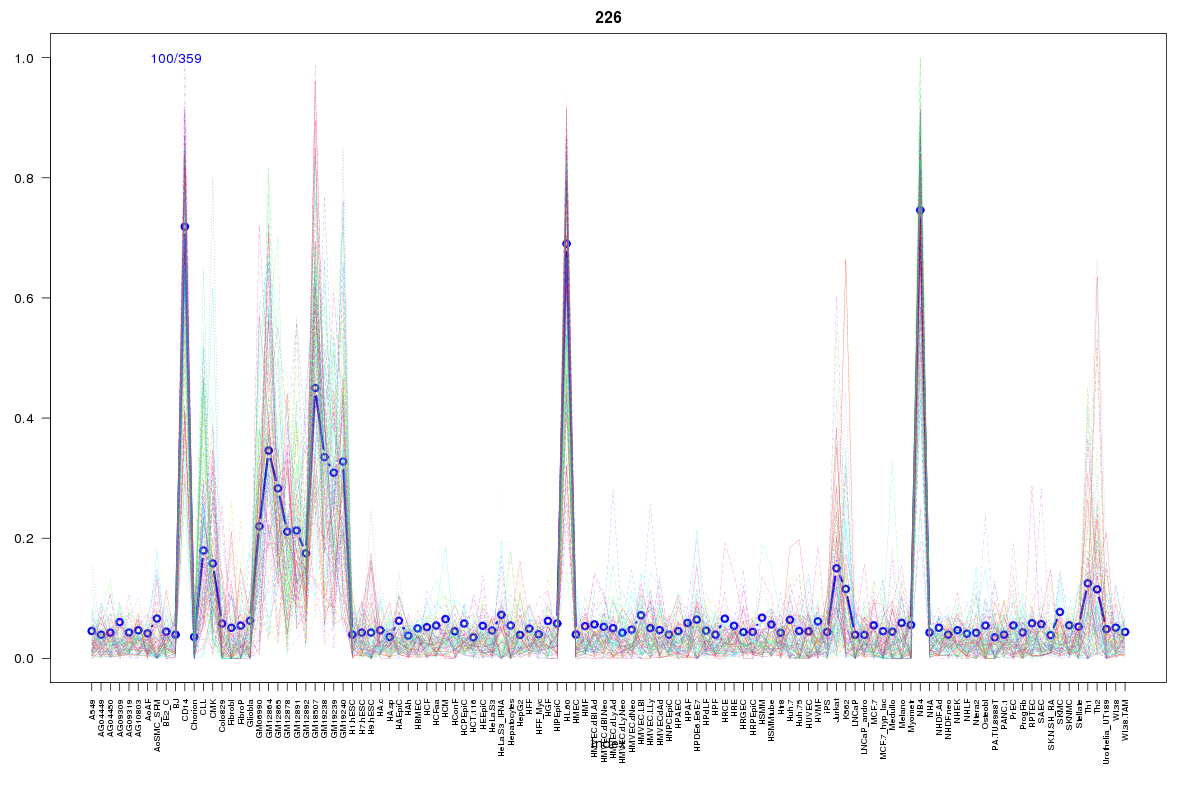 | 226 | 1 |
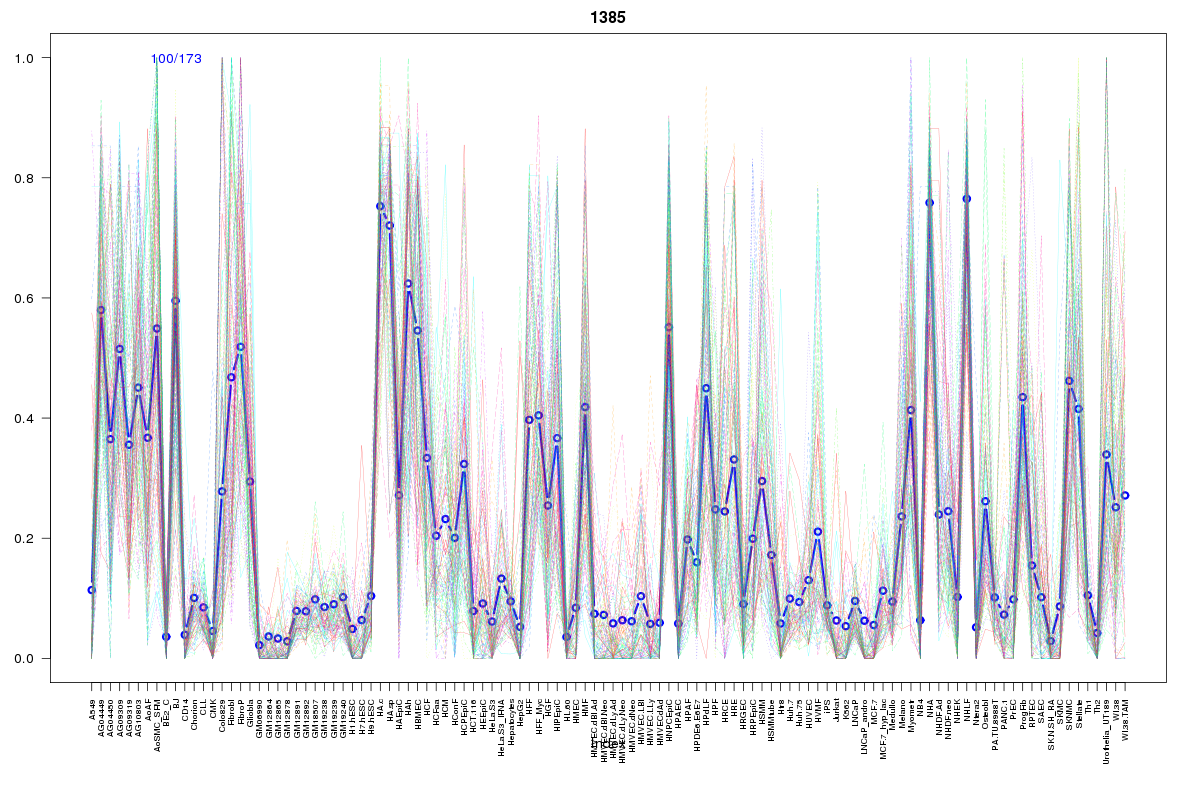 | 1385 | 1 |
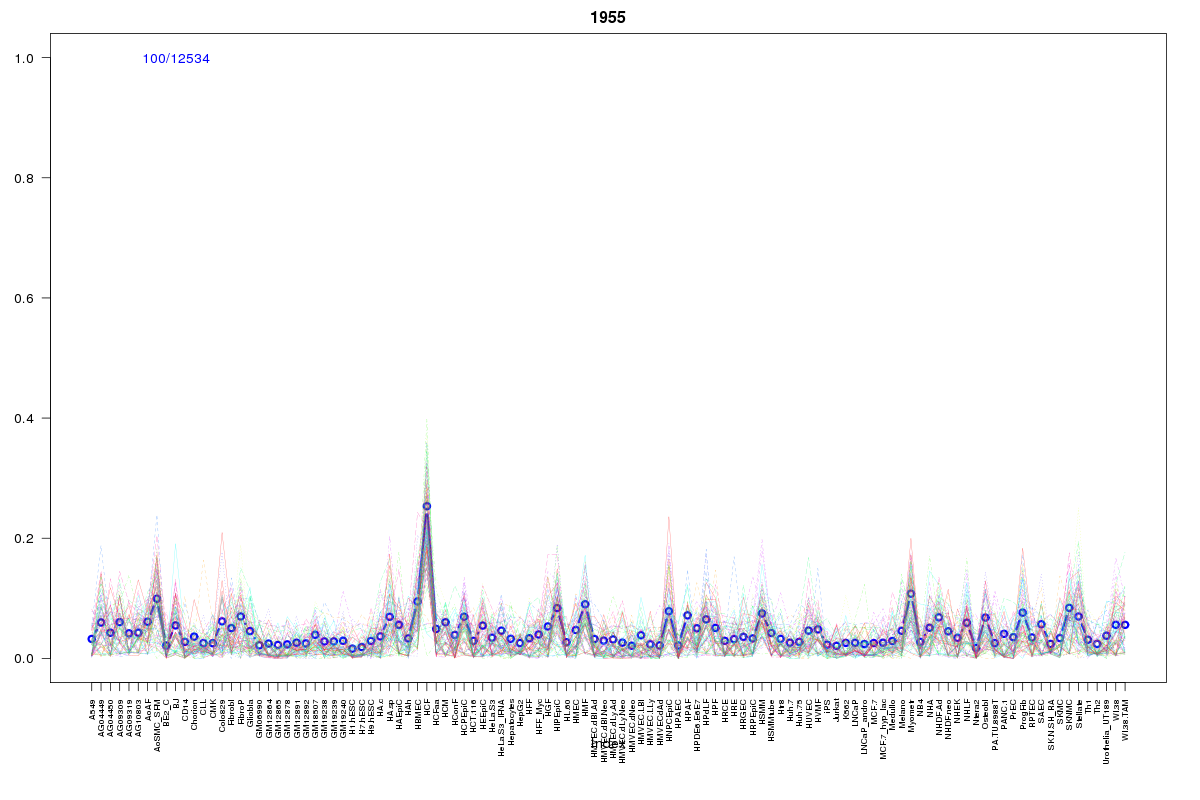 | 1955 | 1 |
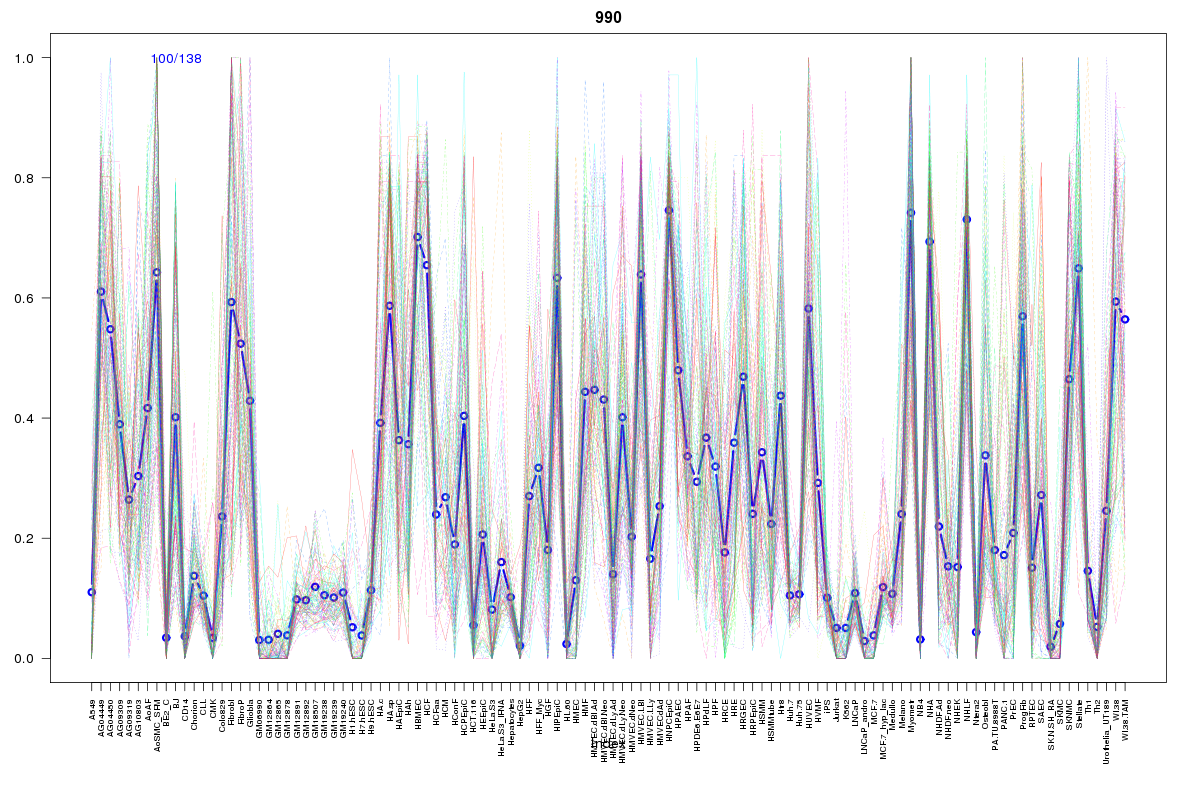 | 990 | 1 |
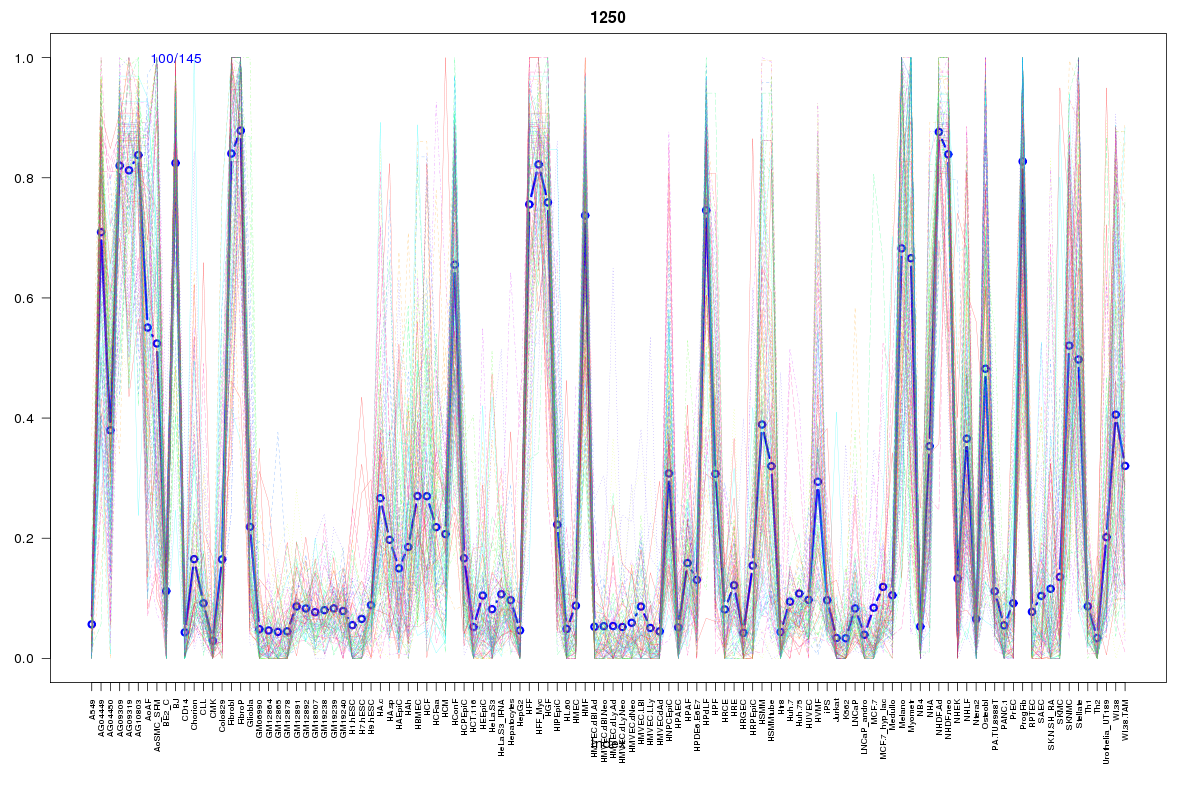 | 1250 | 1 |
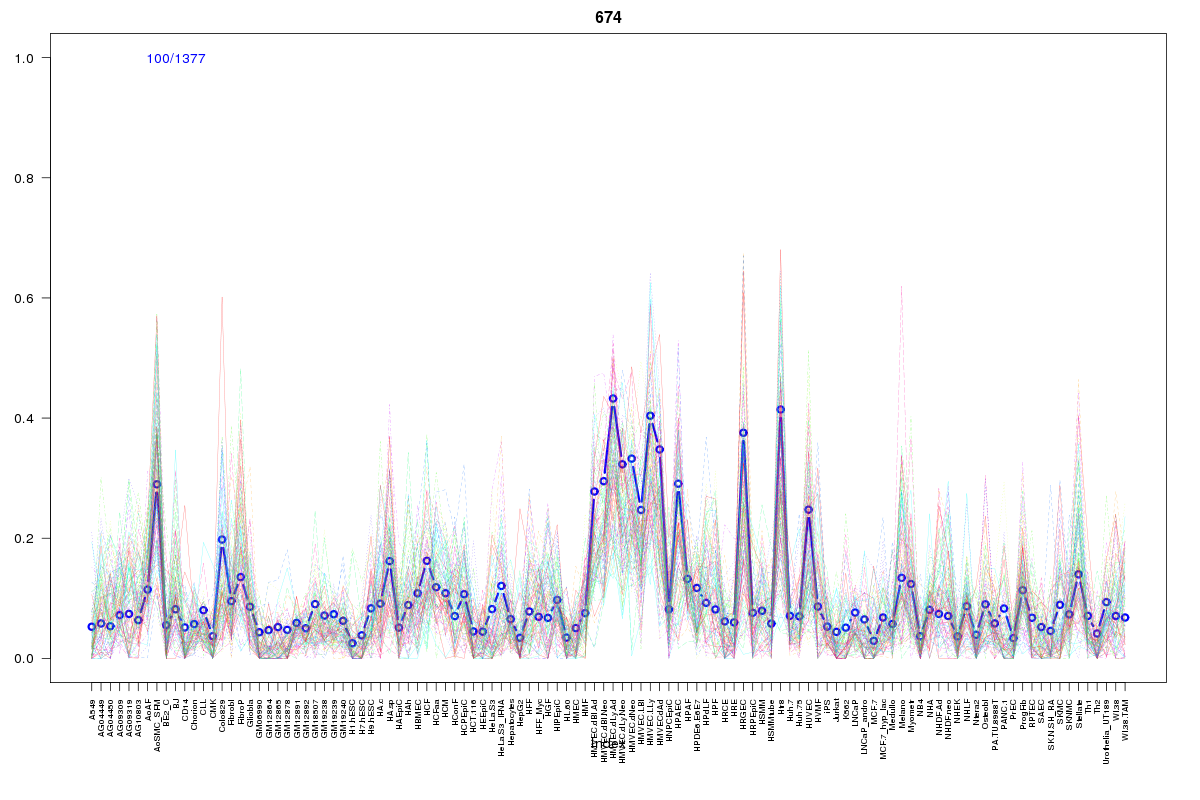 | 674 | 1 |
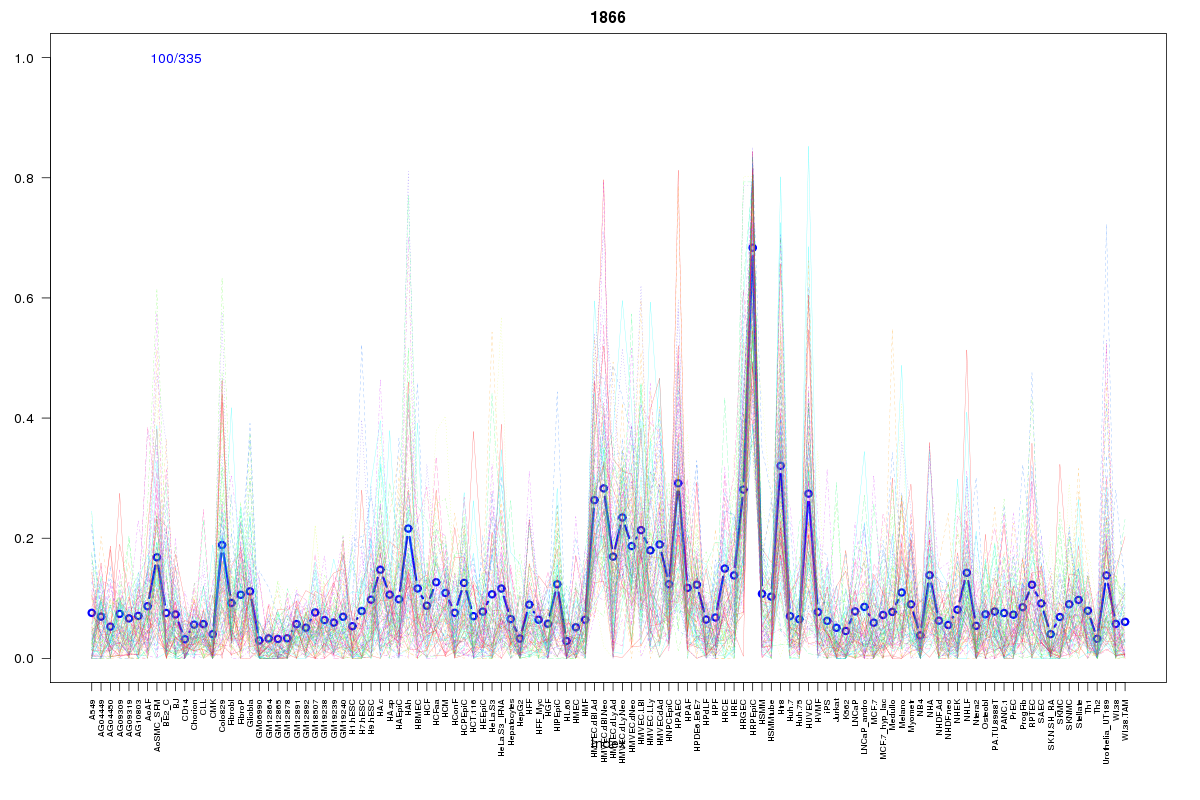 | 1866 | 1 |
Resources
BED file downloads
Connects to 46 DHS sitesTop 10 Correlated DHS Sites
p-values indiciate significant higher or lower correlationExternal Databases
UCSCEnsembl (ENSG00000117020)