Gene: PTCH2
chr1: 45285515-45308616Expression Profile
(log scale)
Graphical Connections
Distribution of linked clusters:
You may find it interesting if many of the connected DHS sites belong to the same cluster.| Cluster Profile | Cluster ID | Number of DHS sites in this cluster |
|---|---|---|
 | 629 | 2 |
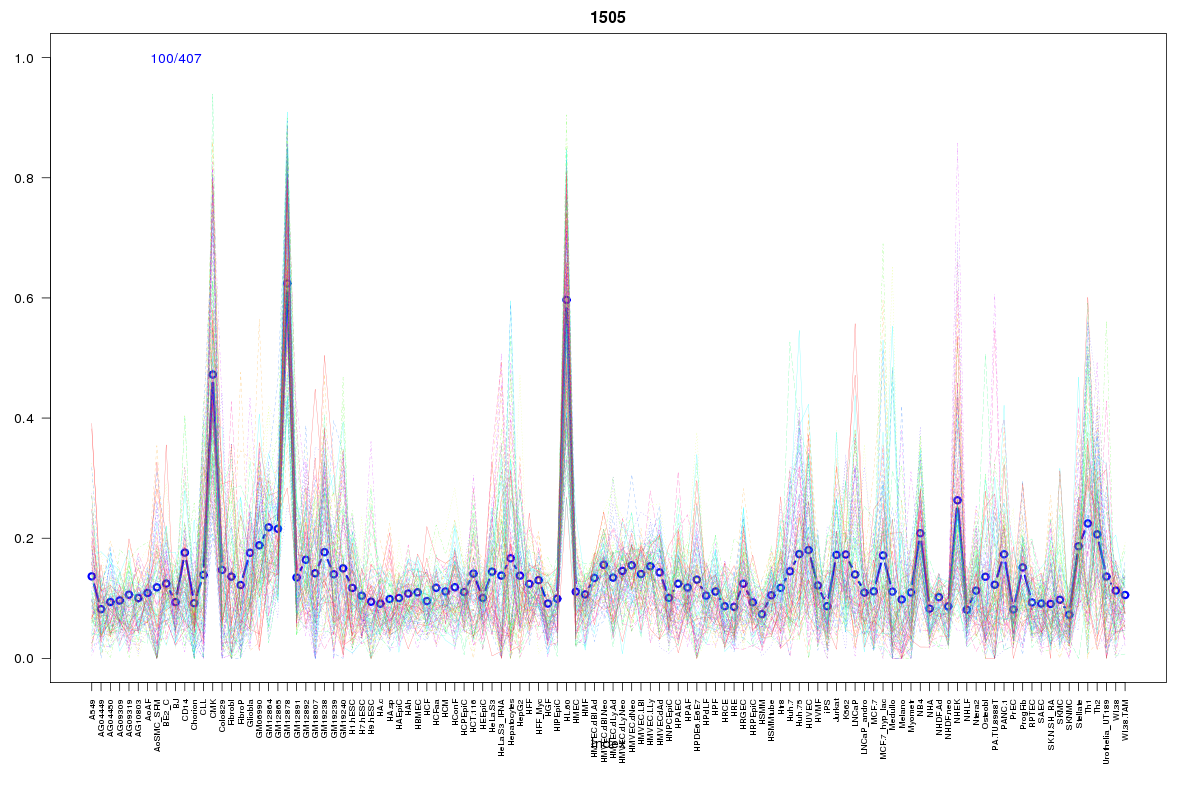 | 1505 | 2 |
 | 15 | 2 |
 | 569 | 1 |
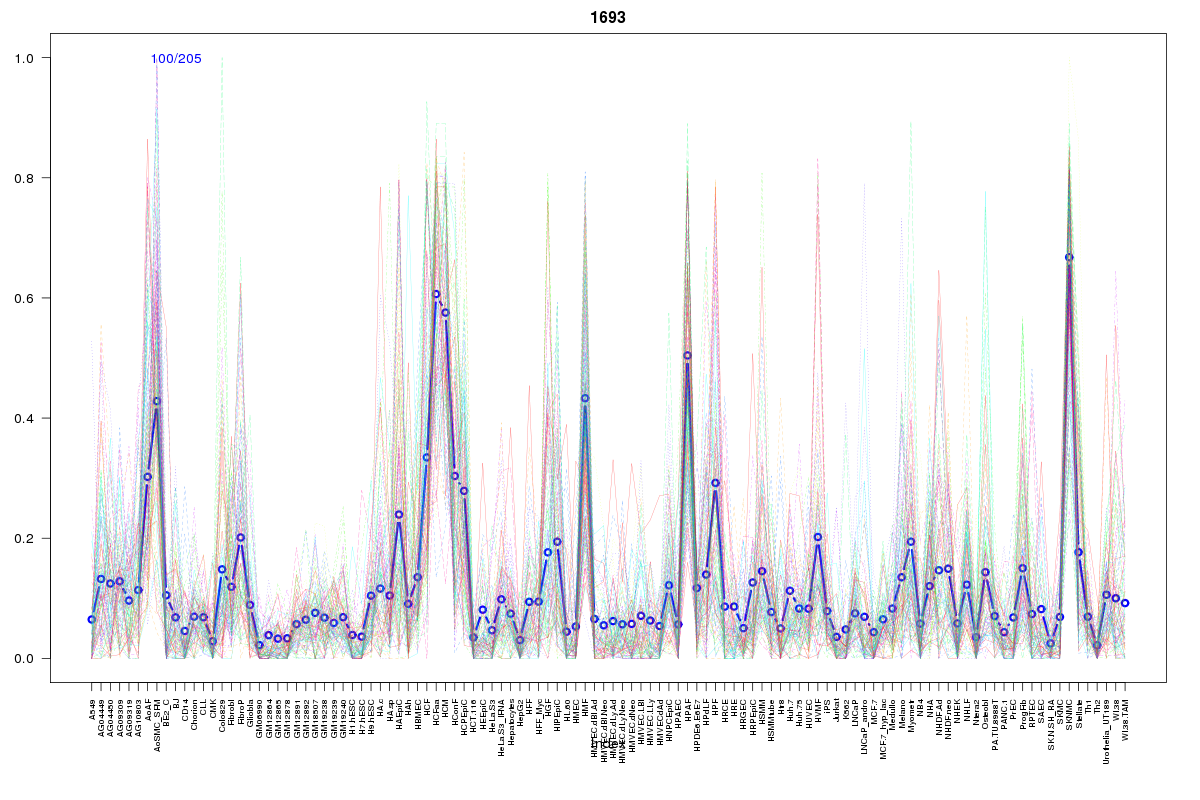 | 1693 | 1 |
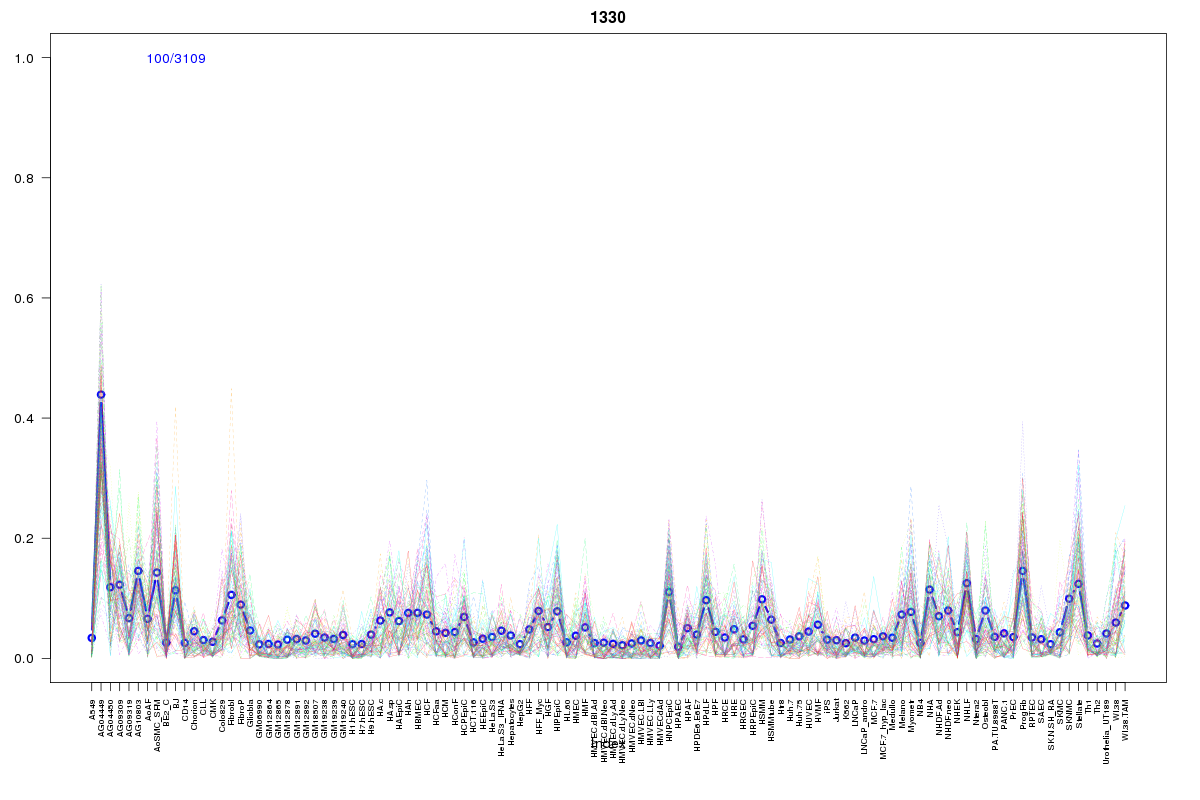 | 1330 | 1 |
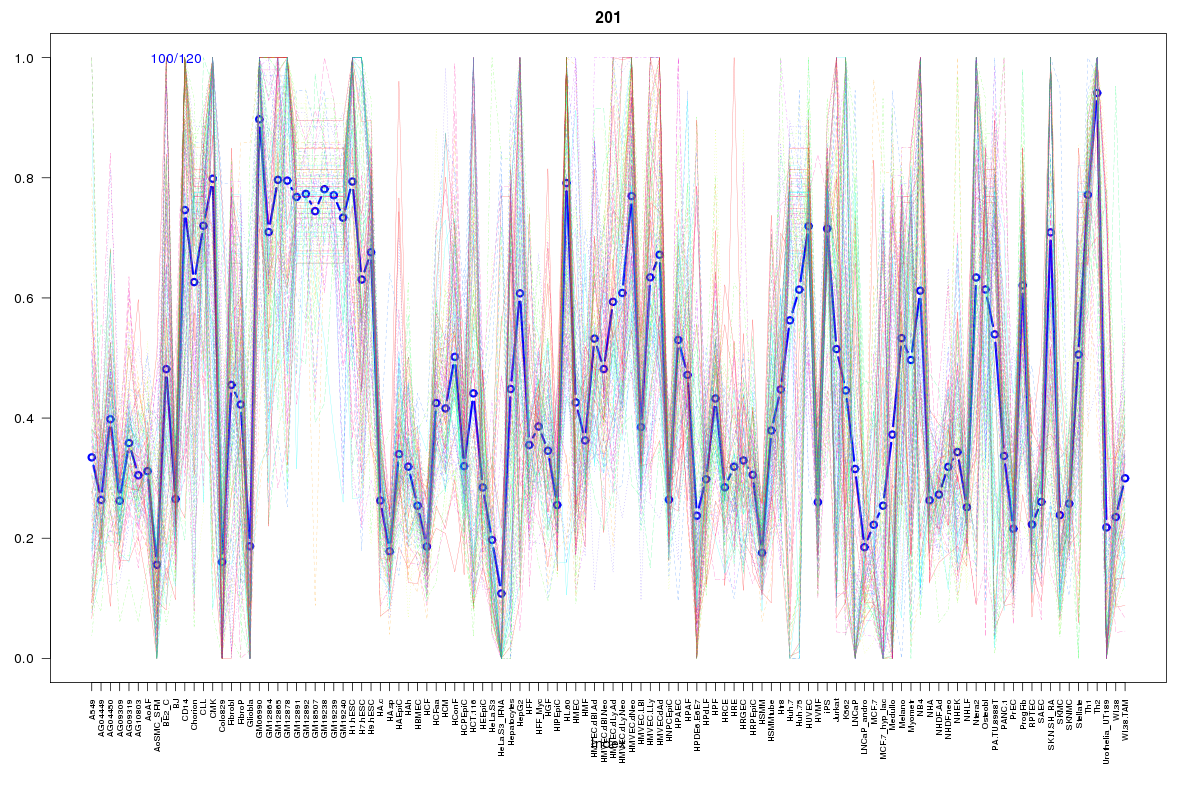 | 201 | 1 |
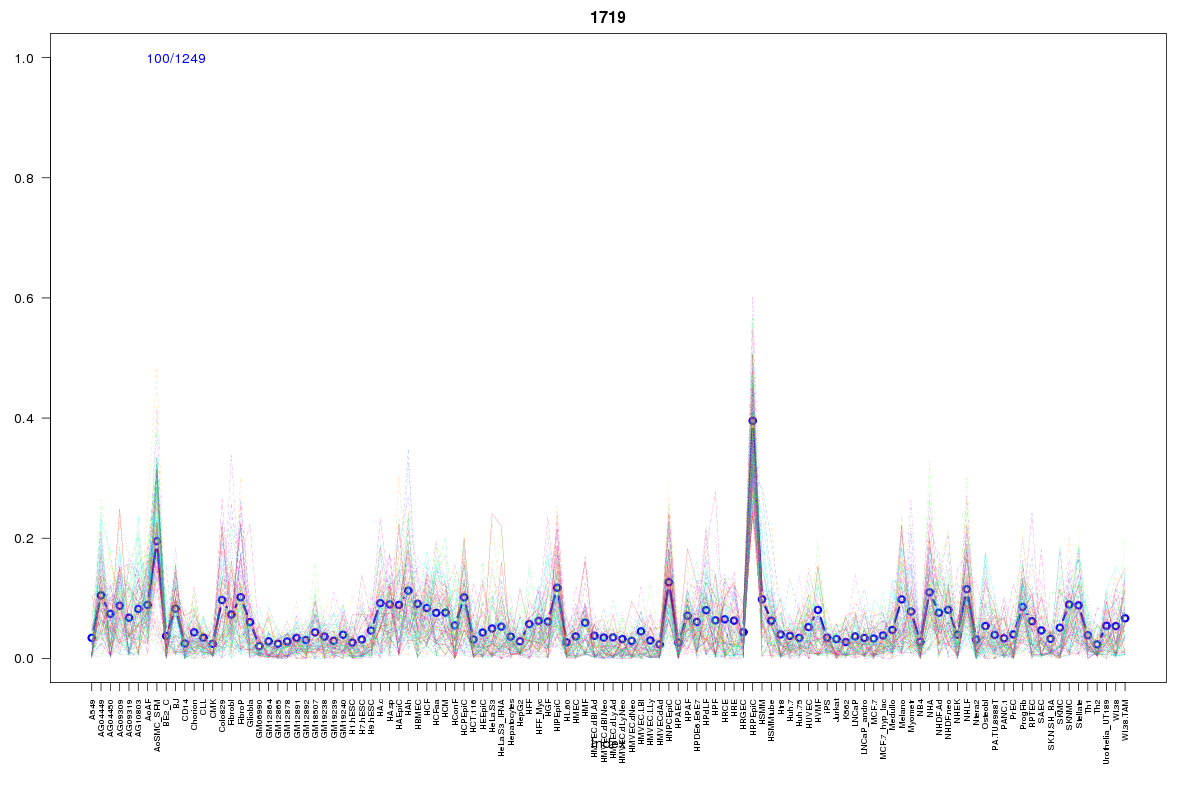 | 1719 | 1 |
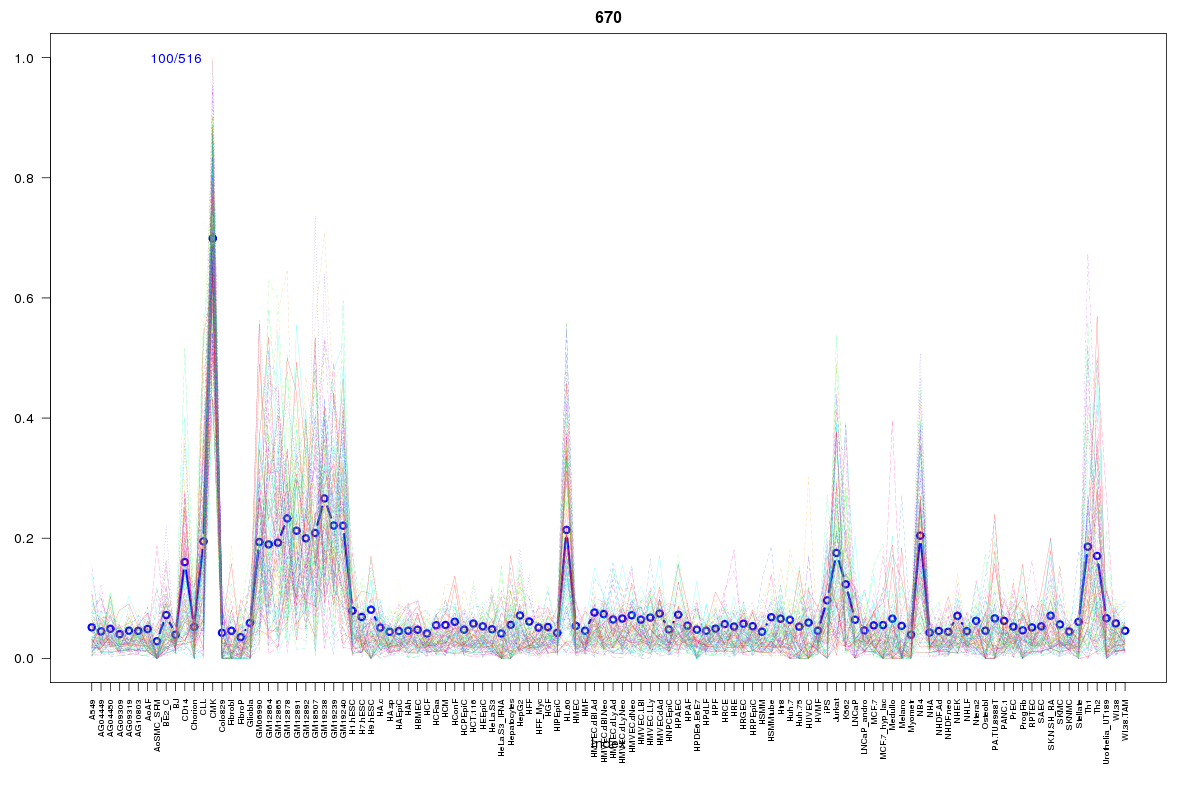 | 670 | 1 |
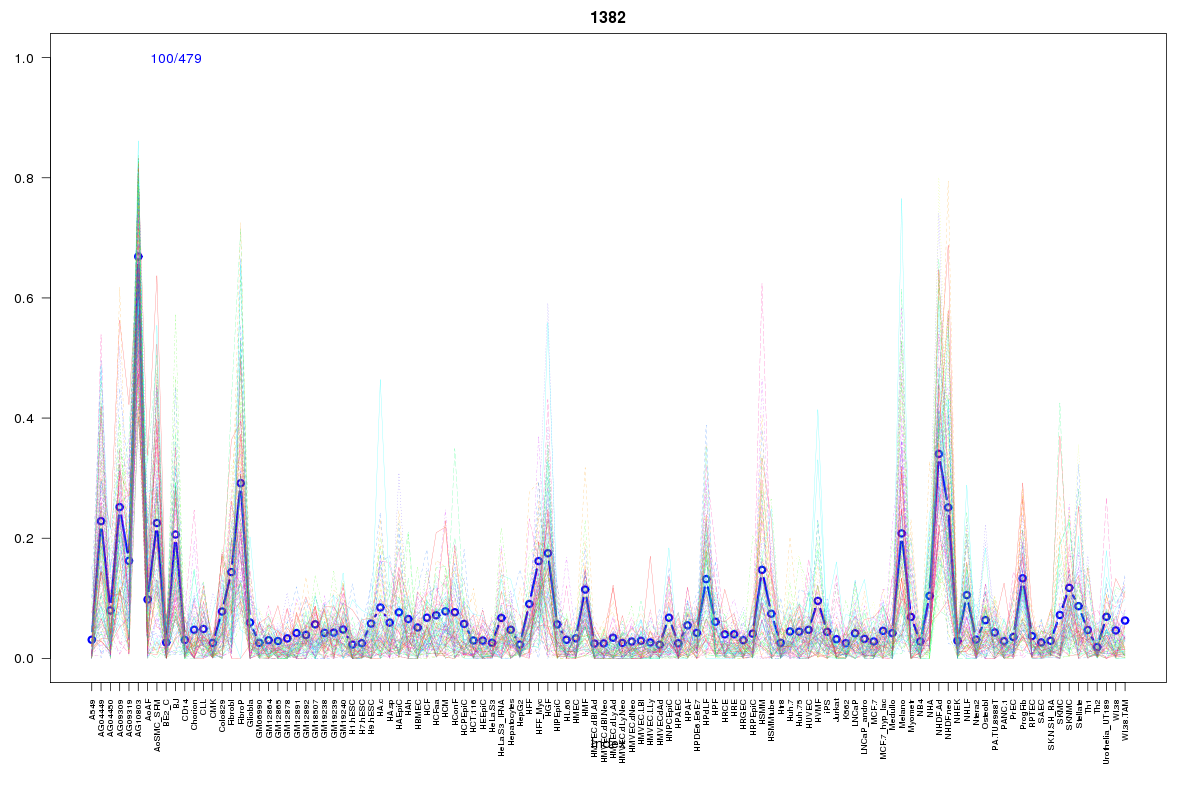 | 1382 | 1 |
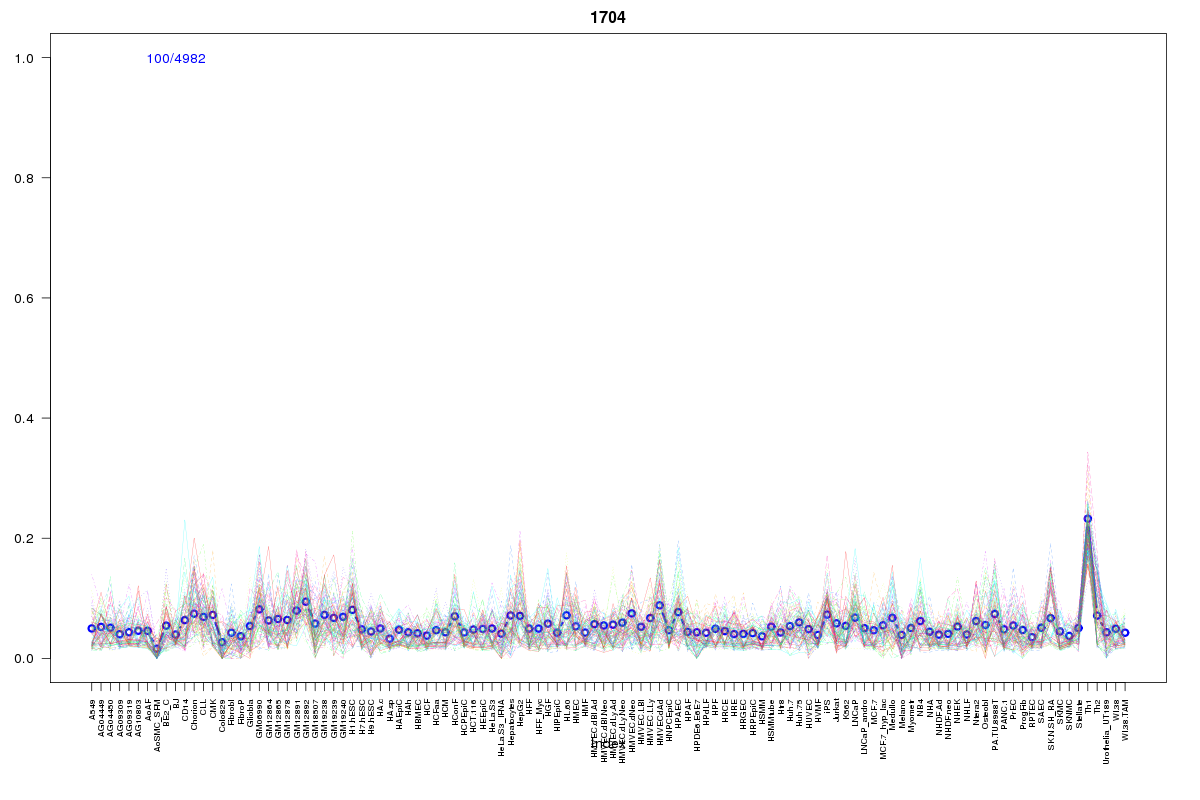 | 1704 | 1 |
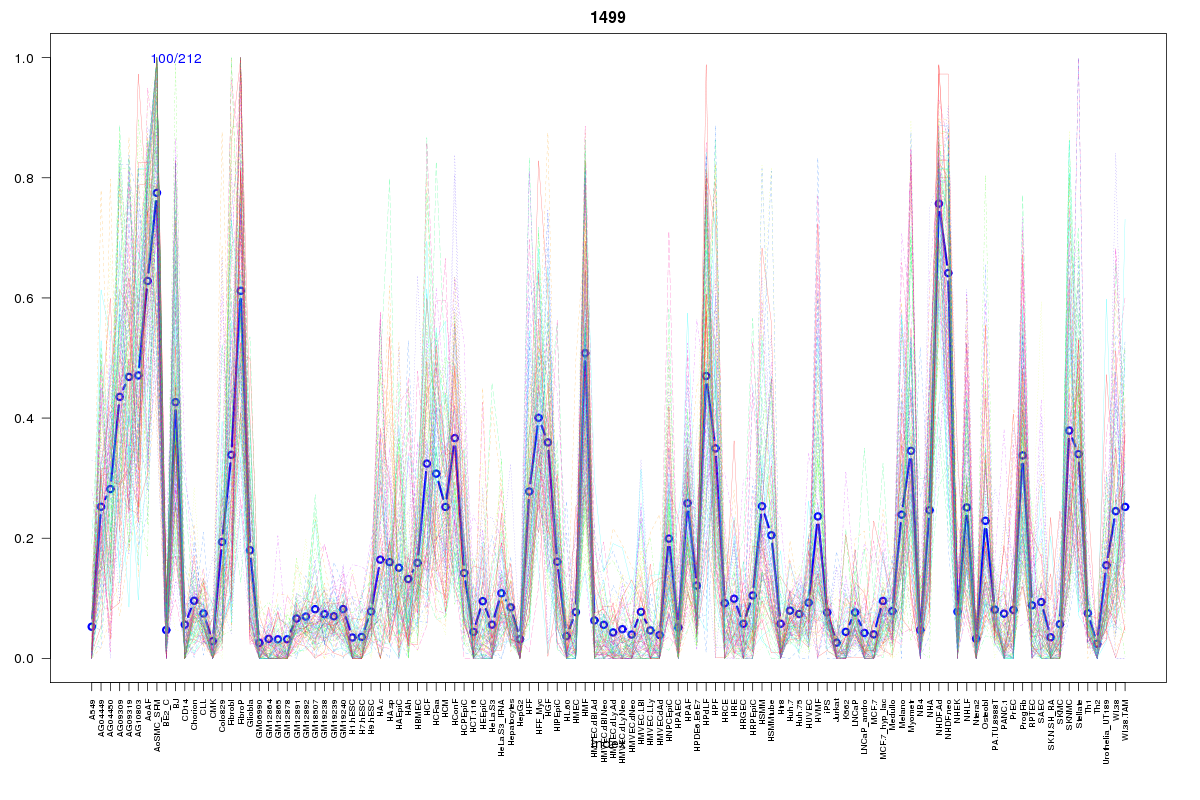 | 1499 | 1 |
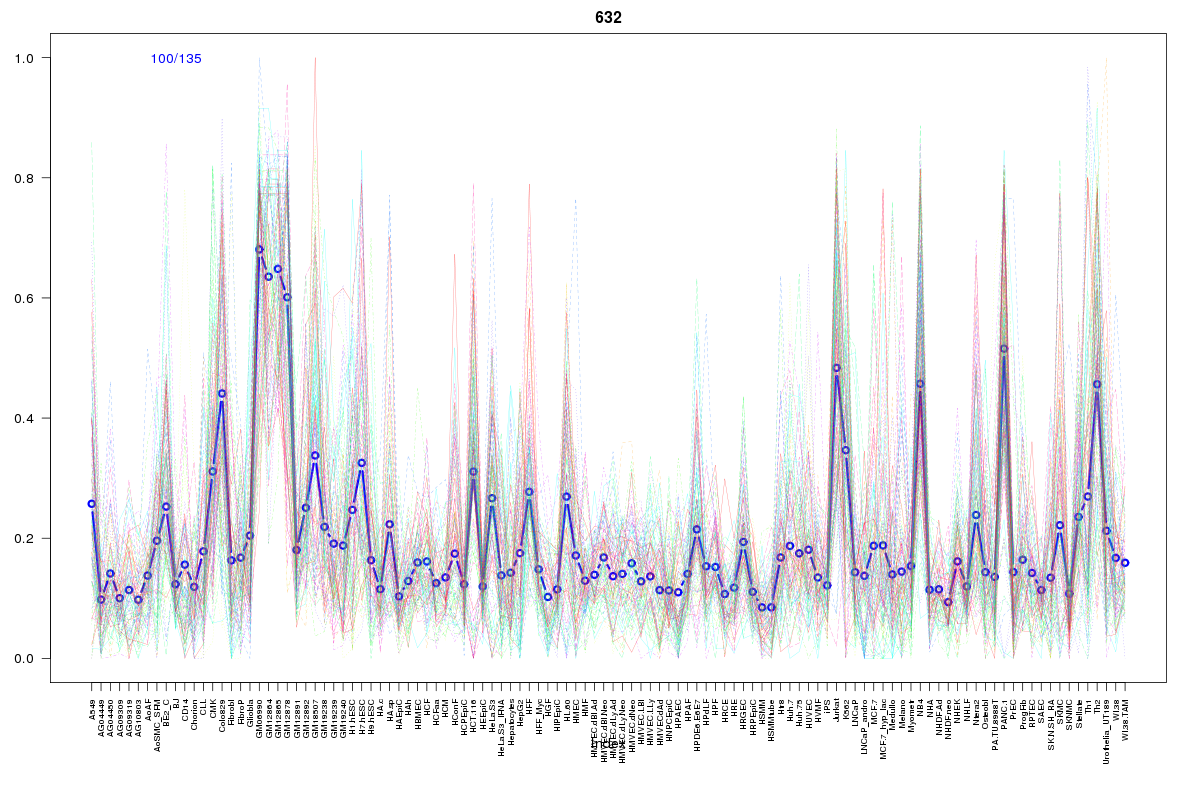 | 632 | 1 |
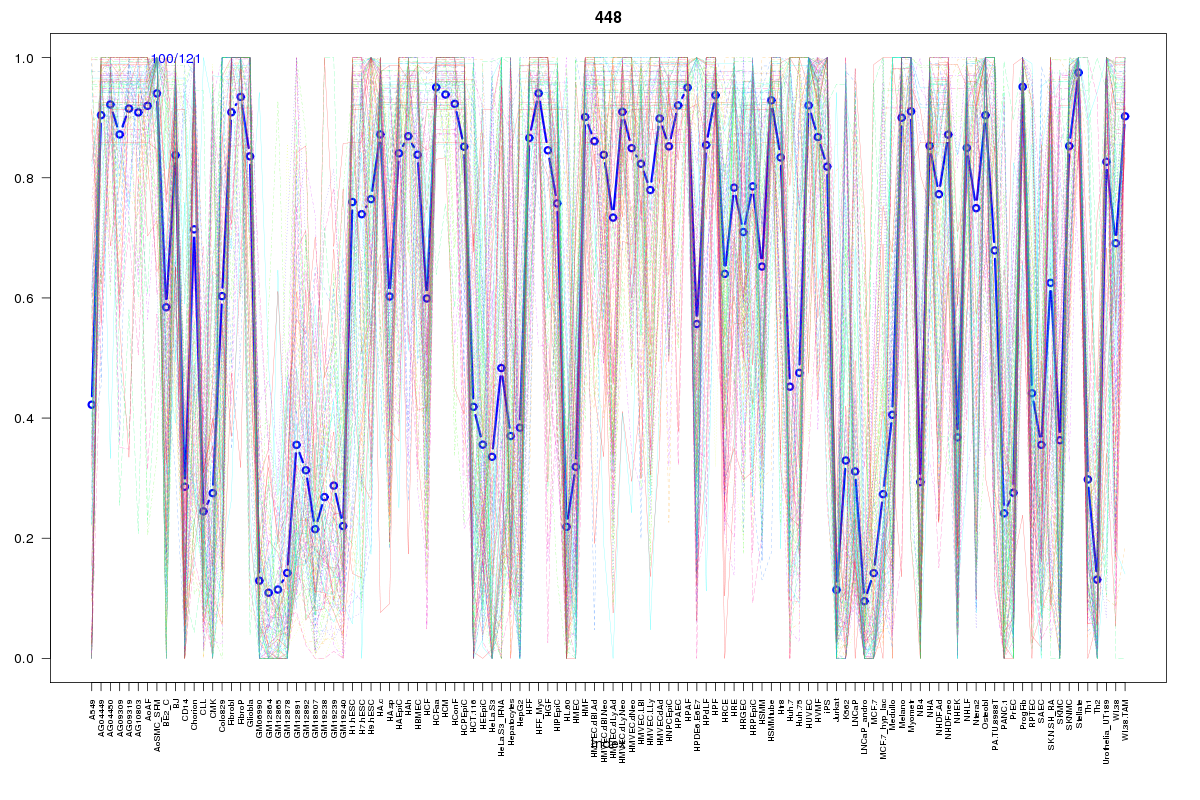 | 448 | 1 |
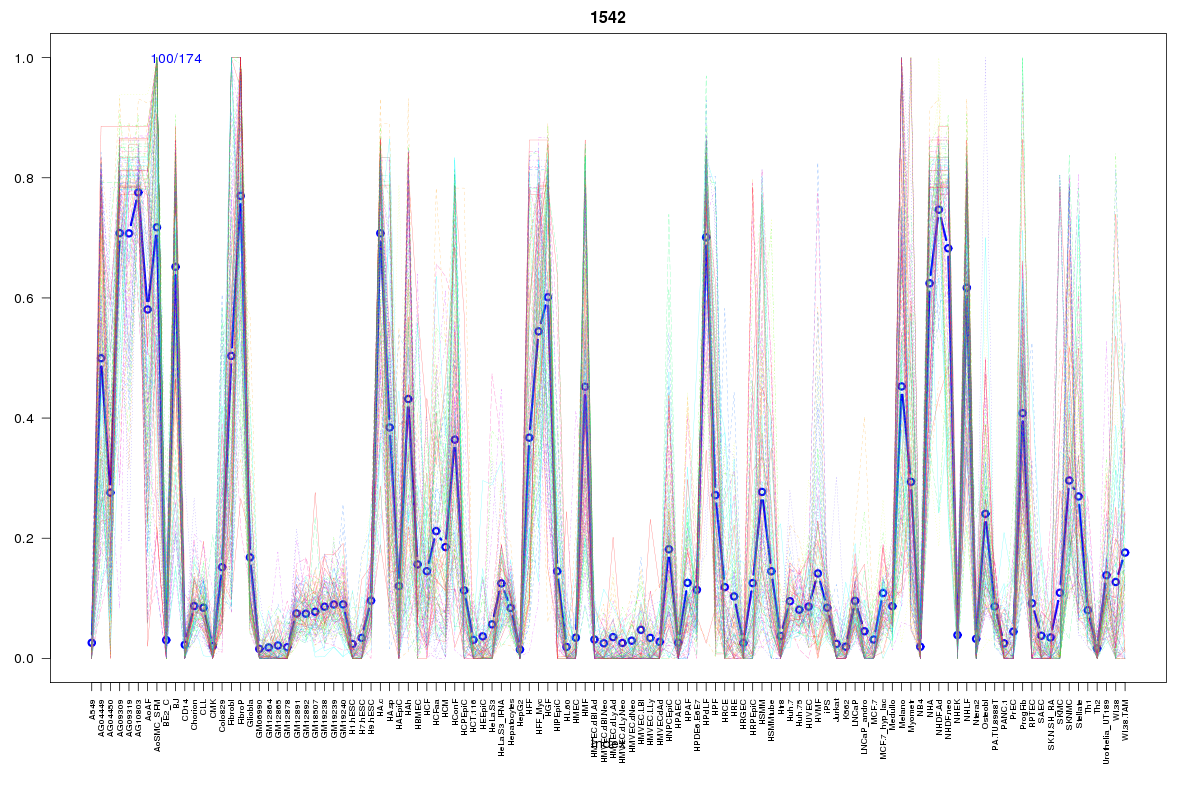 | 1542 | 1 |
 | 192 | 1 |
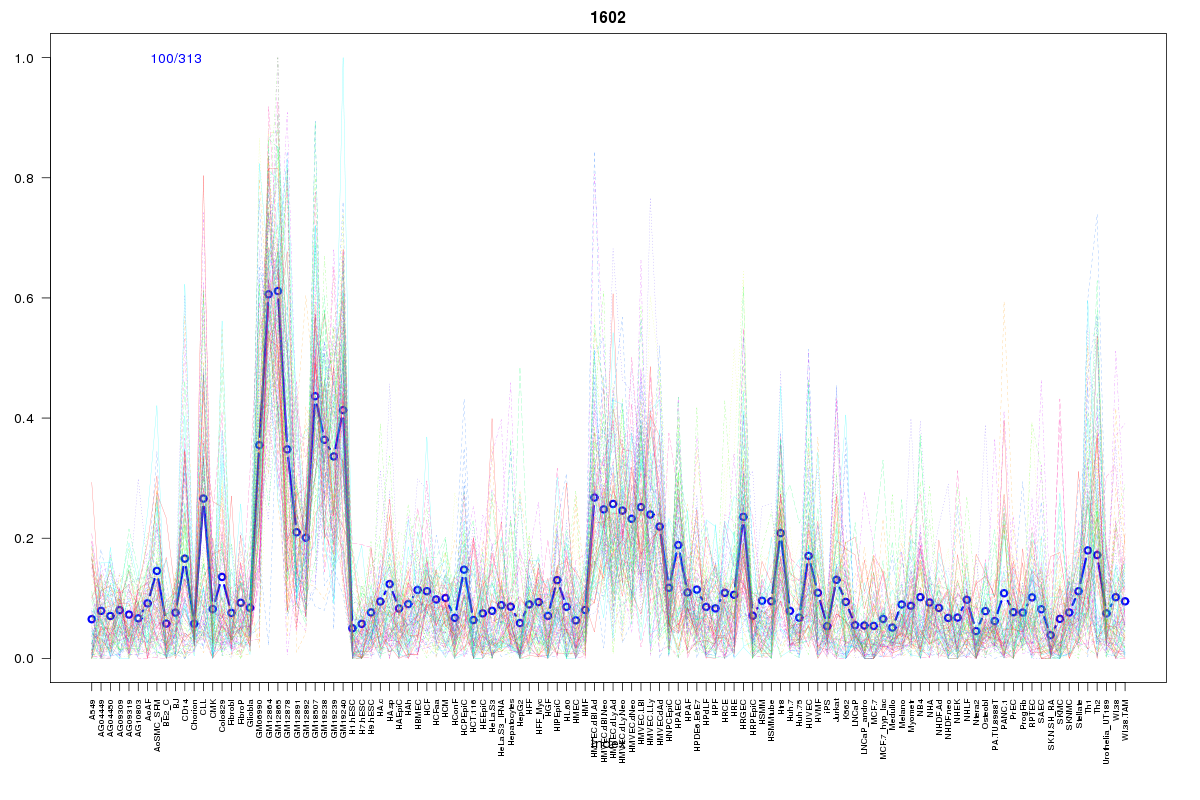 | 1602 | 1 |
 | 2062 | 1 |
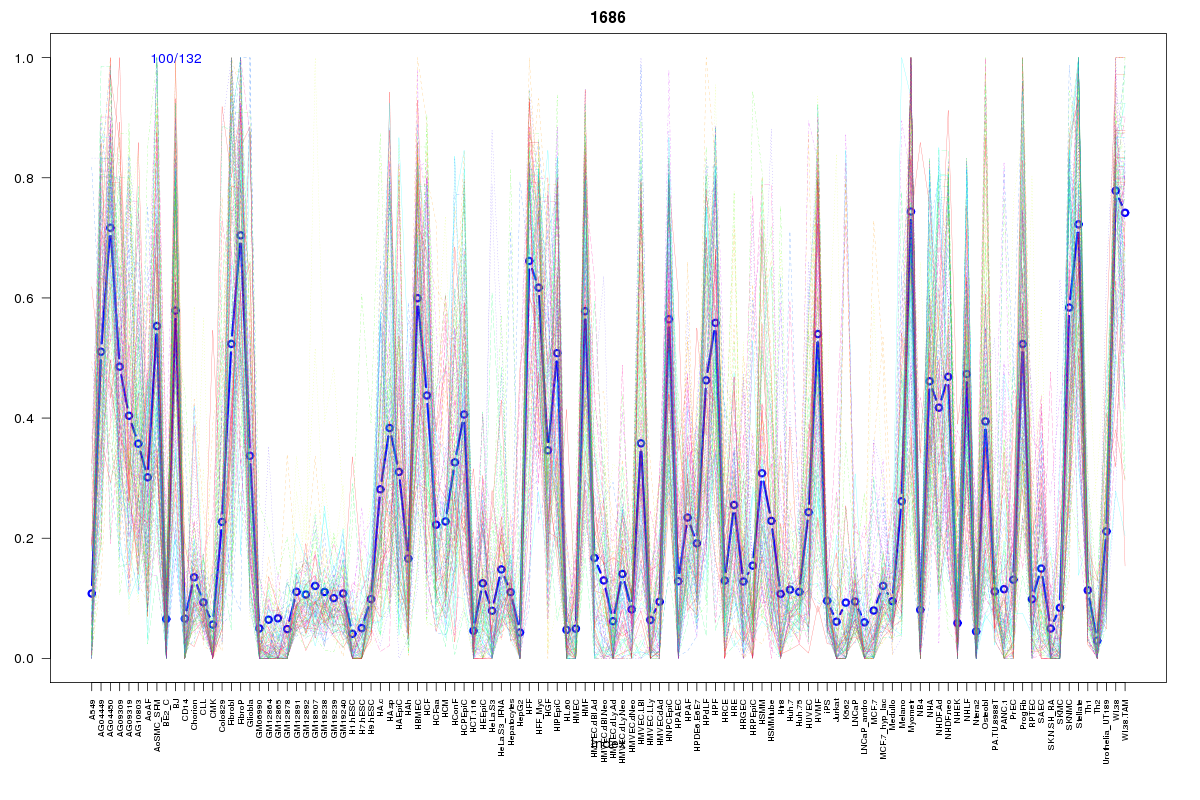 | 1686 | 1 |
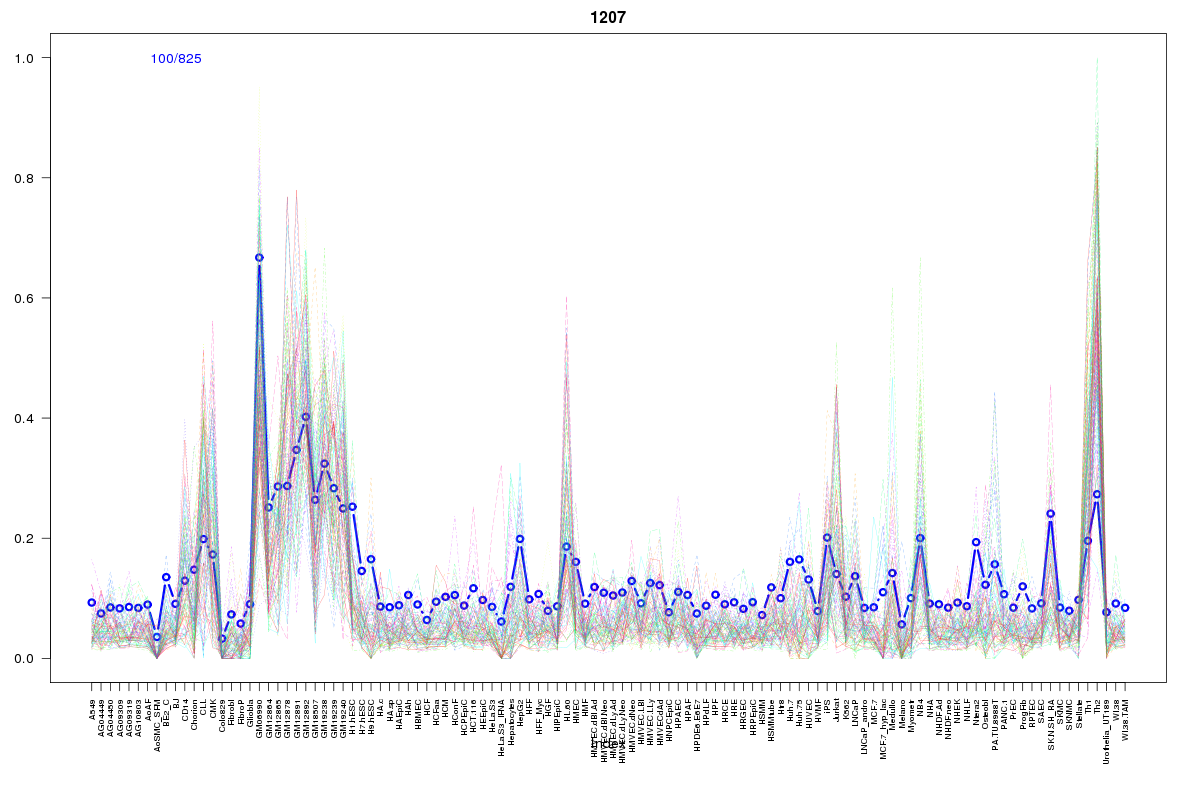 | 1207 | 1 |
 | 186 | 1 |
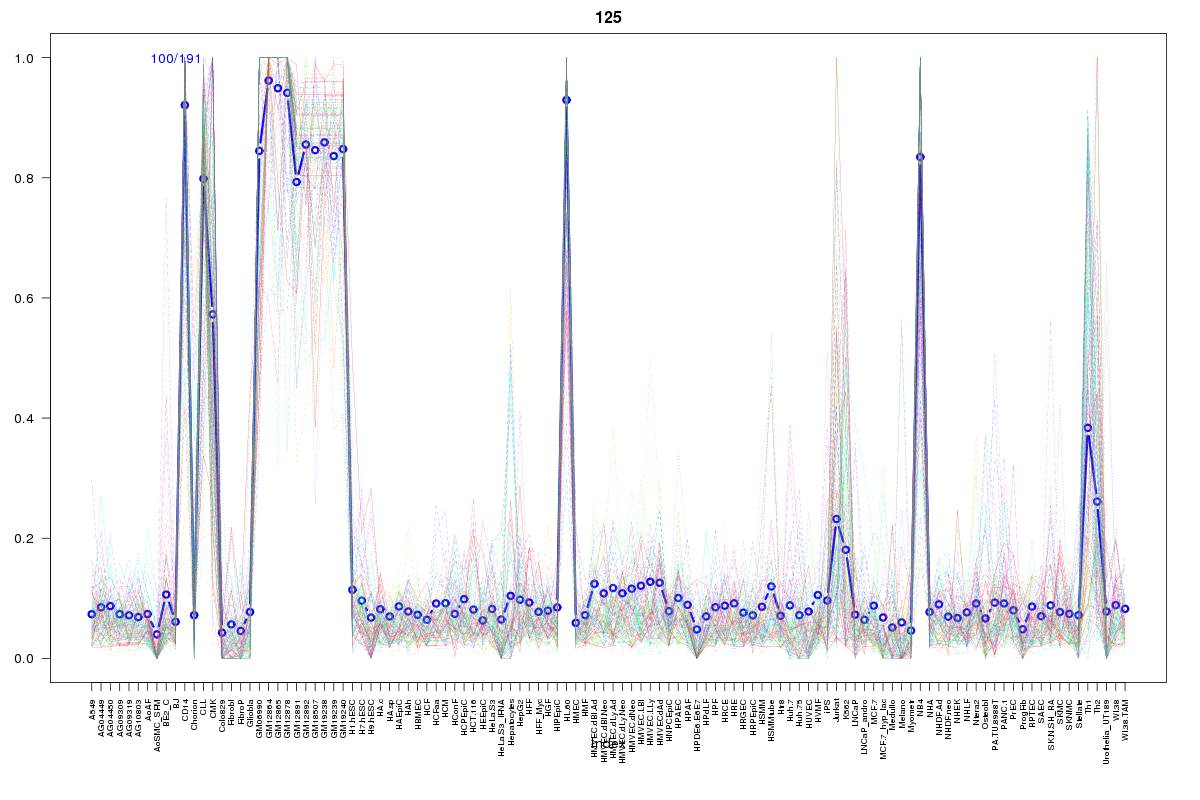 | 125 | 1 |
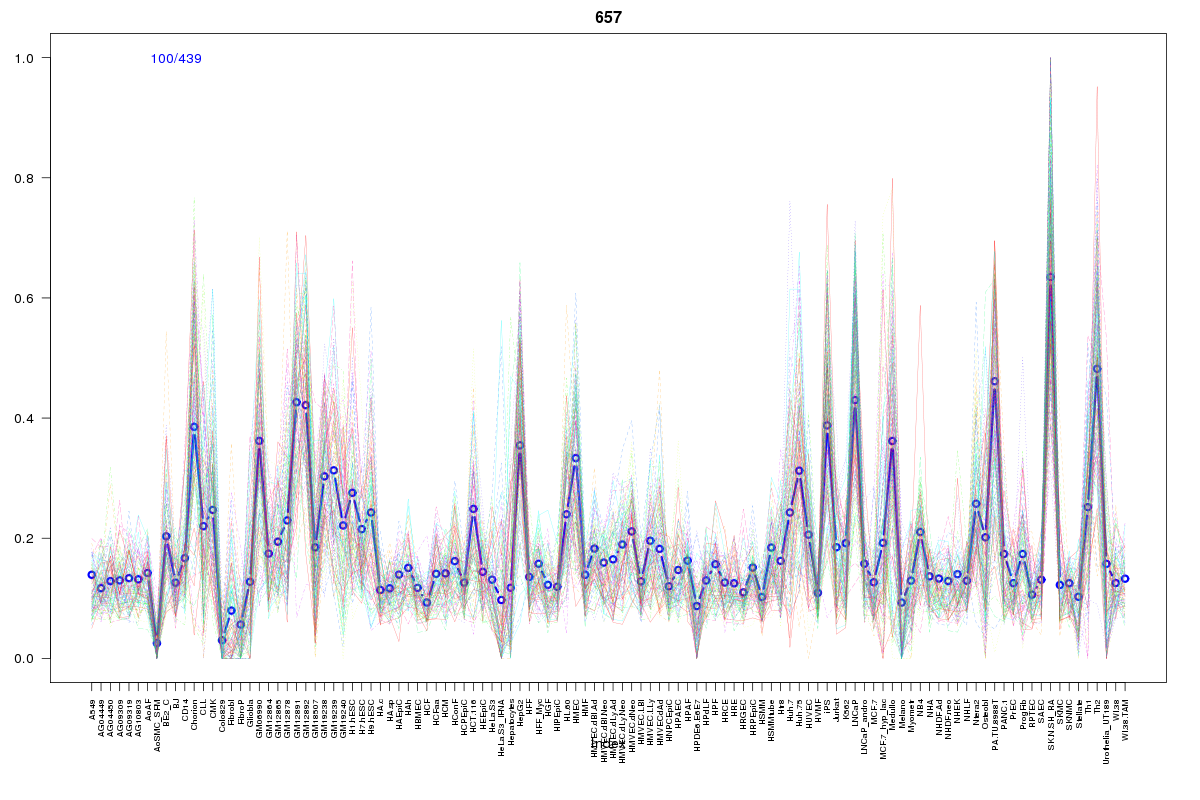 | 657 | 1 |
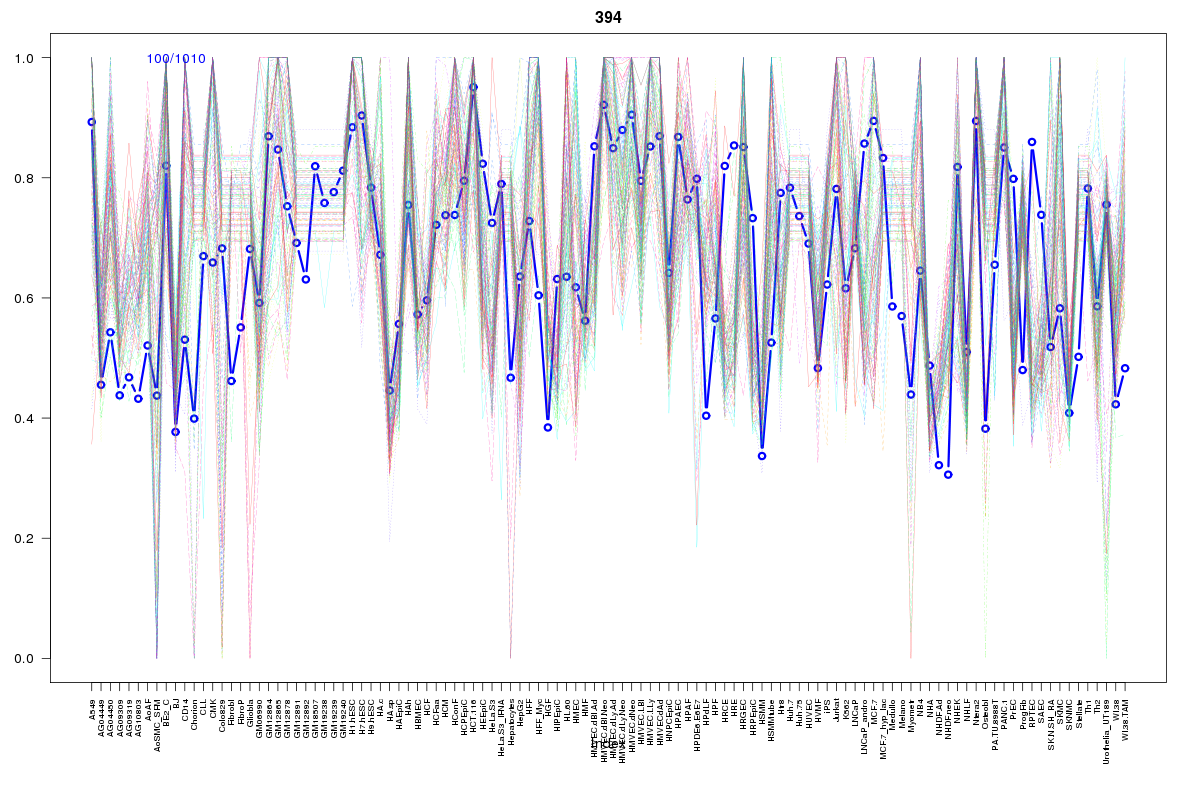 | 394 | 1 |
 | 282 | 1 |
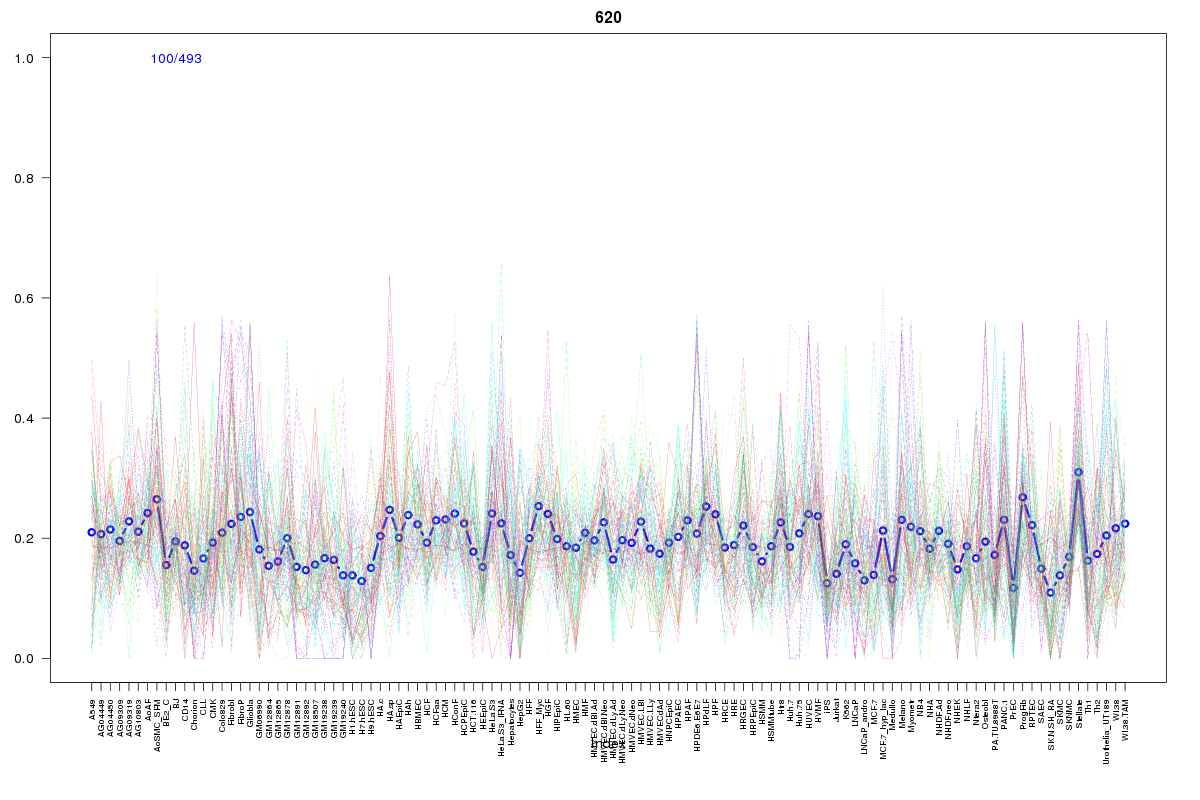 | 620 | 1 |
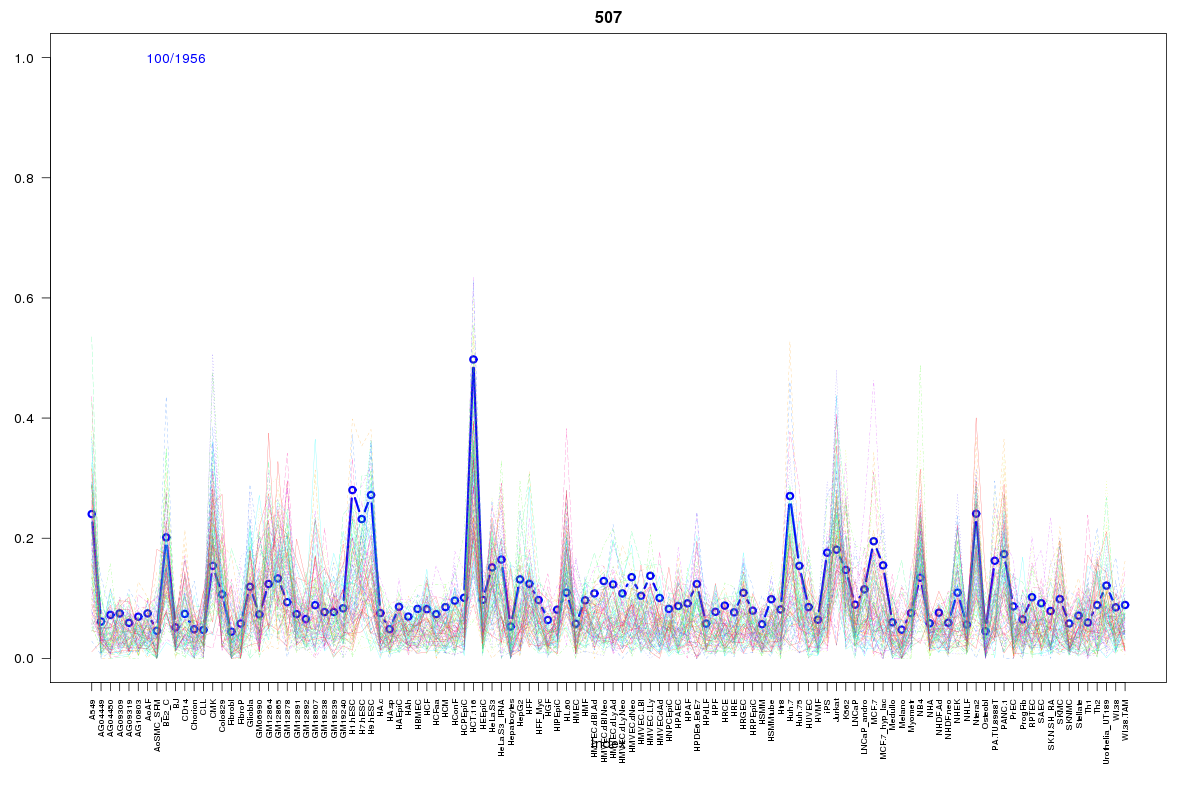 | 507 | 1 |
 | 1755 | 1 |
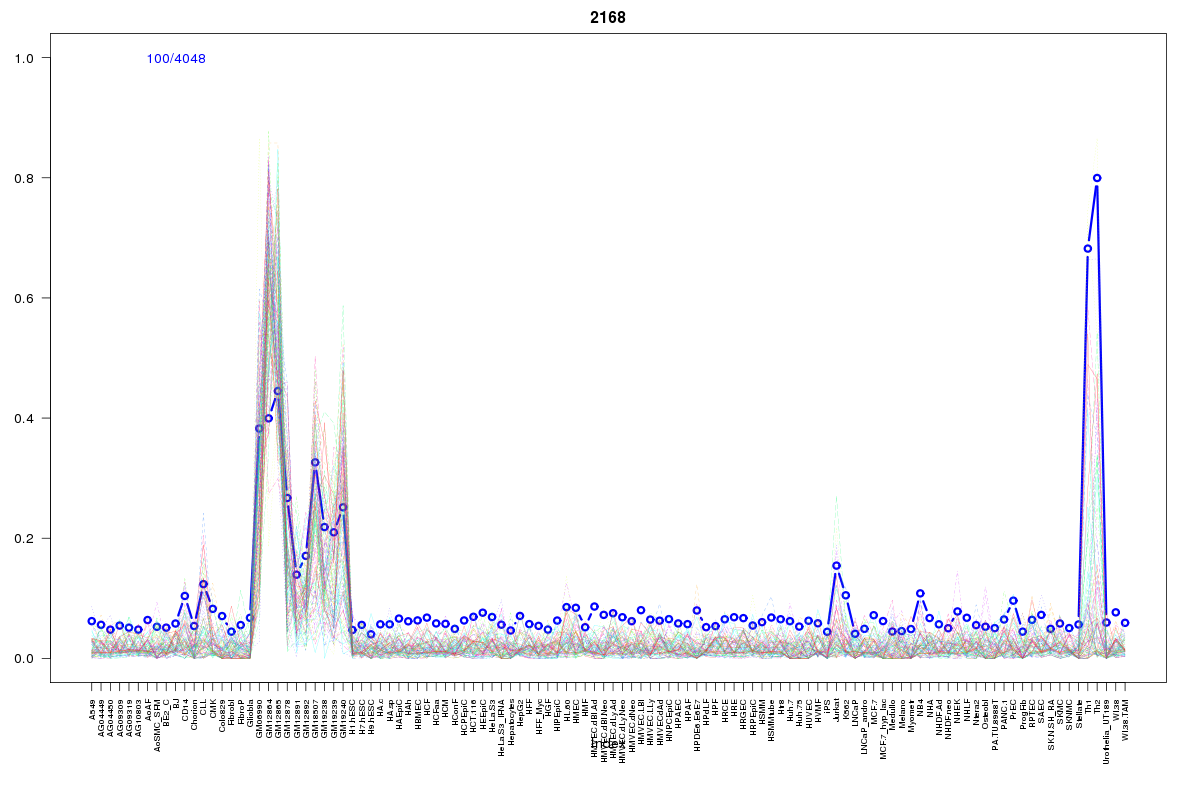 | 2168 | 1 |
 | 66 | 1 |
 | 1820 | 1 |
 | 421 | 1 |
 | 510 | 1 |
Resources
BED file downloads
Connects to 36 DHS sitesTop 10 Correlated DHS Sites
p-values indiciate significant higher or lower correlation| Location | Cluster | P-value |
|---|---|---|
| chr1:45392240-45392390 | 1542 | 0.002 |
| chr1:45392040-45392190 | 1499 | 0.002 |
| chr1:45277400-45277550 | 1686 | 0.002 |
| chr1:45391860-45392010 | 1382 | 0.003 |
| chr1:45369060-45369210 | 1693 | 0.003 |
| chr1:45274060-45274210 | 448 | 0.003 |
| chr1:45277565-45277715 | 186 | 0.004 |
| chr1:45369280-45369430 | 1330 | 0.006 |
| chr1:45301845-45301995 | 620 | 0.006 |
| chr1:45373660-45373810 | 1719 | 0.009 |
| chr1:45338420-45338570 | 1820 | 0.018 |
External Databases
UCSCEnsembl (ENSG00000117425)