Gene: CTGF
chr6: 132269315-132272513Expression Profile
(log scale)
Graphical Connections
Distribution of linked clusters:
You may find it interesting if many of the connected DHS sites belong to the same cluster.| Cluster Profile | Cluster ID | Number of DHS sites in this cluster |
|---|---|---|
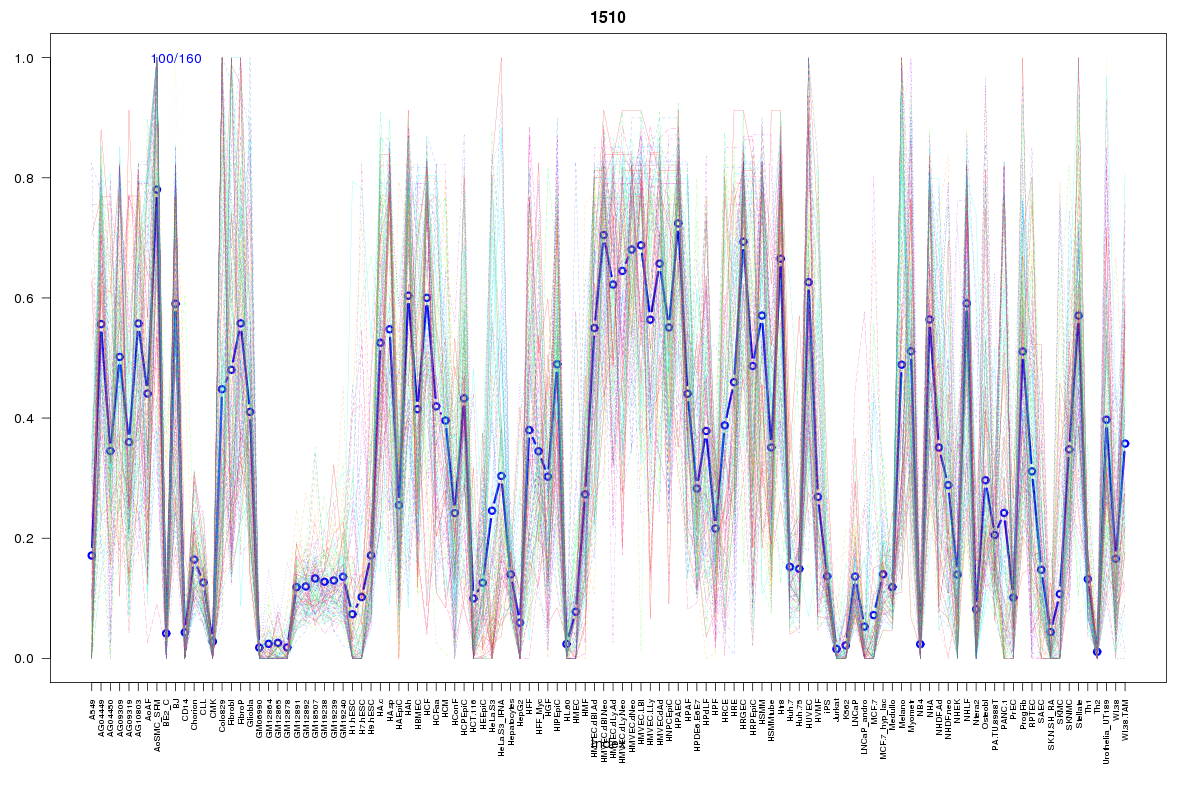 | 1510 | 6 |
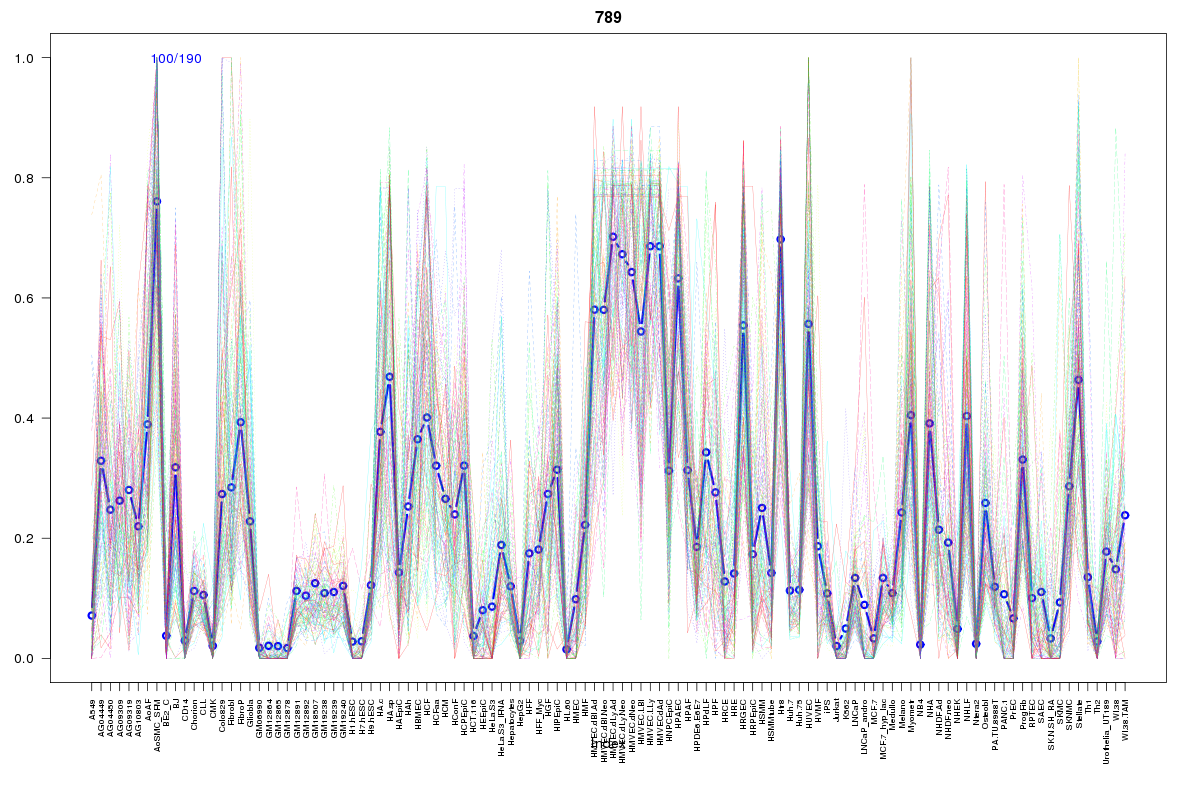 | 789 | 2 |
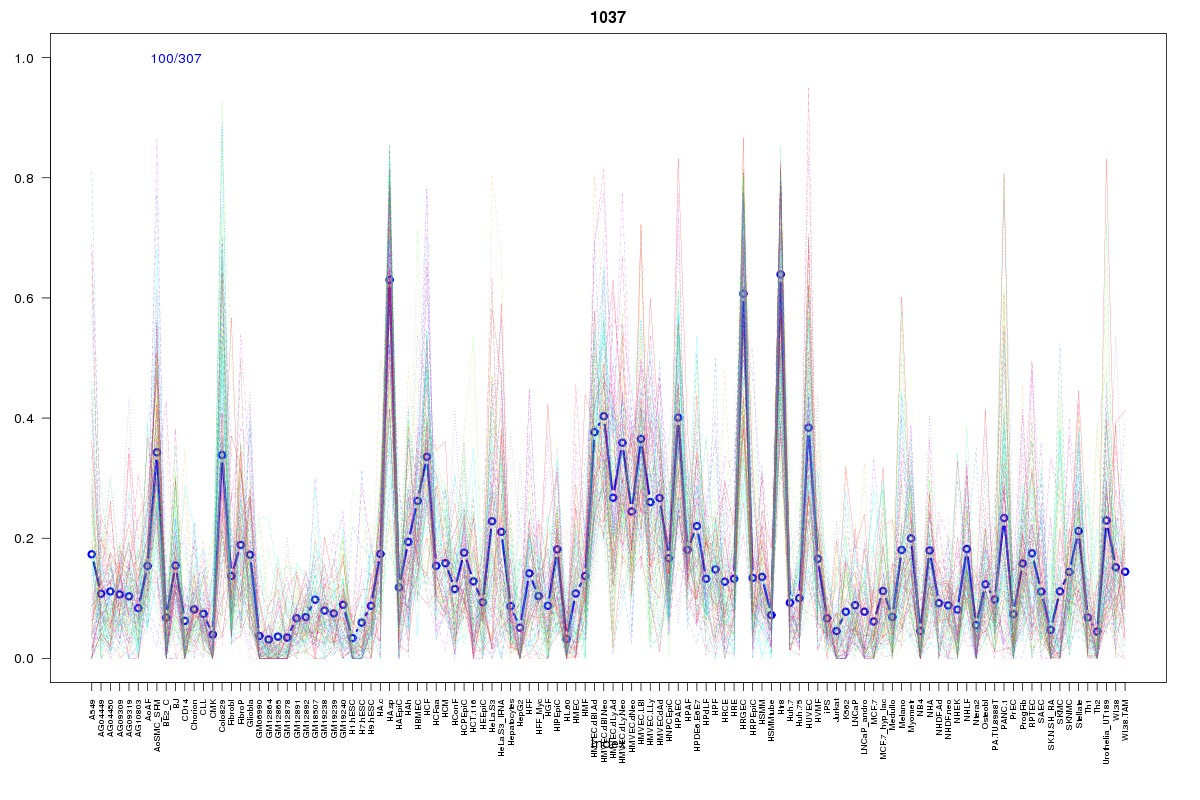 | 1037 | 2 |
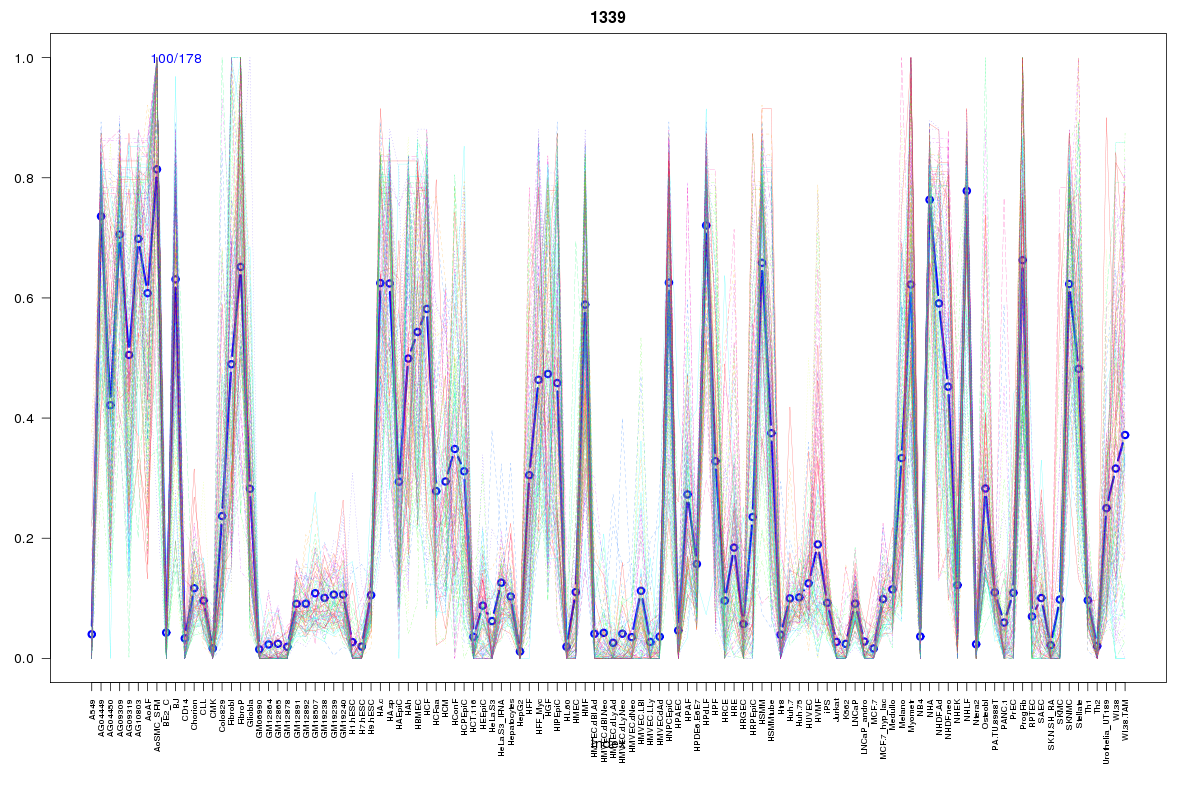 | 1339 | 2 |
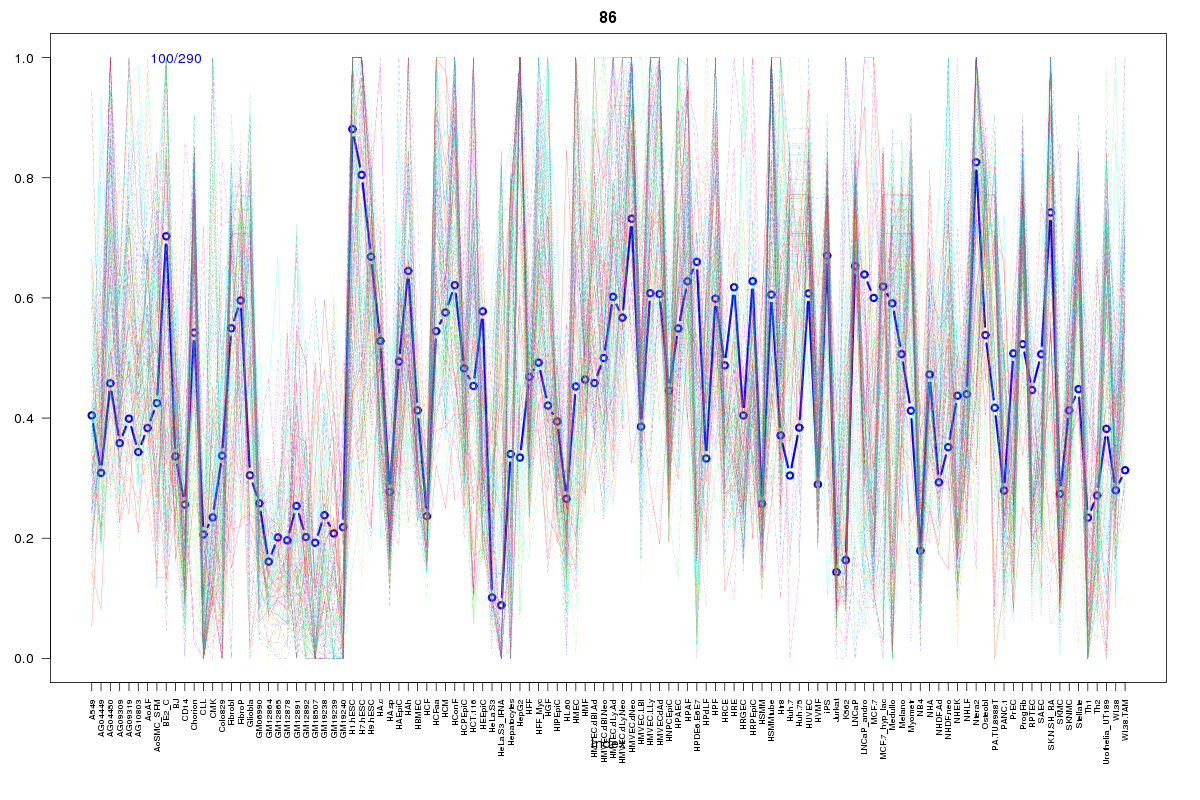 | 86 | 2 |
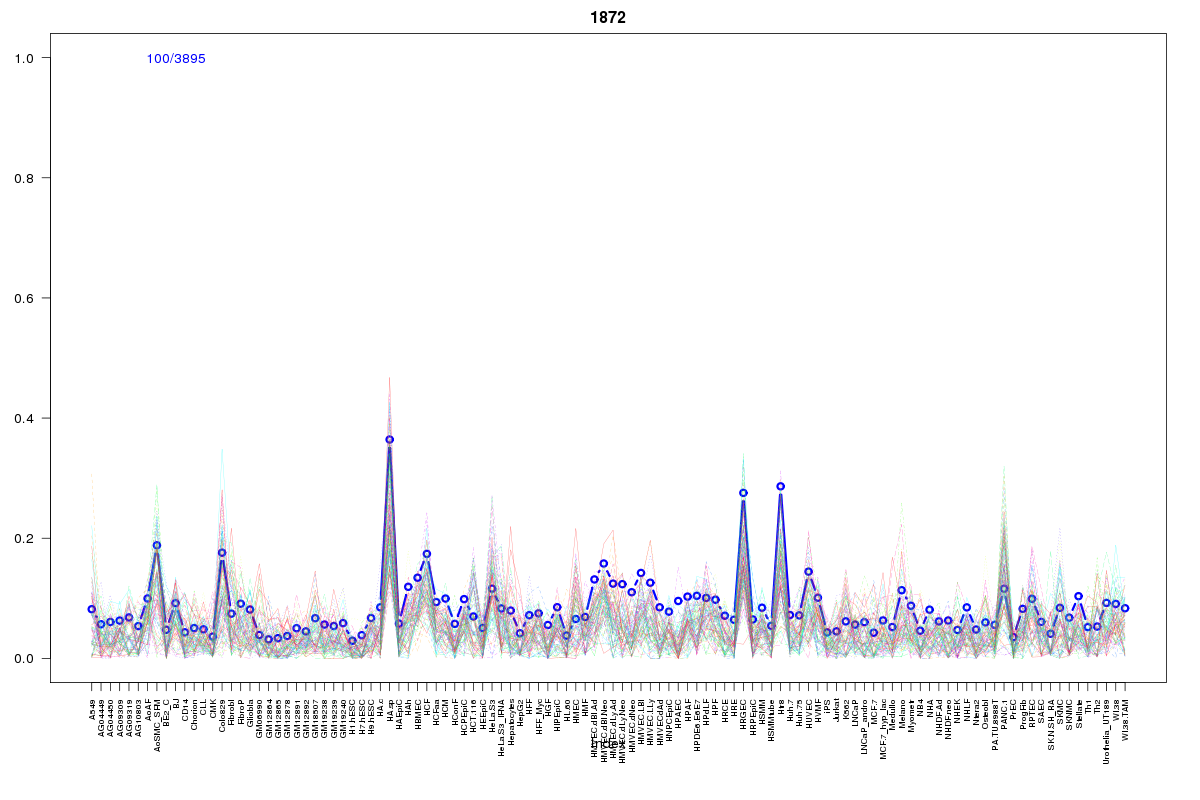 | 1872 | 1 |
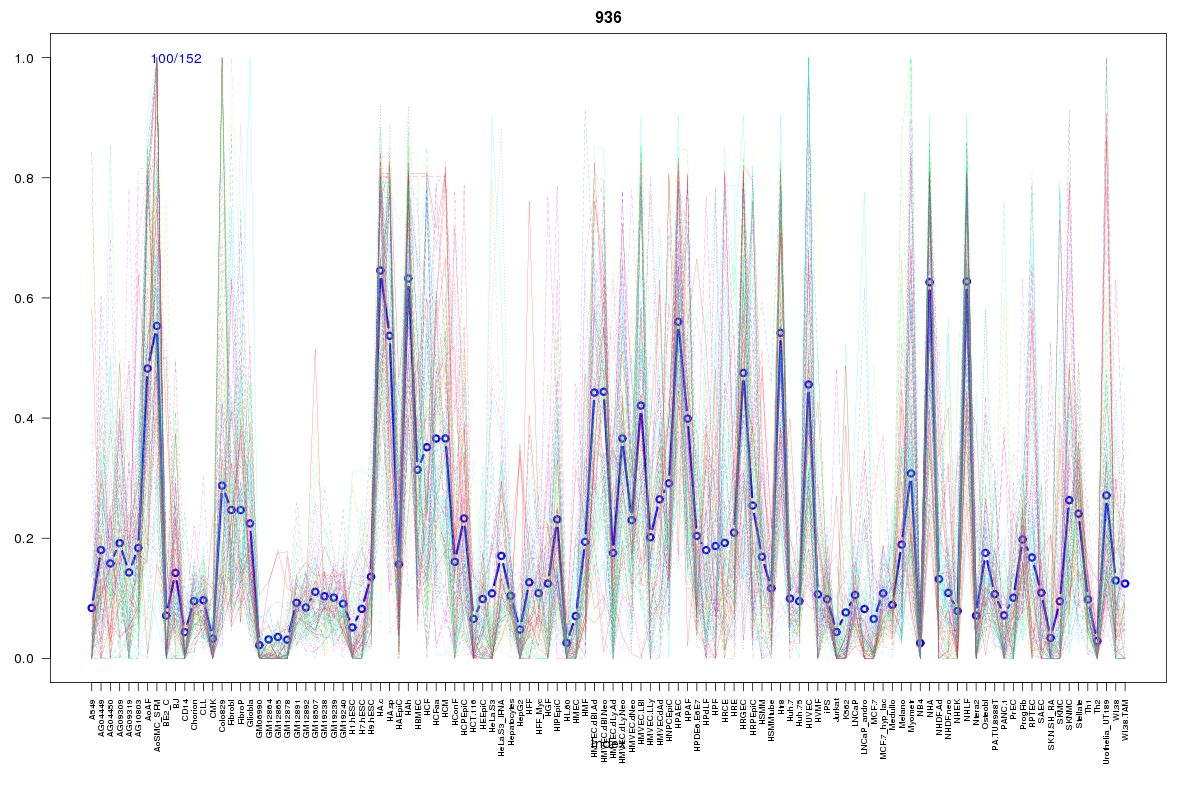 | 936 | 1 |
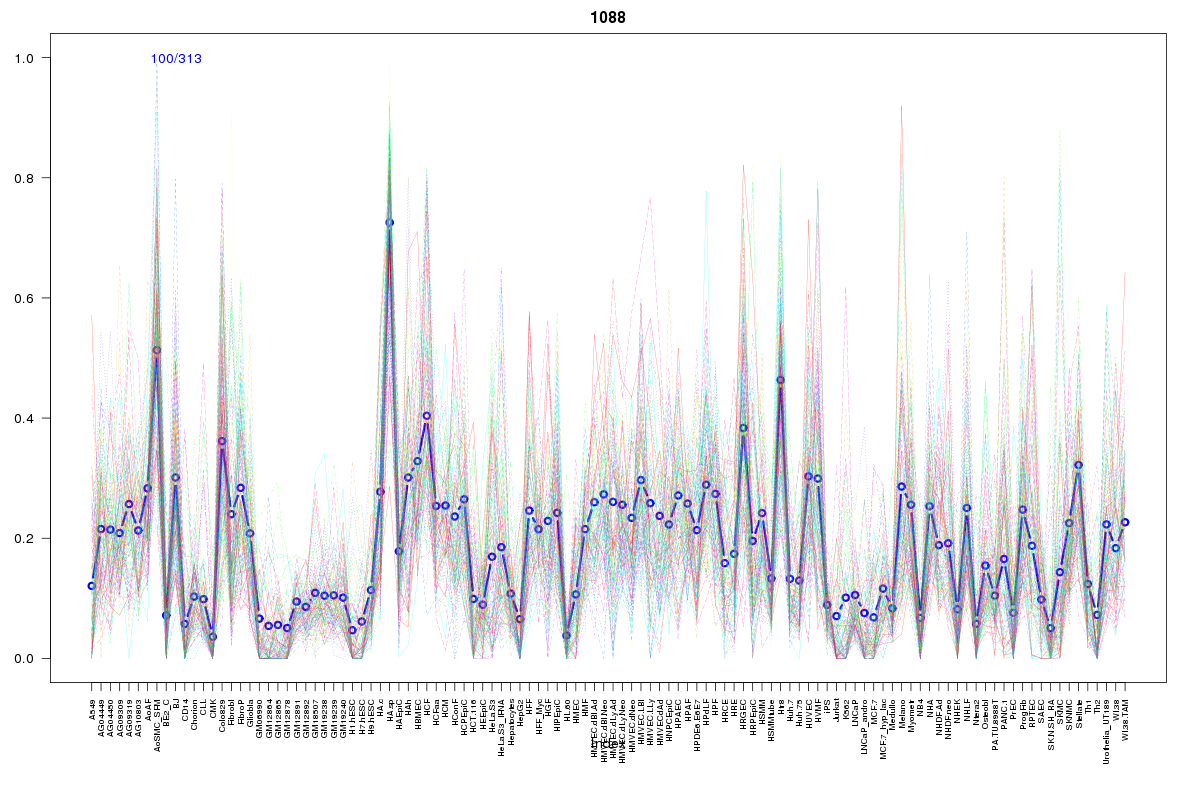 | 1088 | 1 |
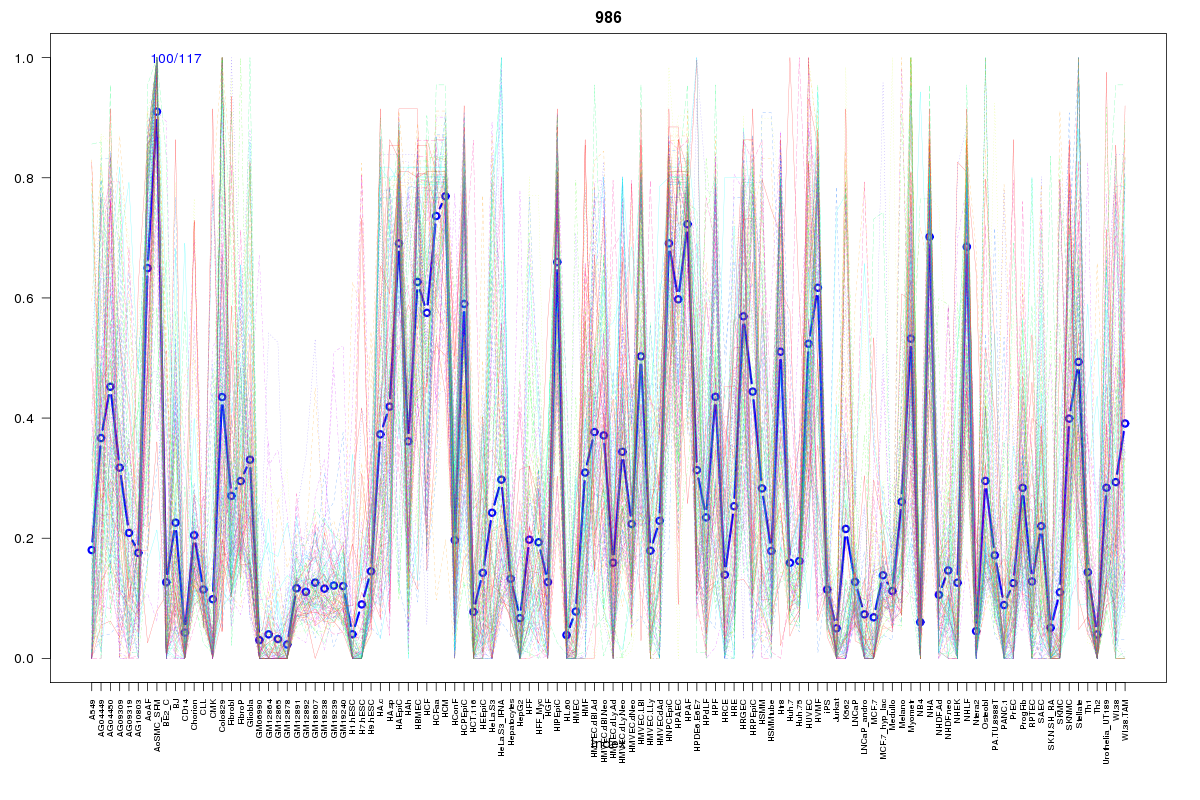 | 986 | 1 |
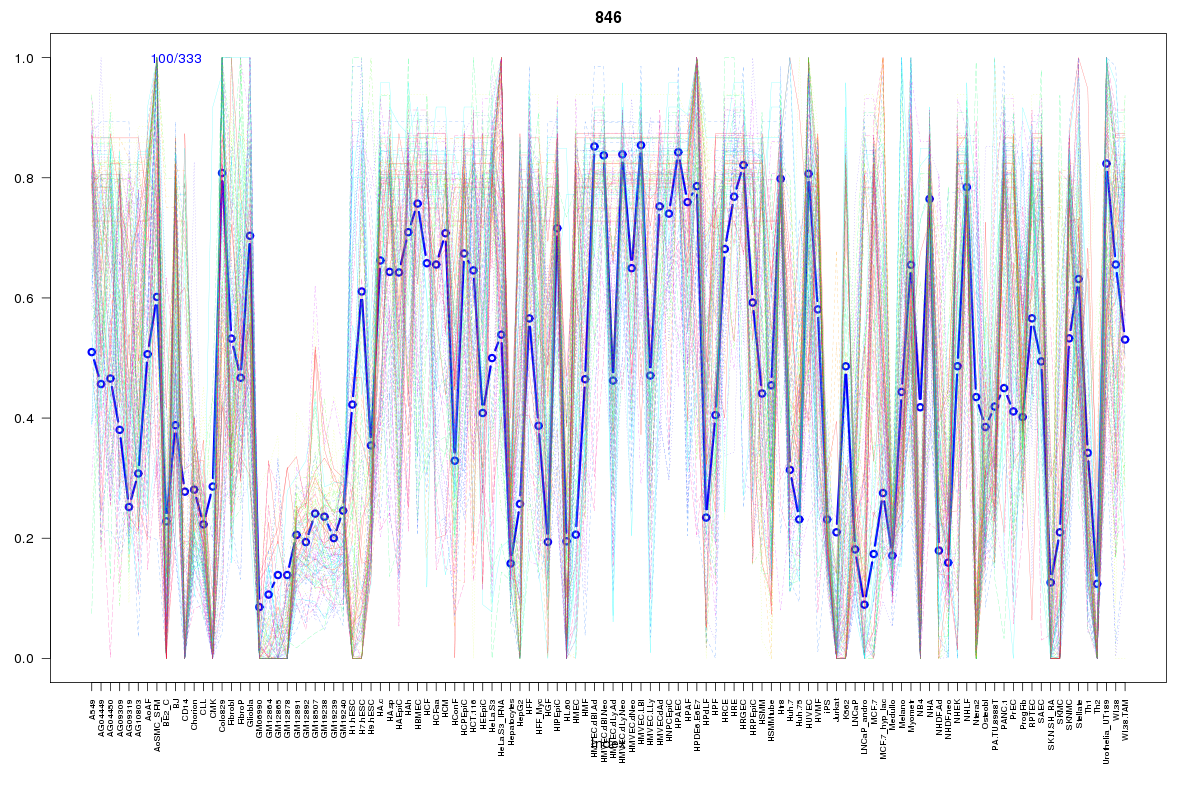 | 846 | 1 |
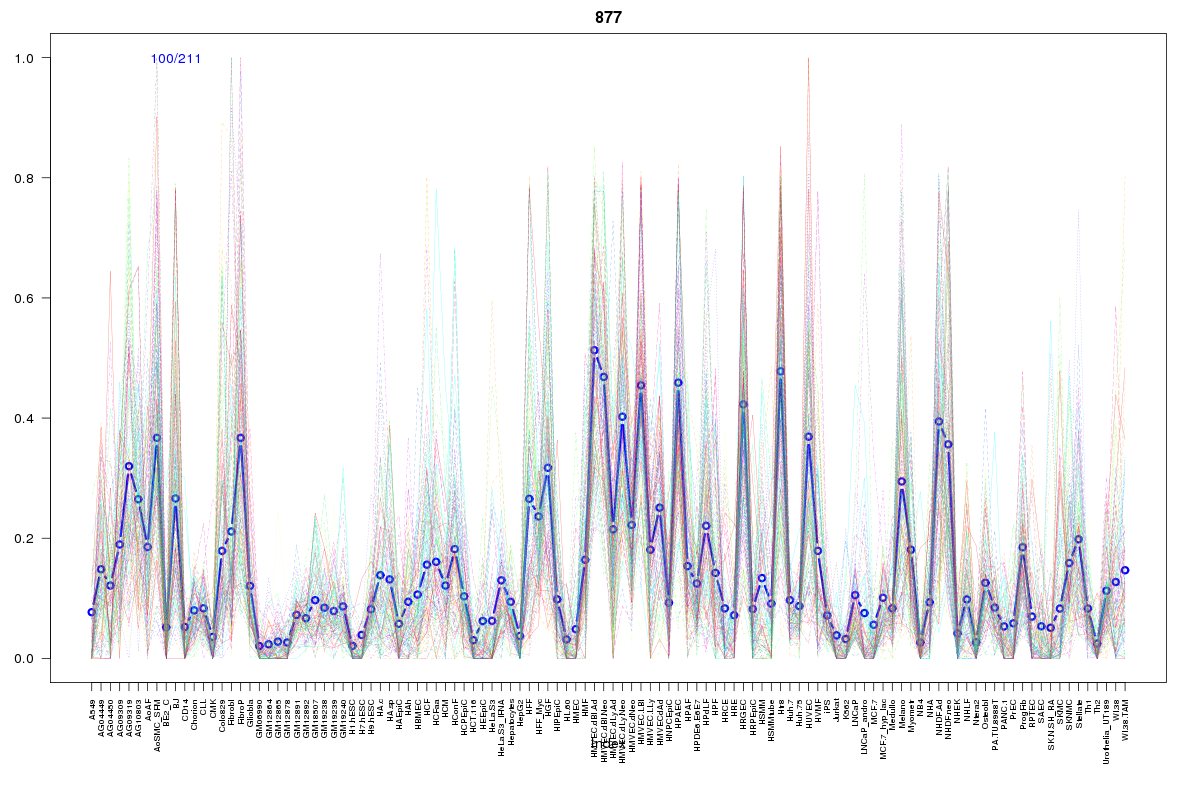 | 877 | 1 |
 | 1137 | 1 |
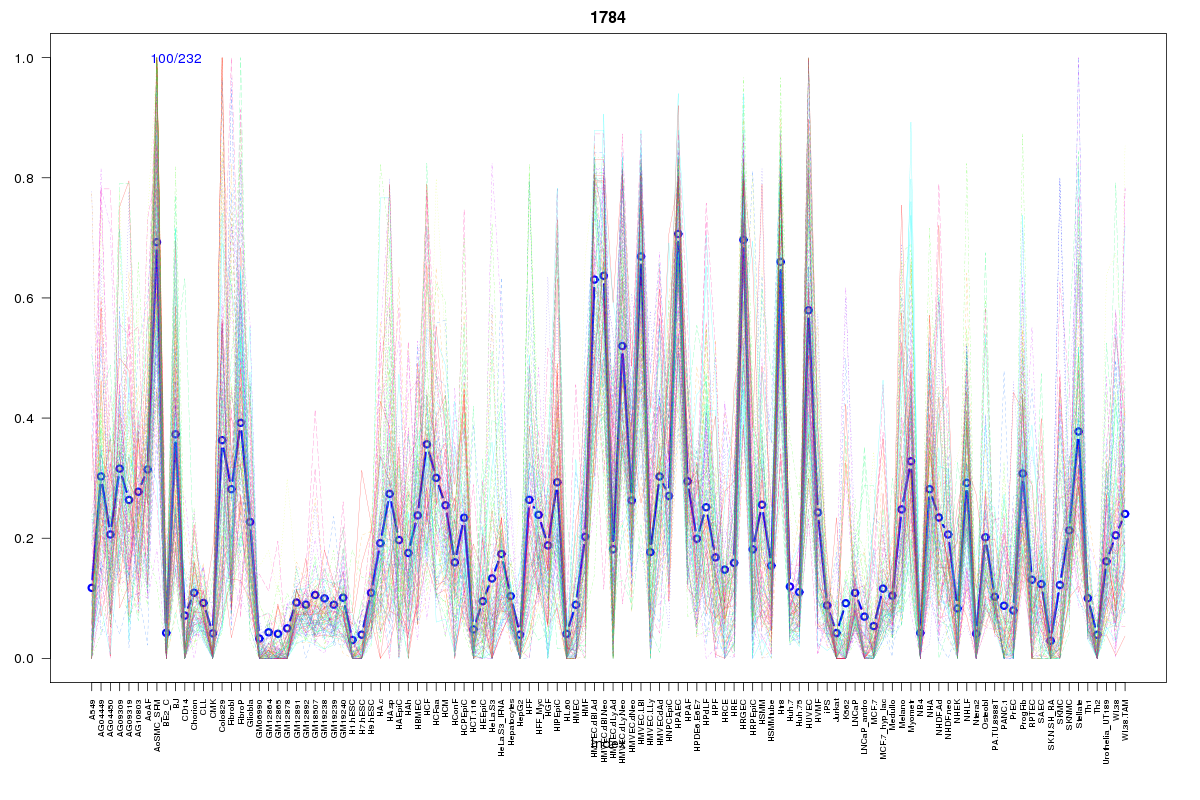 | 1784 | 1 |
 | 892 | 1 |
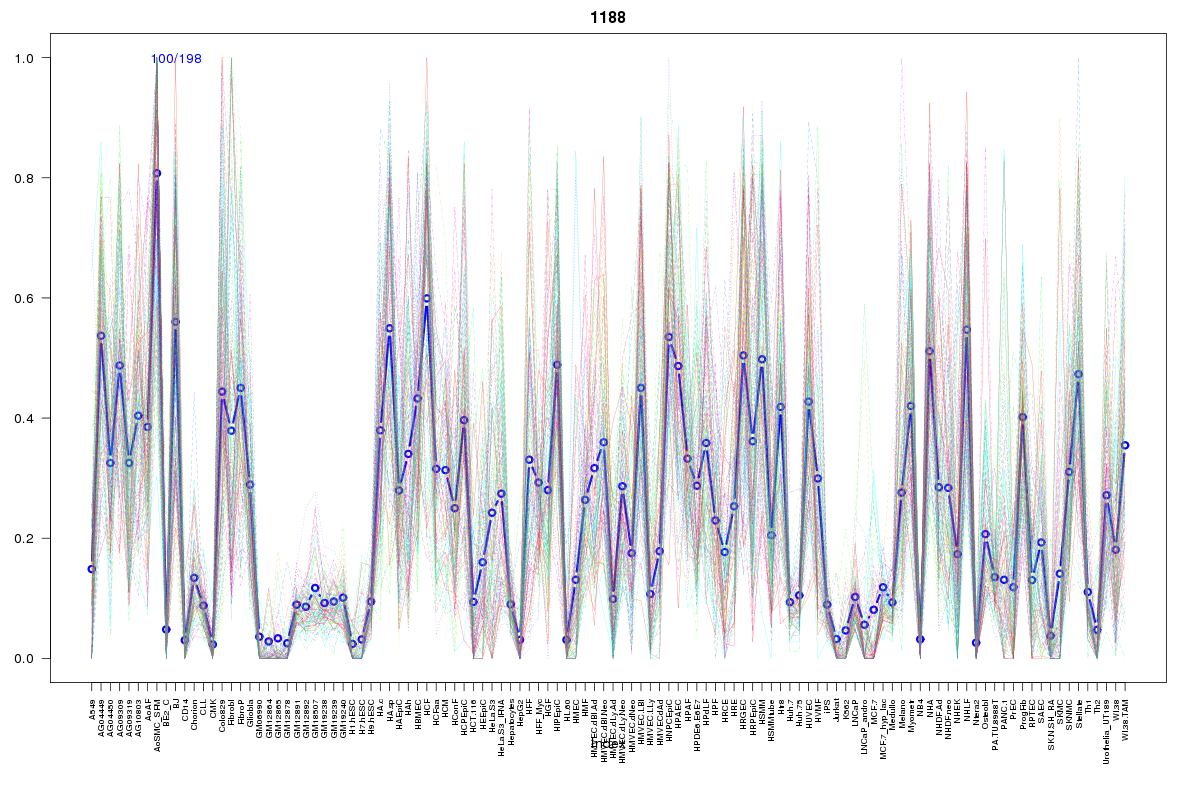 | 1188 | 1 |
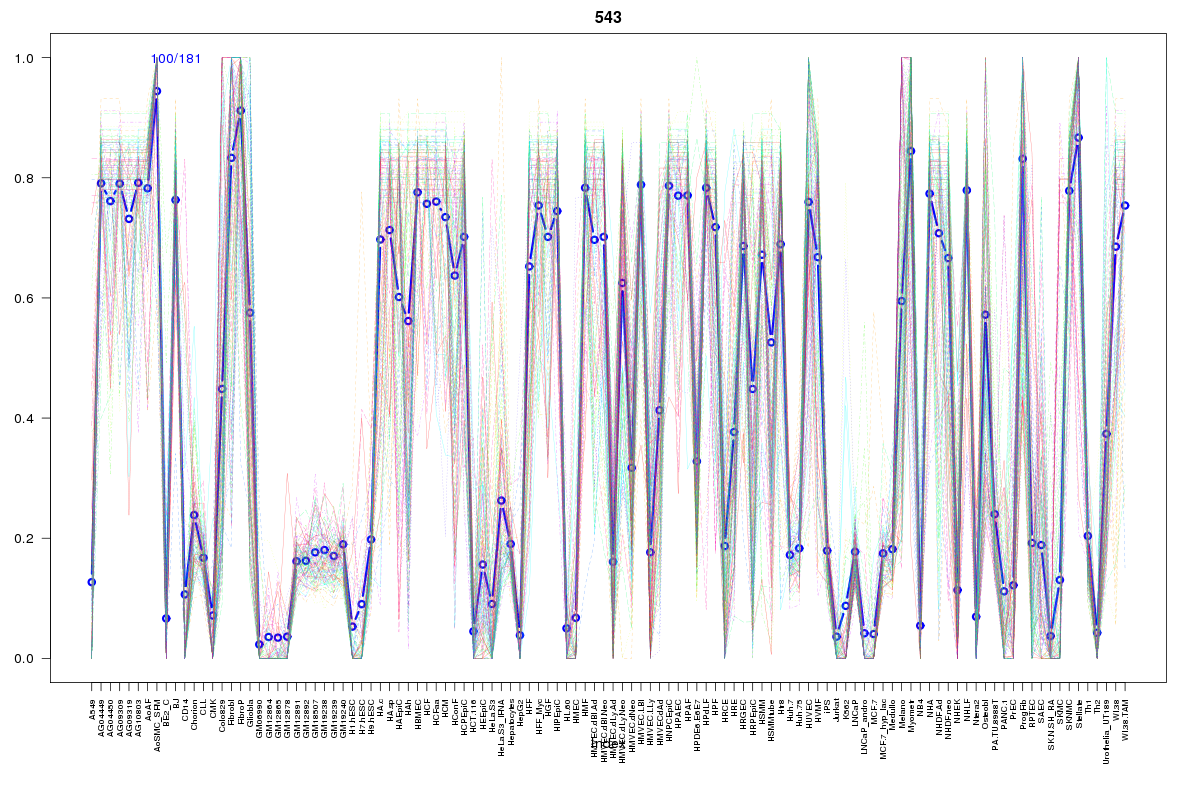 | 543 | 1 |
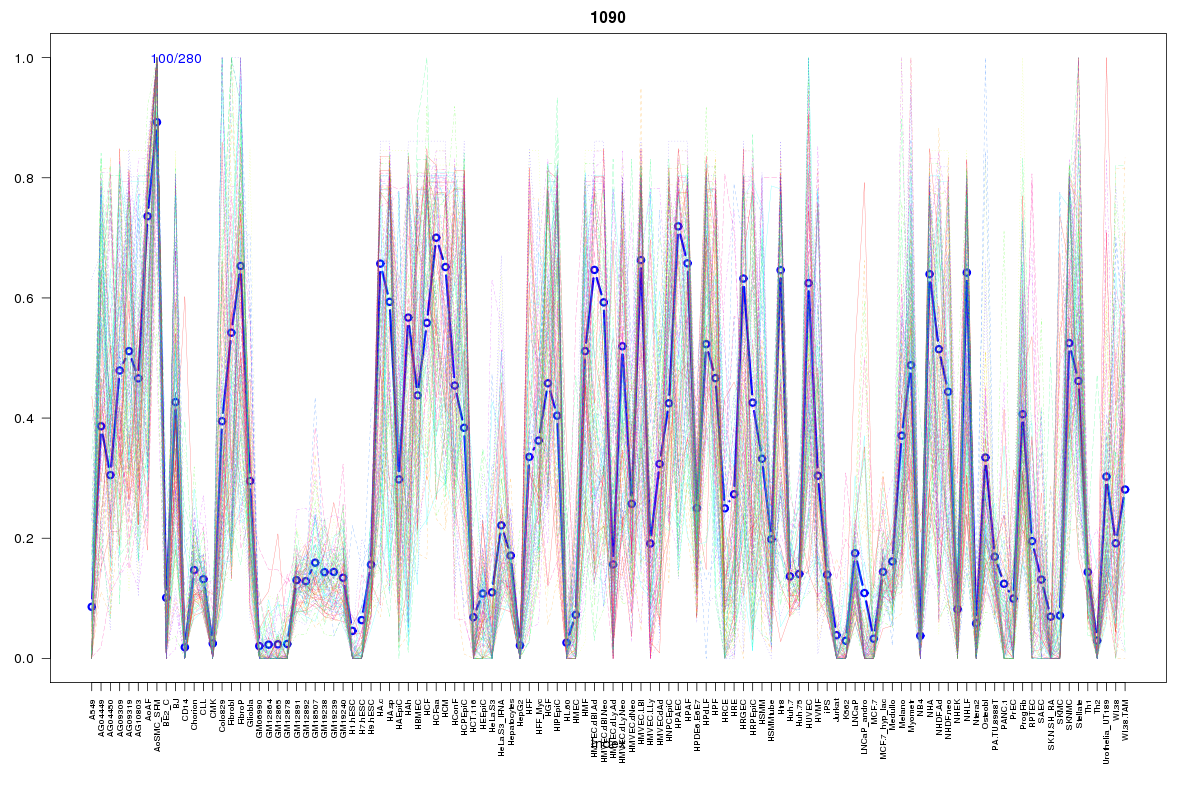 | 1090 | 1 |
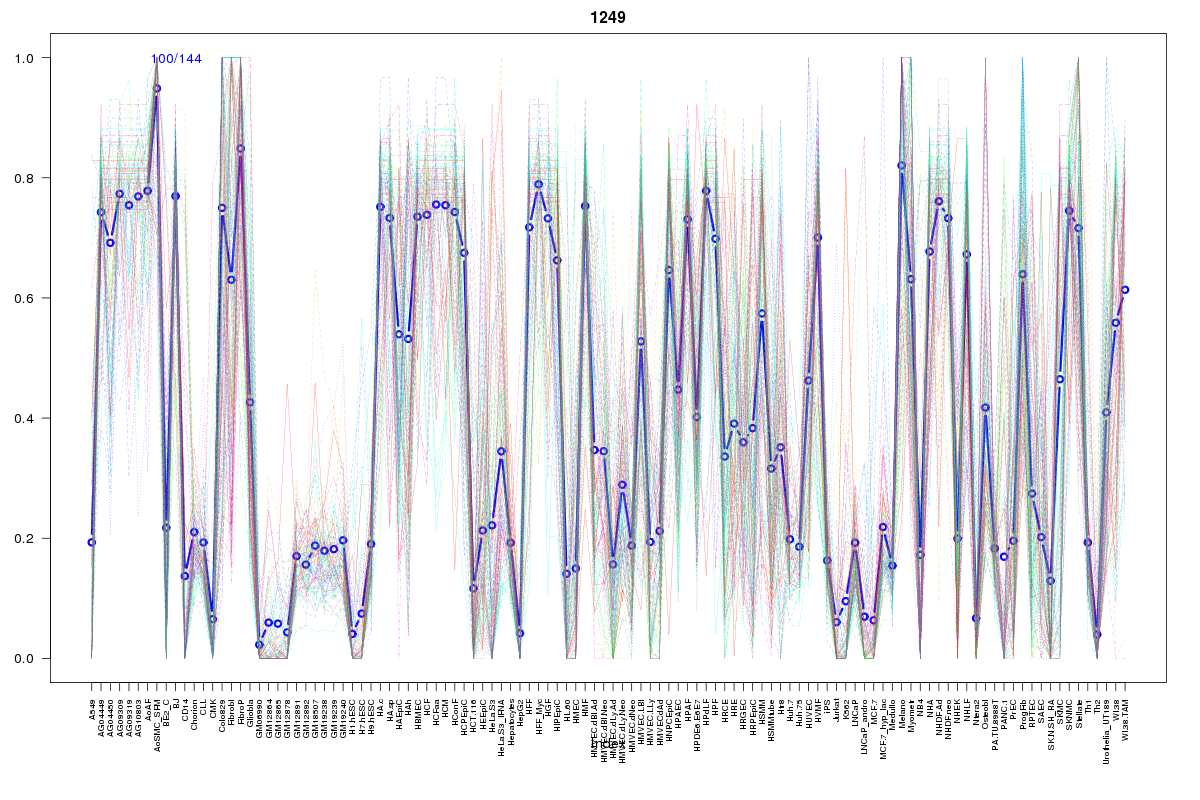 | 1249 | 1 |
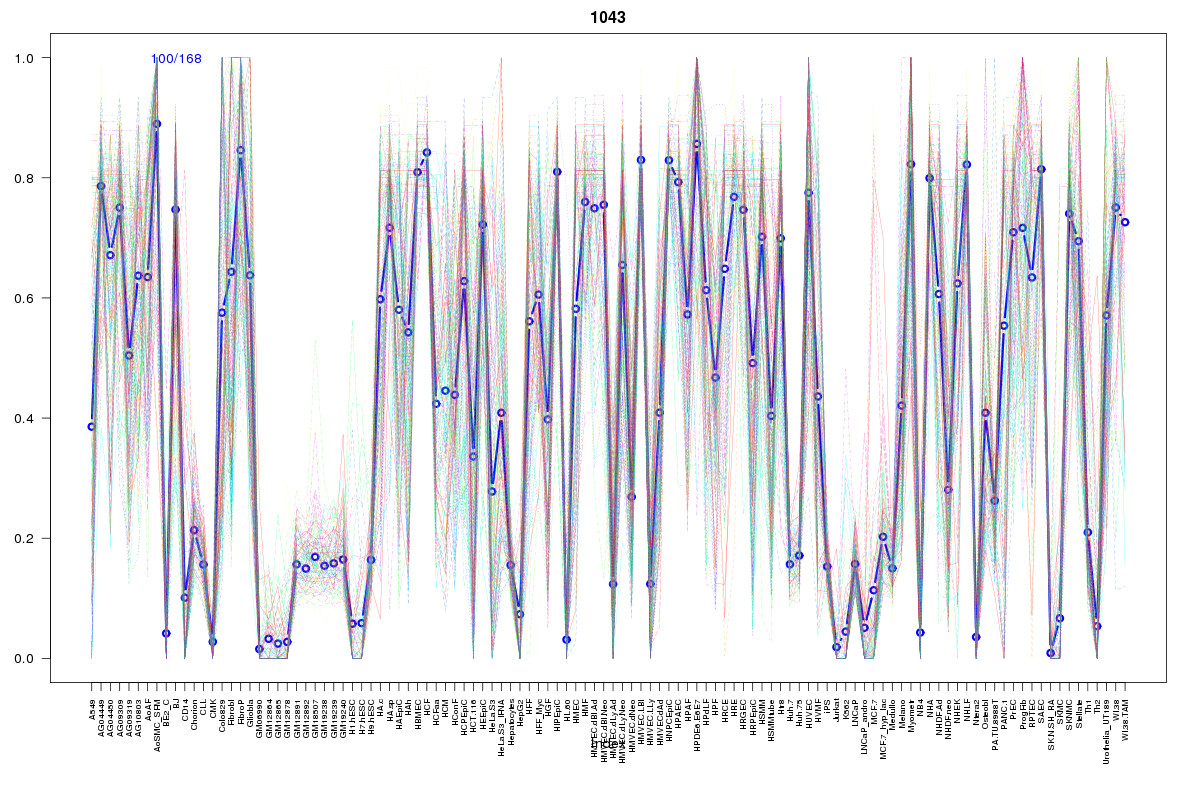 | 1043 | 1 |
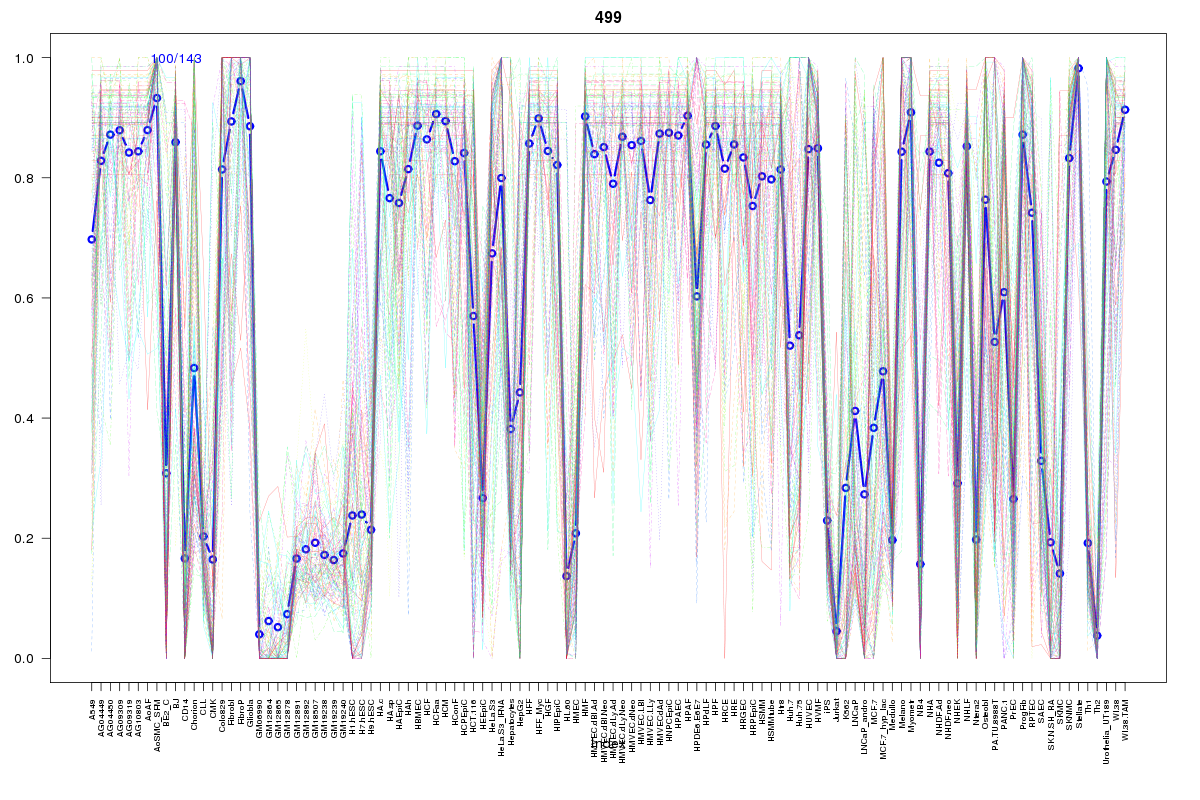 | 499 | 1 |
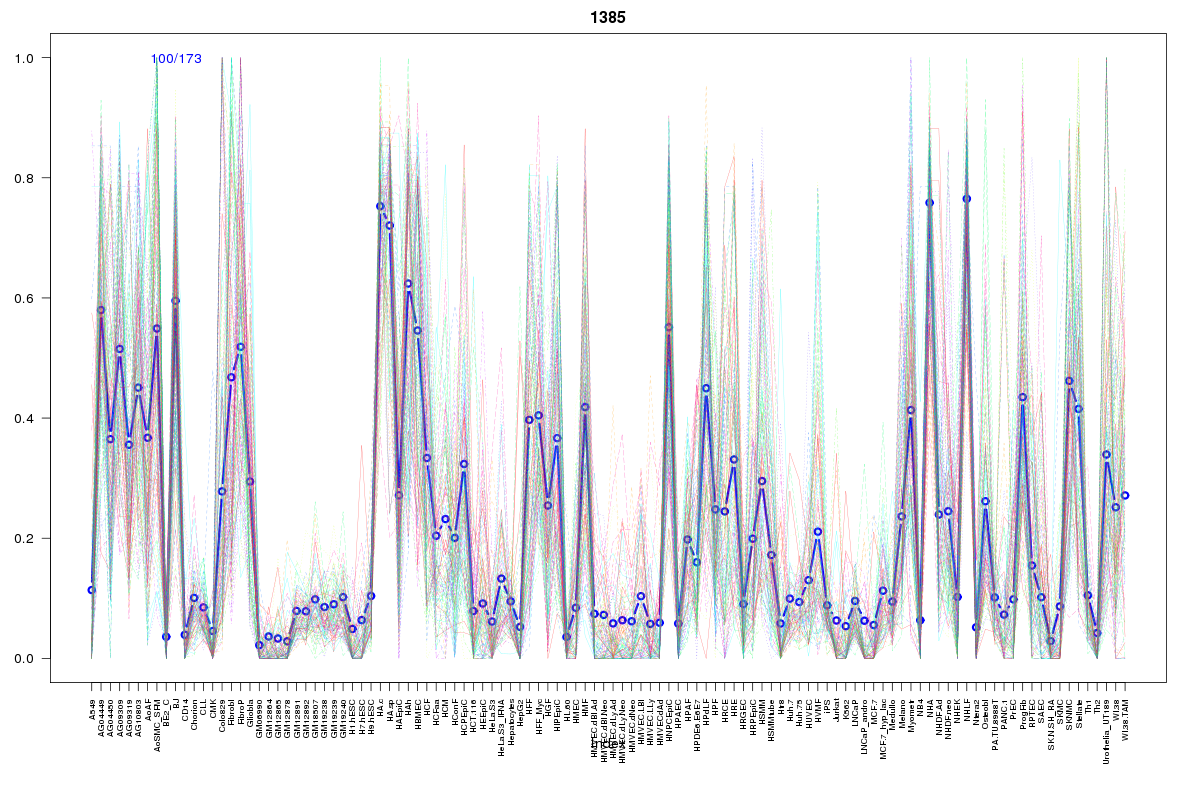 | 1385 | 1 |
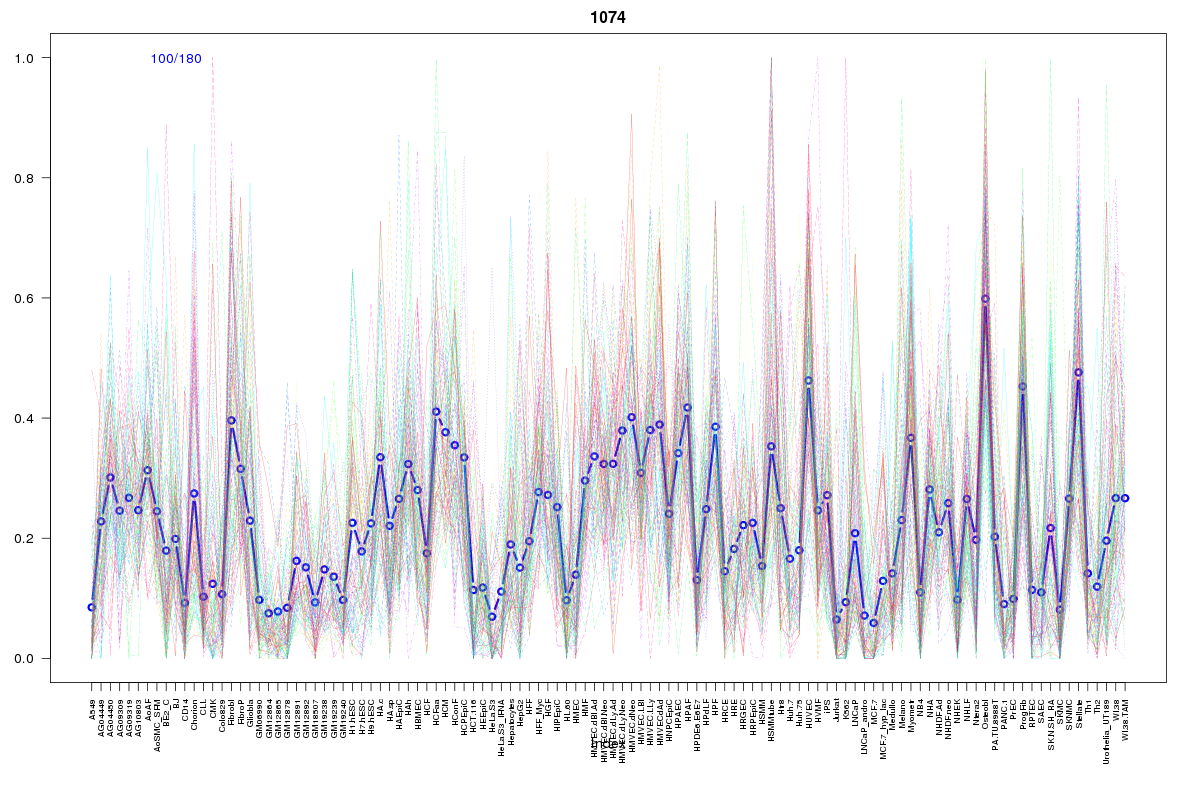 | 1074 | 1 |
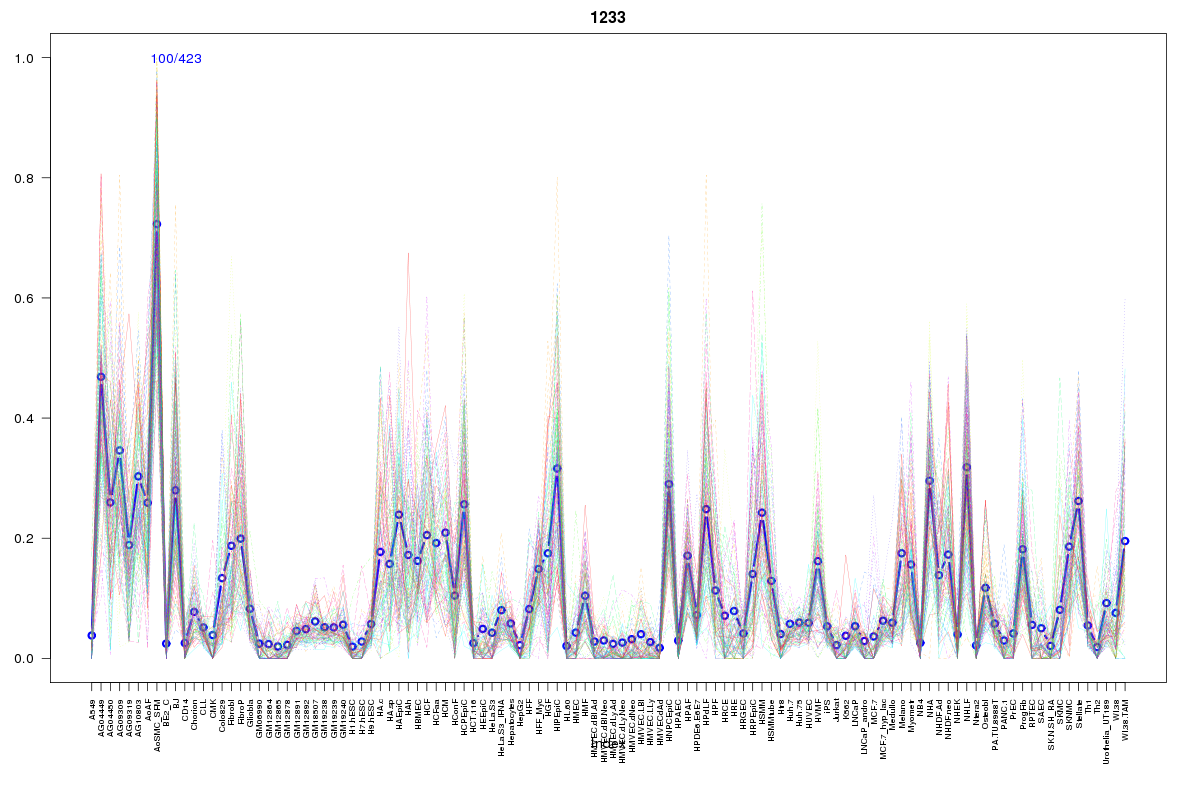 | 1233 | 1 |
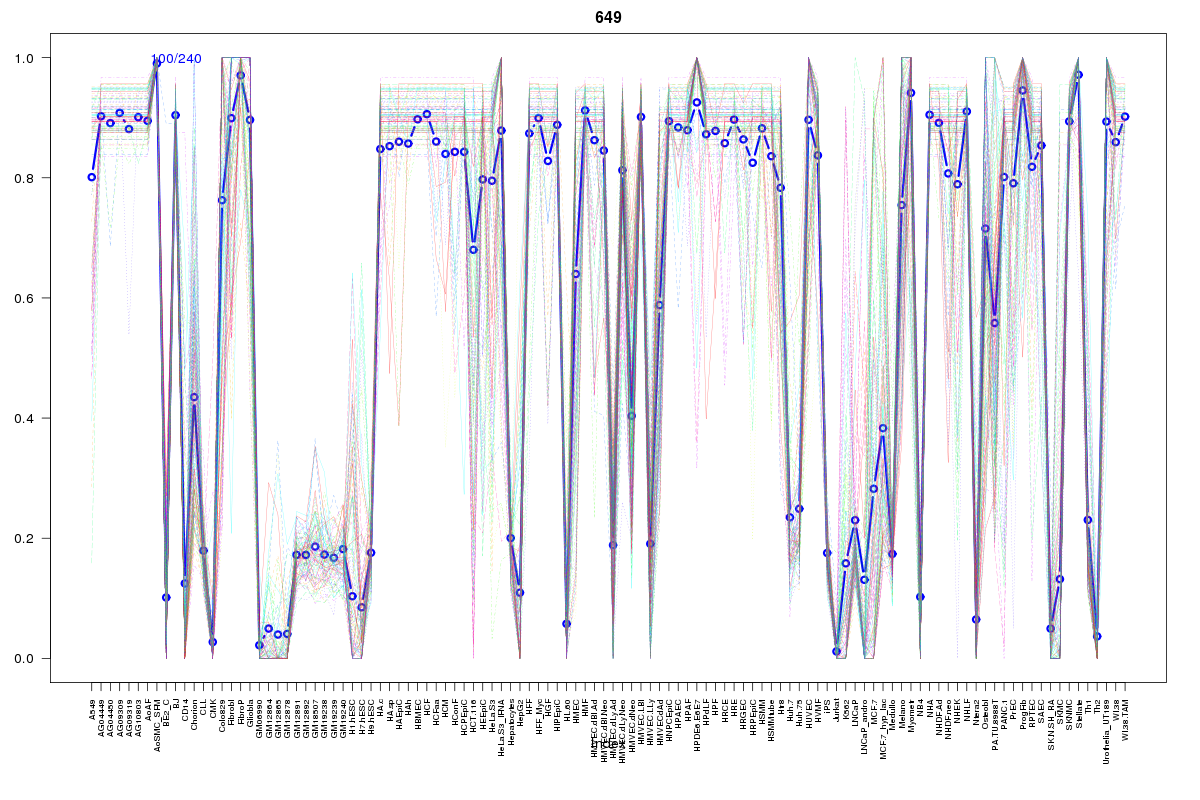 | 649 | 1 |
 | 1113 | 1 |
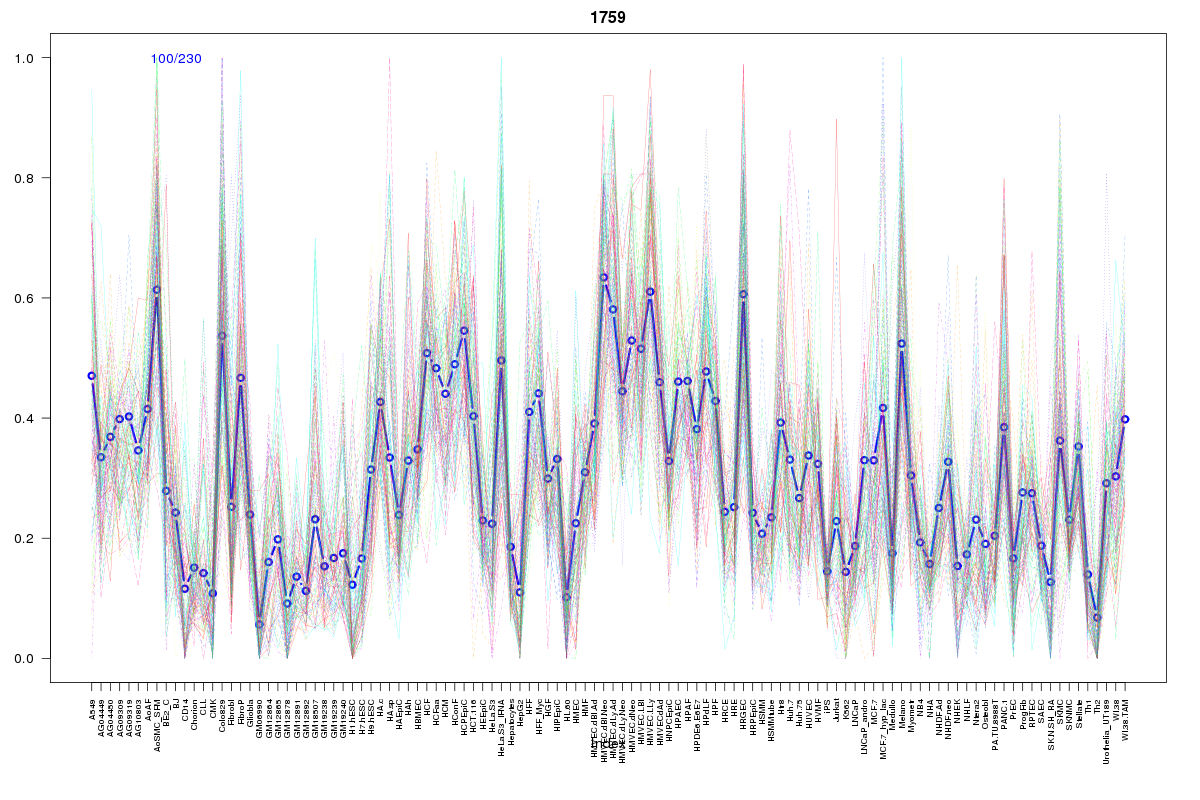 | 1759 | 1 |
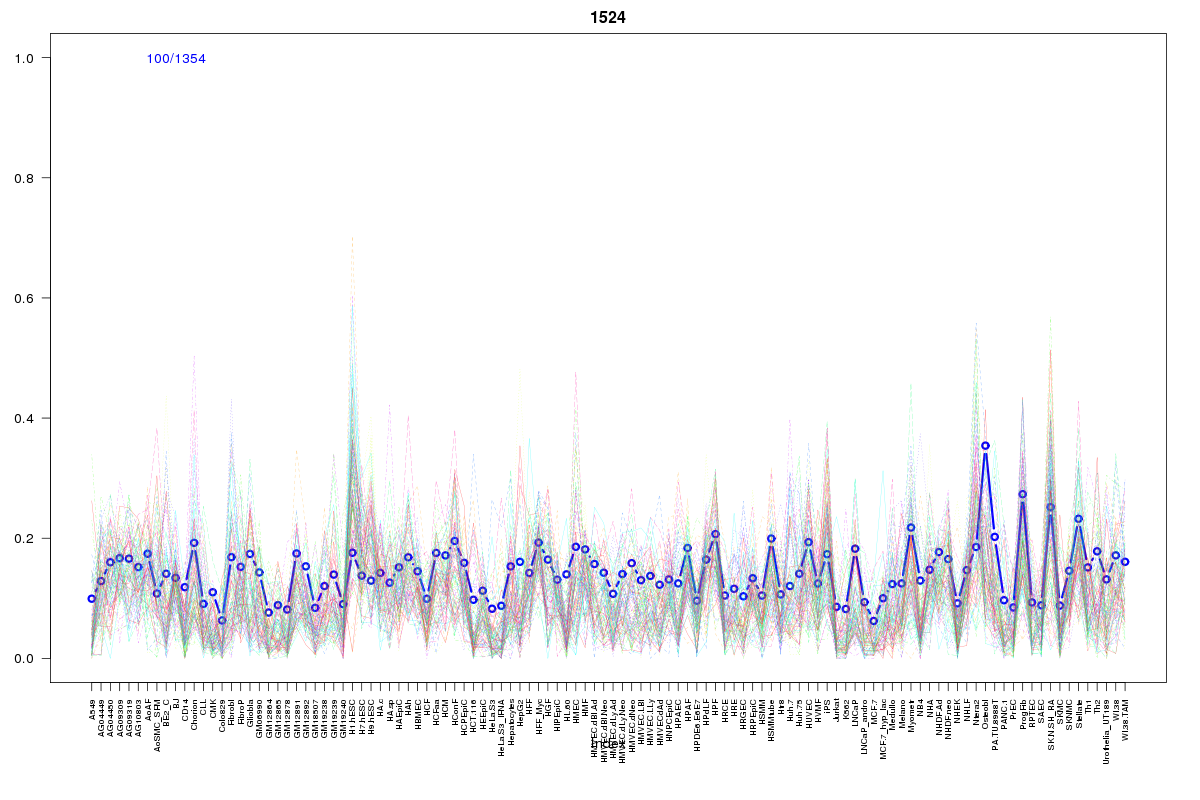 | 1524 | 1 |
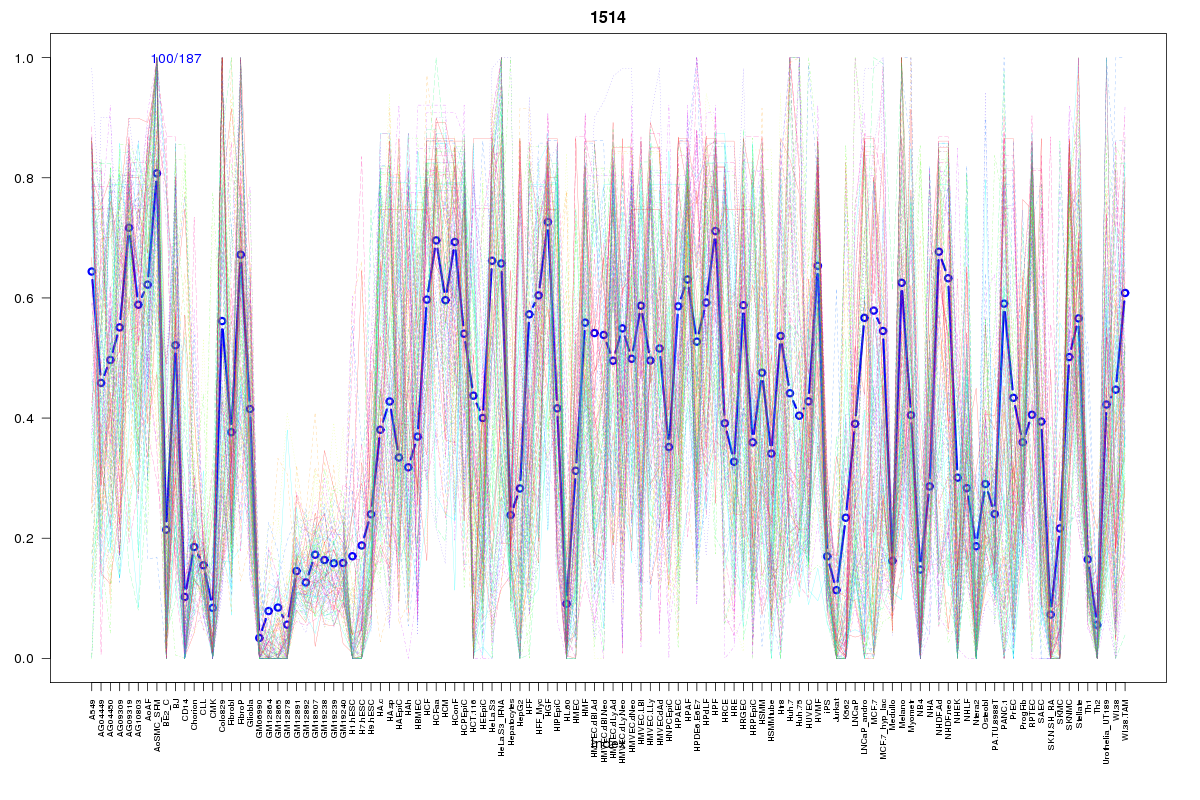 | 1514 | 1 |
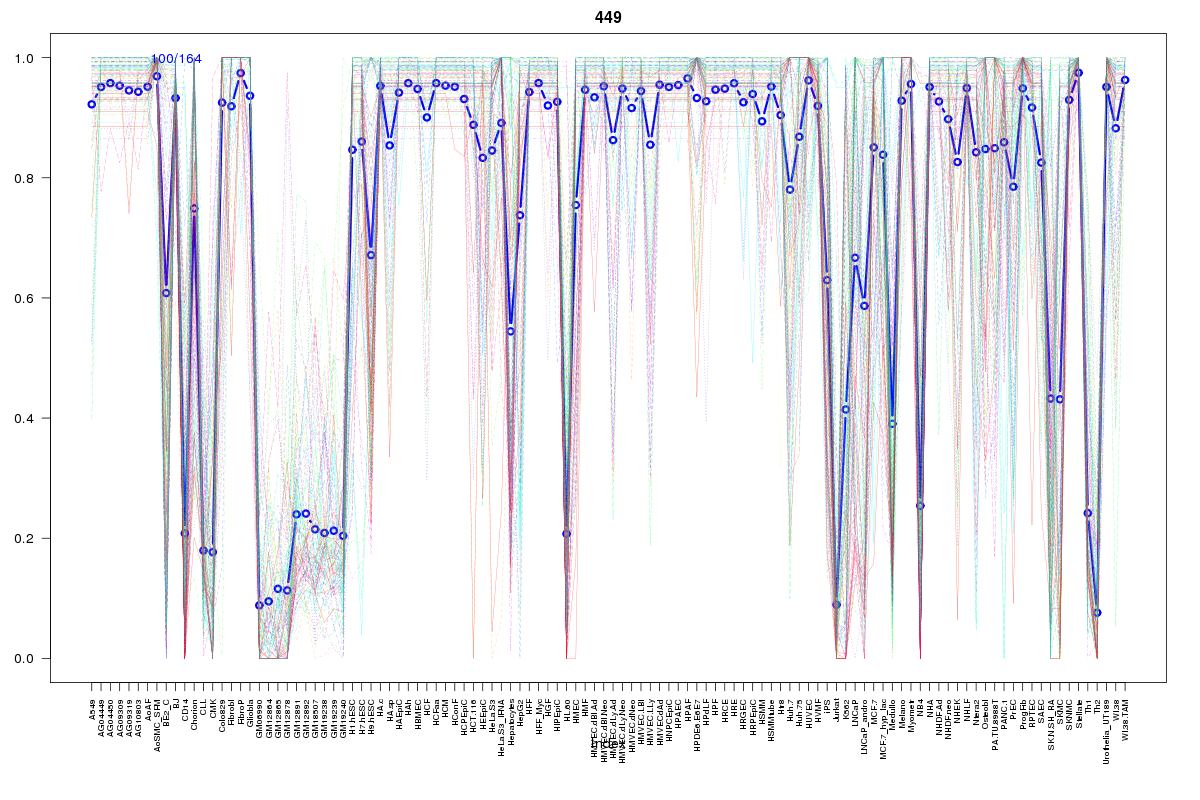 | 449 | 1 |
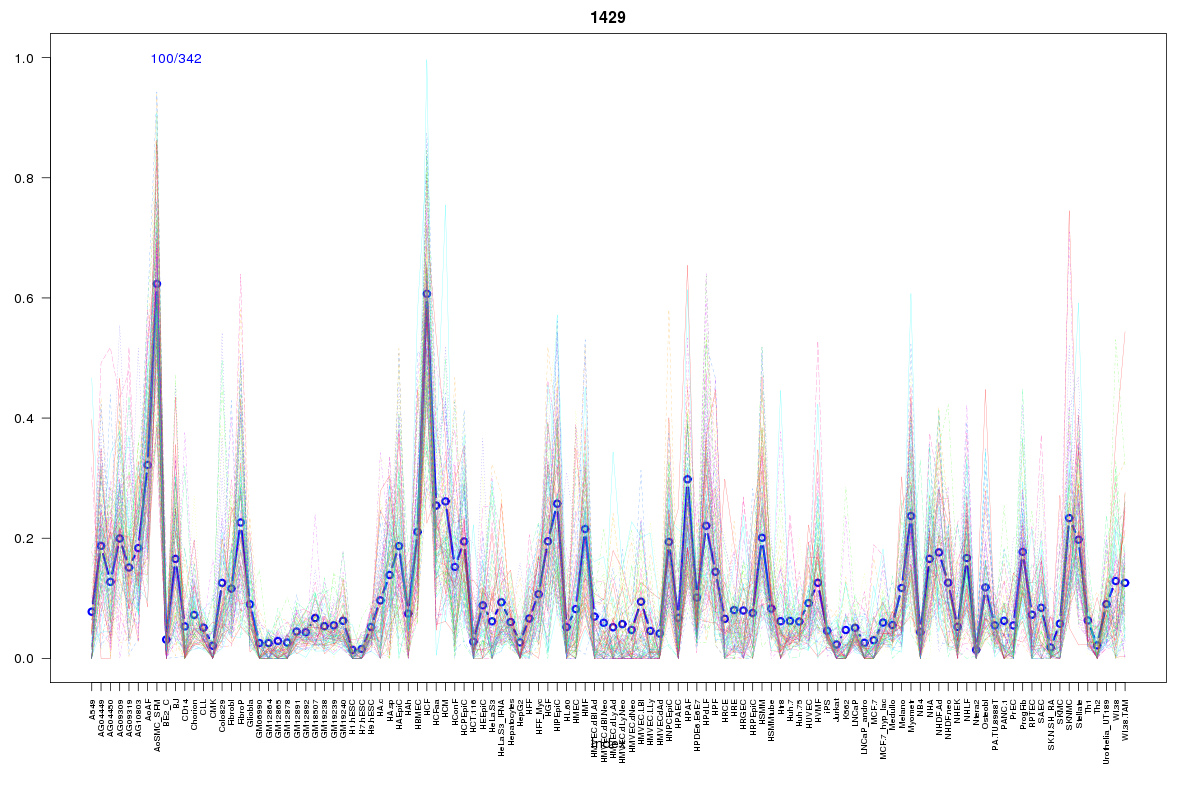 | 1429 | 1 |
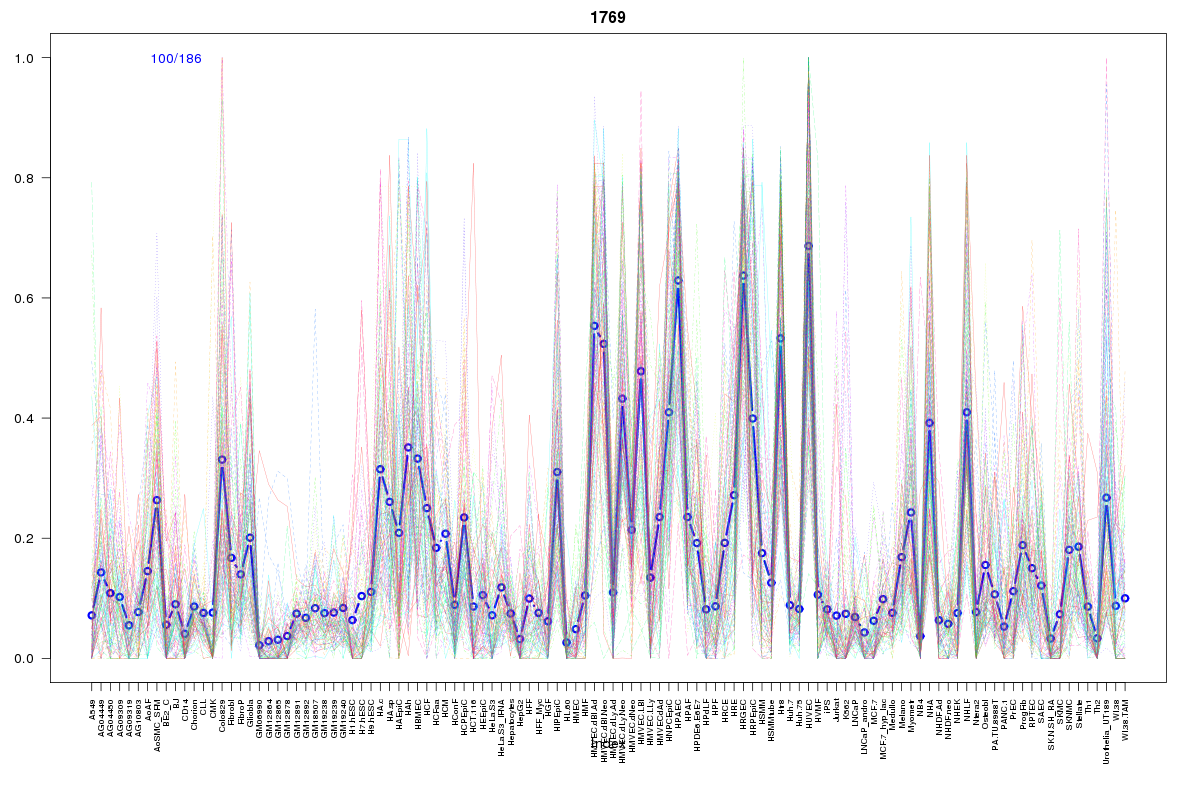 | 1769 | 1 |
Resources
BED file downloads
Connects to 40 DHS sitesTop 10 Correlated DHS Sites
p-values indiciate significant higher or lower correlation| Location | Cluster | P-value |
|---|---|---|
| chr6:132271160-132271310 | 499 | 0 |
| chr6:132272380-132272530 | 86 | 0 |
| chr6:132272540-132272690 | 449 | 0 |
| chr6:132185240-132185390 | 649 | 0.001 |
| chr6:132268640-132268790 | 1510 | 0.002 |
| chr6:132269880-132270030 | 1510 | 0.002 |
| chr6:132301340-132301490 | 543 | 0.002 |
| chr6:132270400-132270550 | 1510 | 0.002 |
| chr6:132268860-132269010 | 1510 | 0.003 |
| chr6:132317180-132317330 | 1043 | 0.003 |
| chr6:132268100-132268250 | 1510 | 0.003 |
External Databases
UCSCEnsembl (ENSG00000118523)