Gene: DNAJC15
chr13: 43597338-43683045Expression Profile
(log scale)
Graphical Connections
Distribution of linked clusters:
You may find it interesting if many of the connected DHS sites belong to the same cluster.| Cluster Profile | Cluster ID | Number of DHS sites in this cluster |
|---|---|---|
 | 10 | 2 |
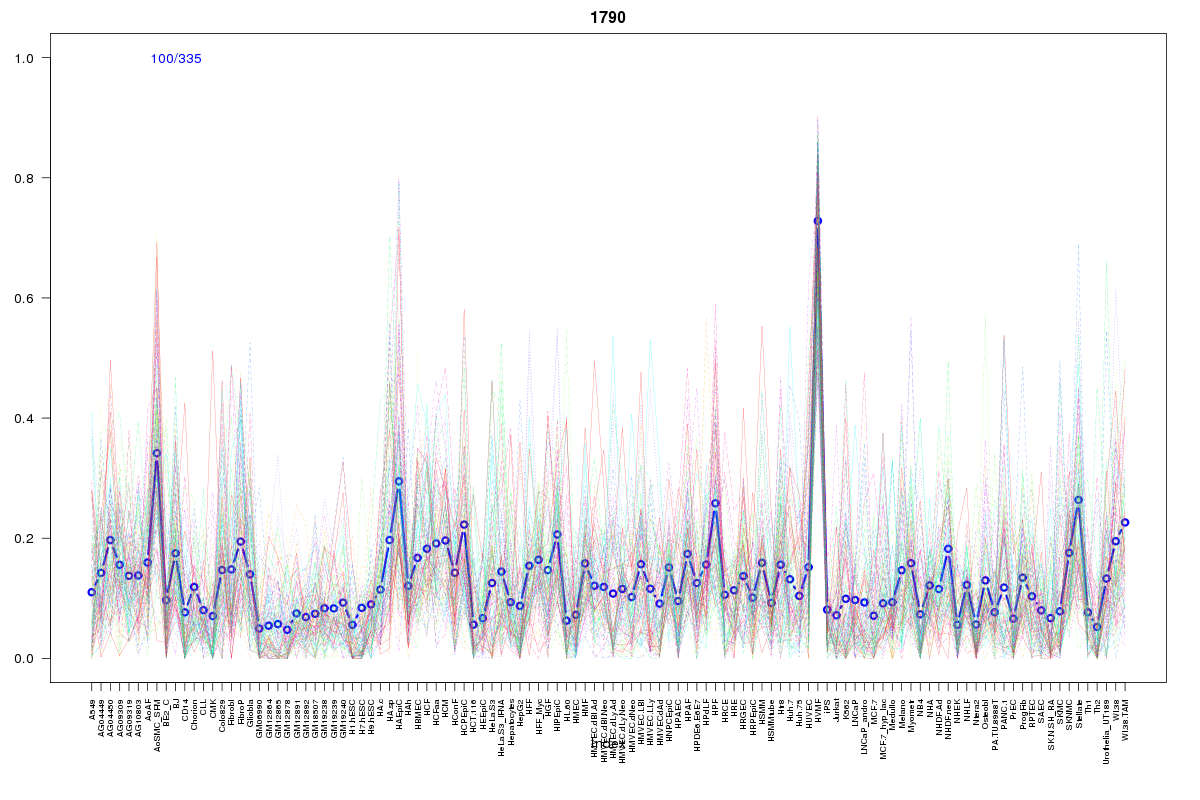 | 1790 | 1 |
 | 1401 | 1 |
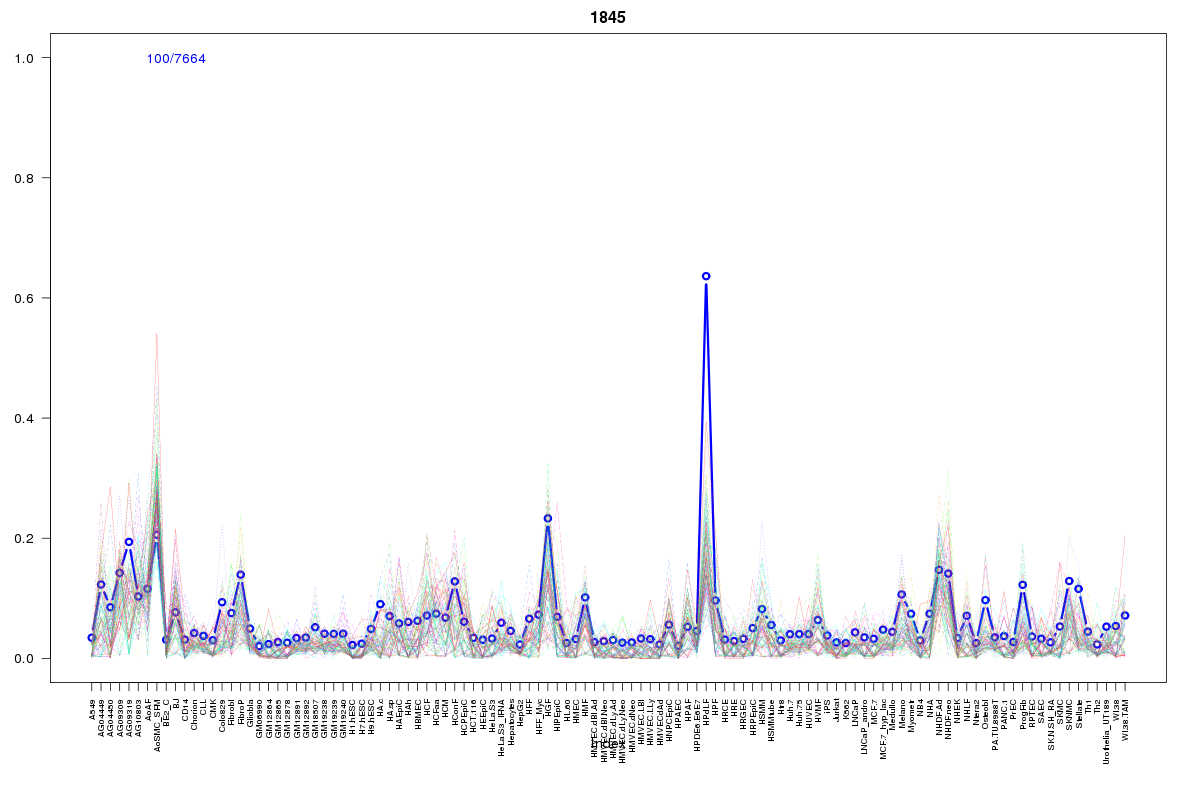 | 1845 | 1 |
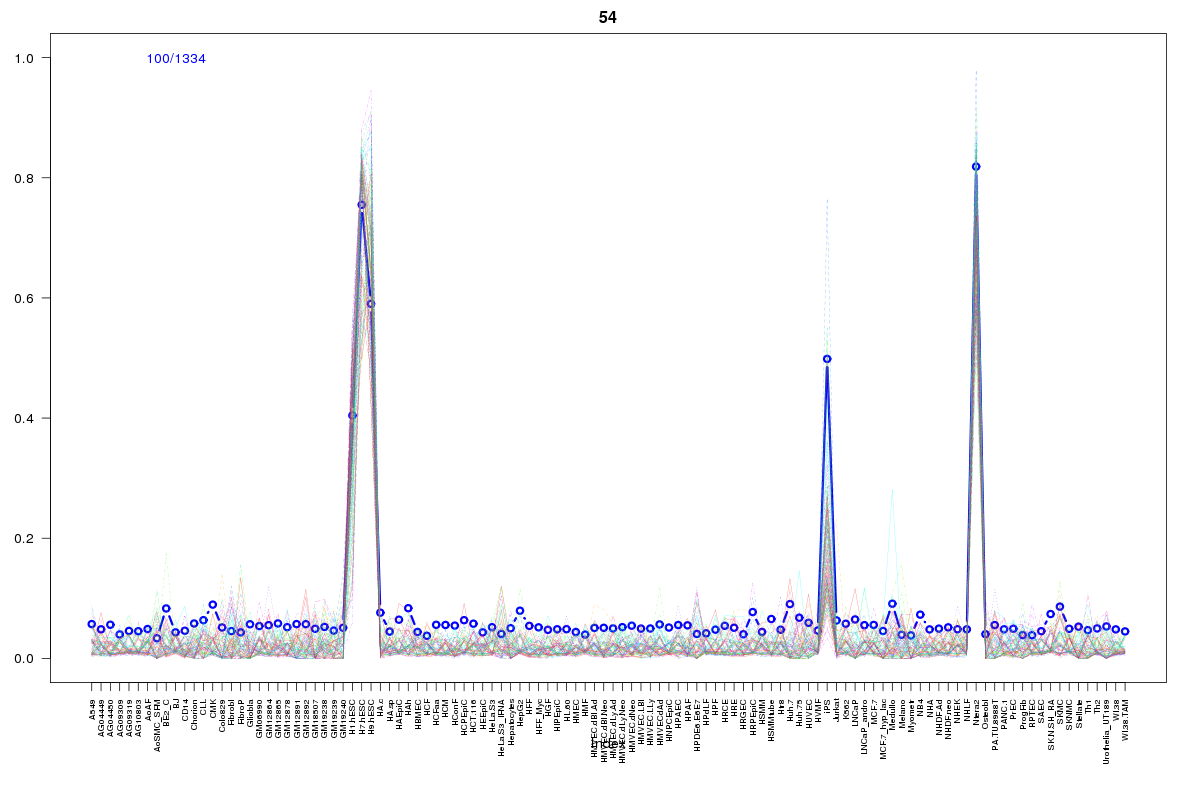 | 54 | 1 |
 | 957 | 1 |
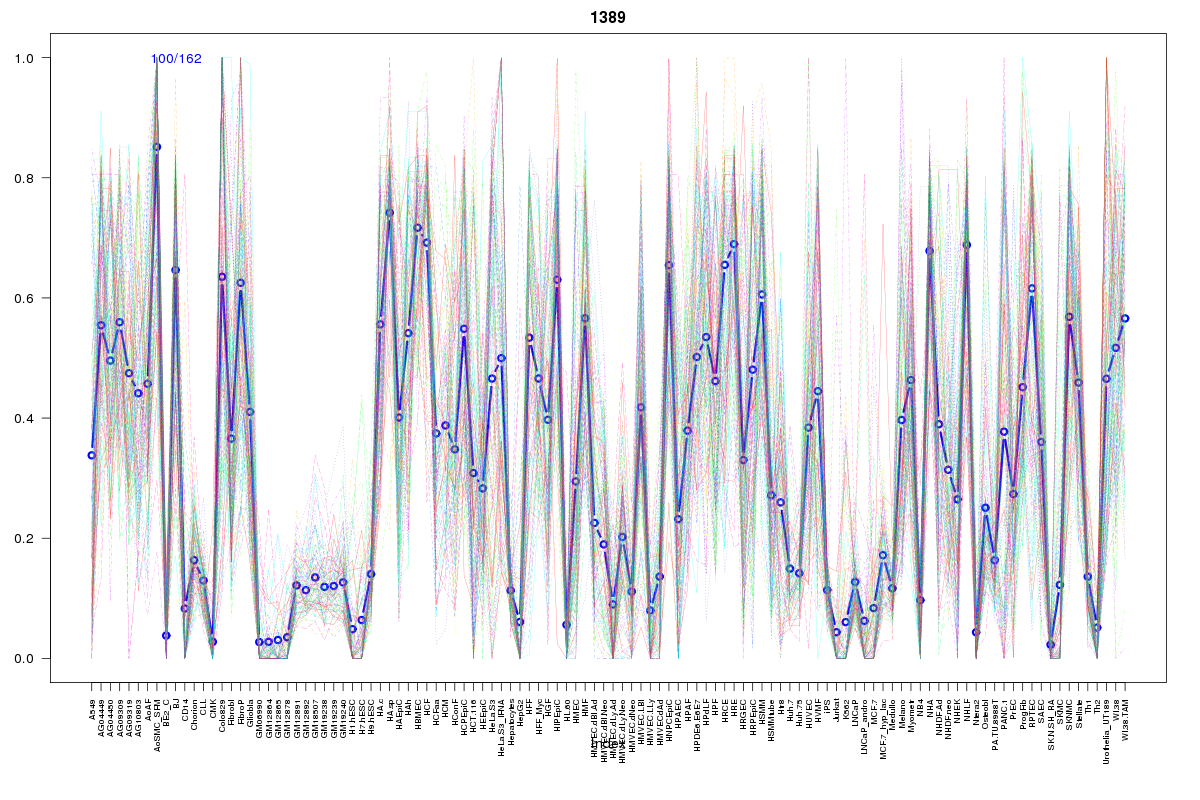 | 1389 | 1 |
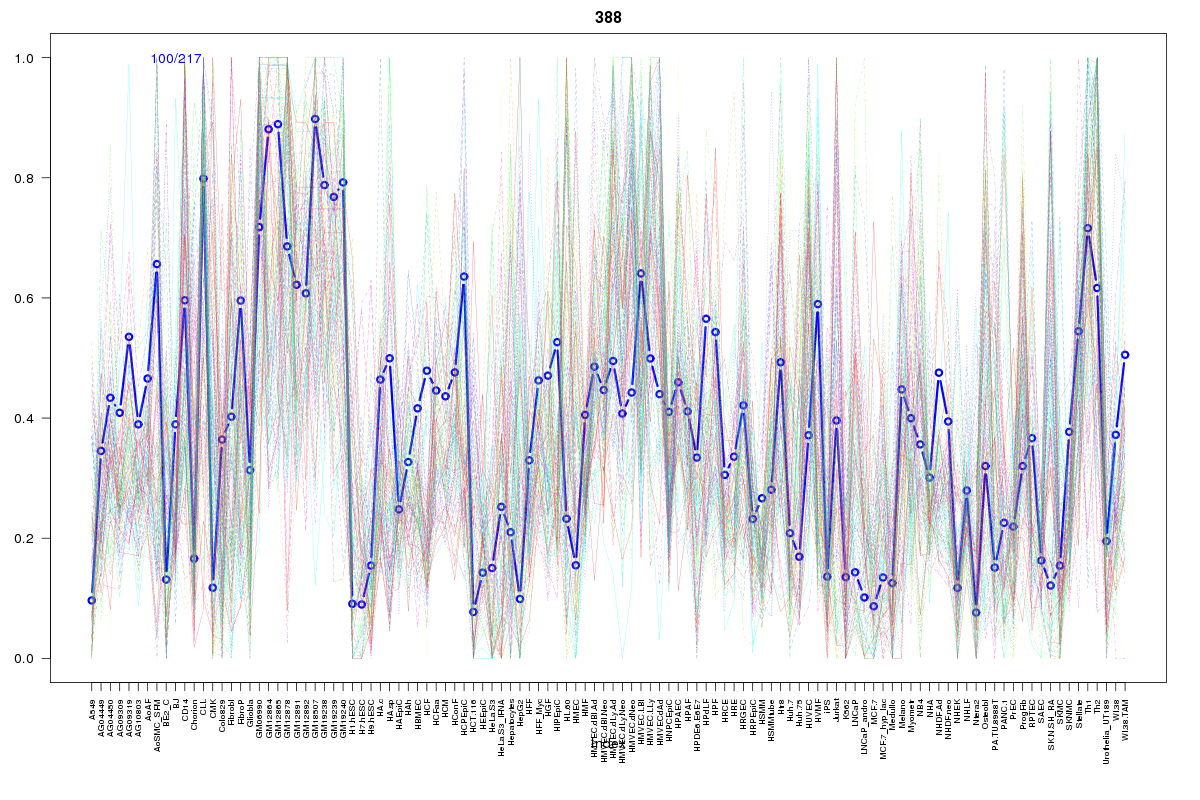 | 388 | 1 |
 | 946 | 1 |
 | 862 | 1 |
 | 332 | 1 |
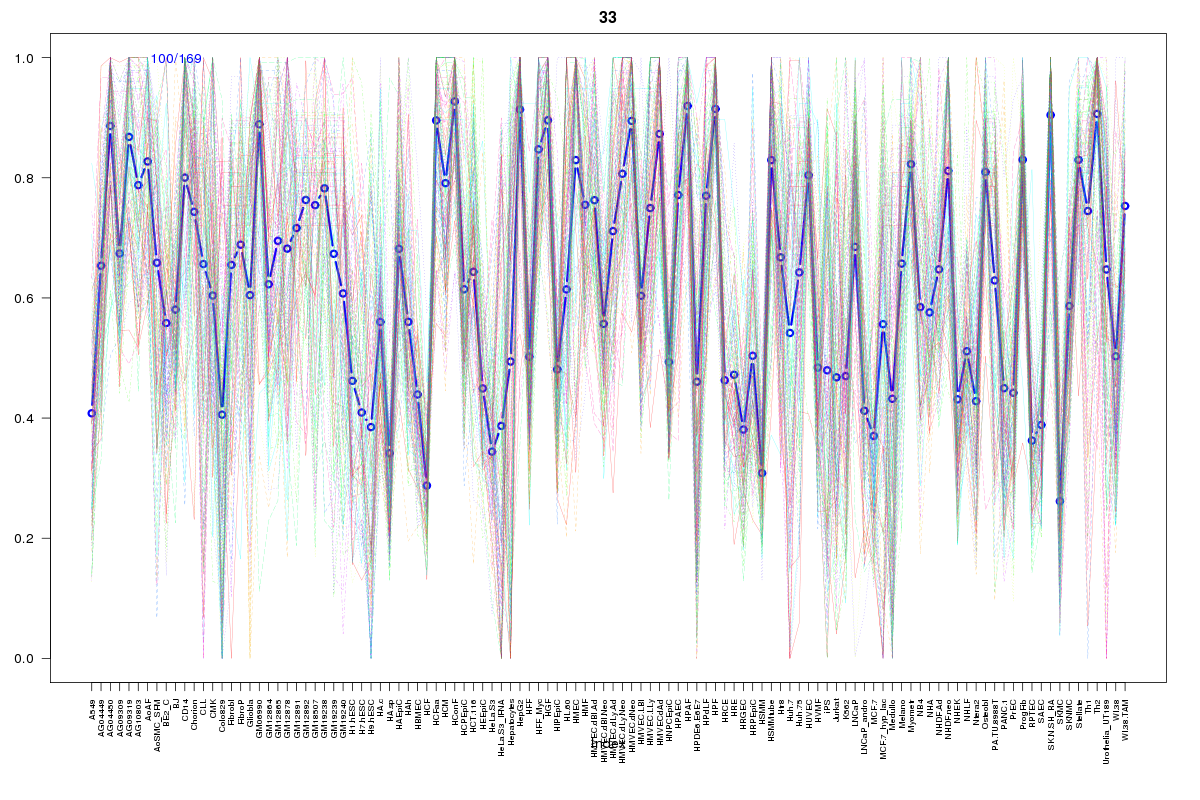 | 33 | 1 |
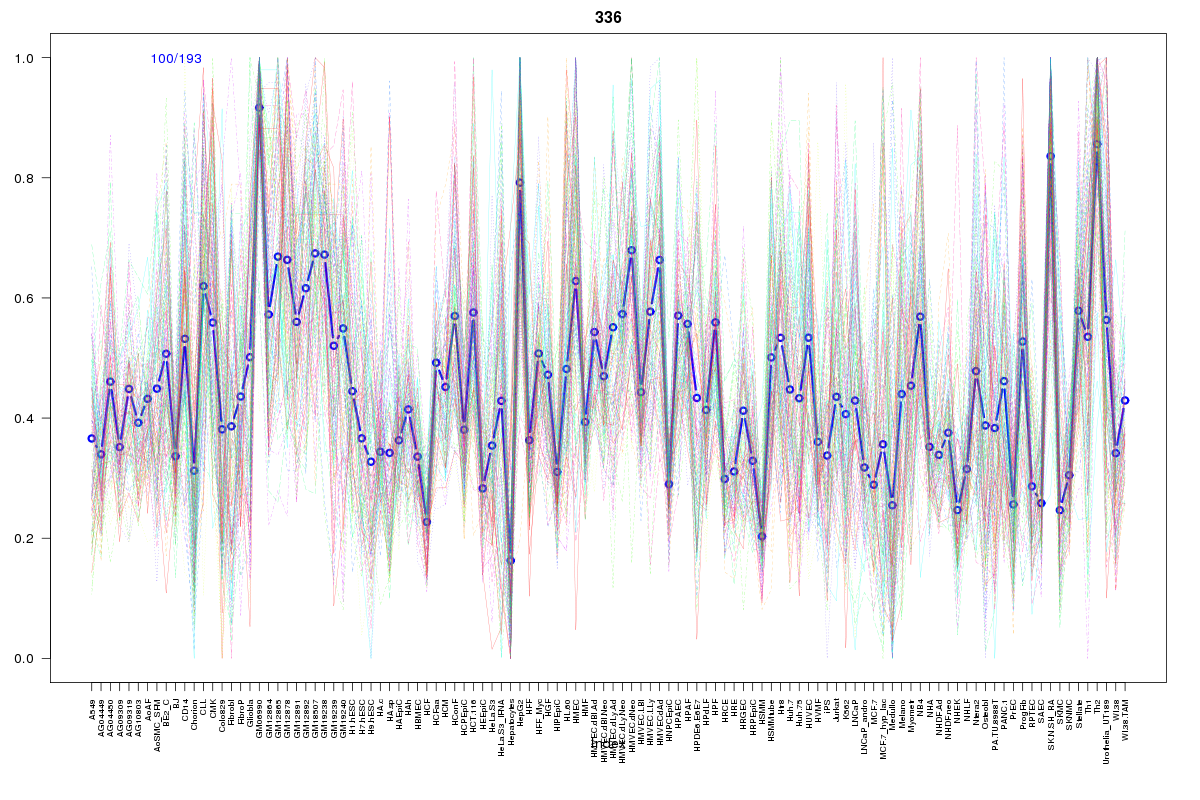 | 336 | 1 |
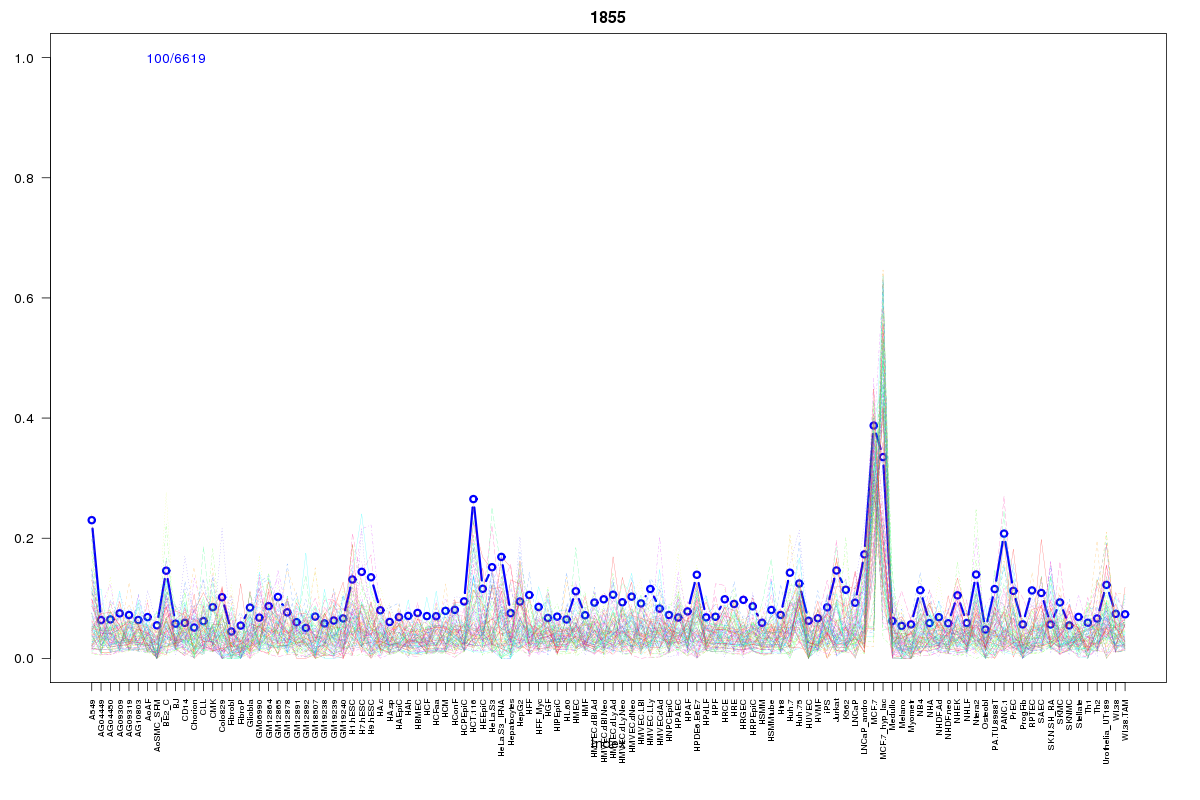 | 1855 | 1 |
 | 18 | 1 |
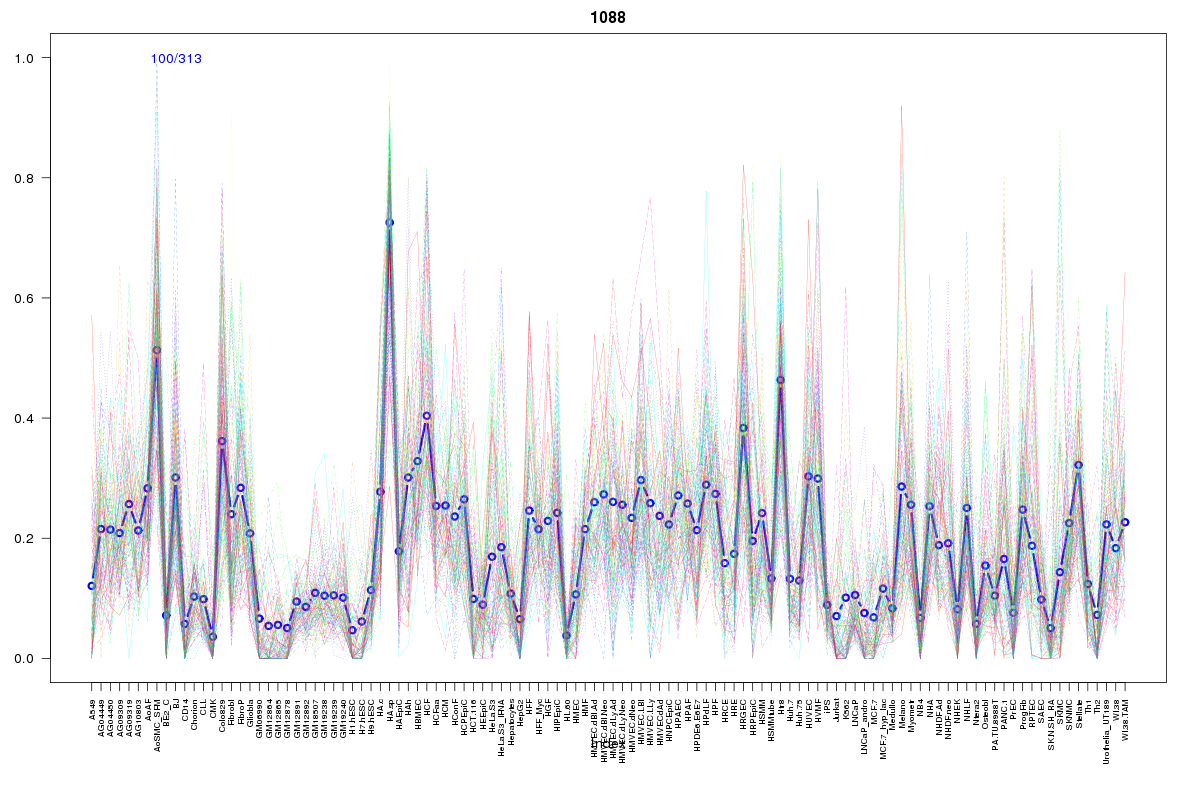 | 1088 | 1 |
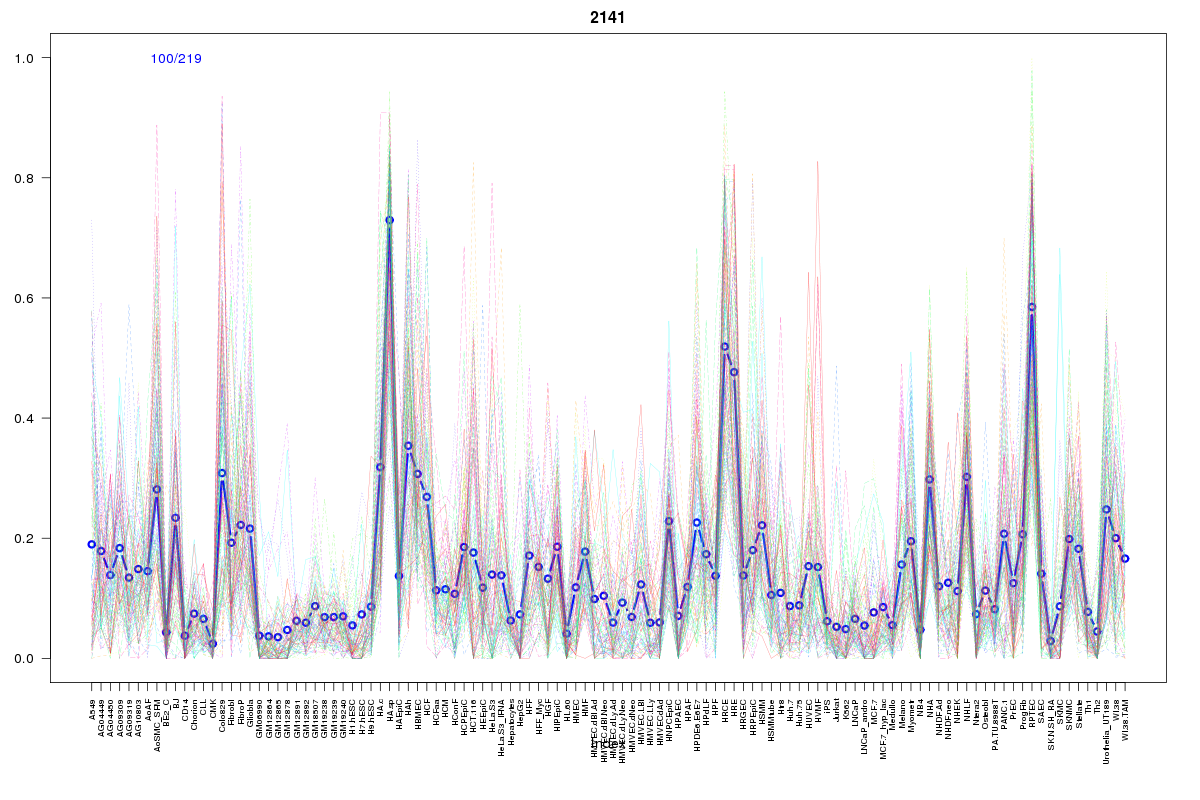 | 2141 | 1 |
 | 979 | 1 |
Resources
BED file downloads
Connects to 19 DHS sitesTop 10 Correlated DHS Sites
p-values indiciate significant higher or lower correlation| Location | Cluster | P-value |
|---|---|---|
| chr13:43597640-43597790 | 33 | 0 |
| chr13:43597860-43598010 | 336 | 0 |
| chr13:43566360-43566510 | 388 | 0.001 |
| chr13:43570780-43570930 | 946 | 0.001 |
| chr13:43597380-43597530 | 332 | 0.002 |
| chr13:43617540-43617690 | 18 | 0.009 |
| chr13:43662520-43662670 | 1790 | 0.01 |
| chr13:43564860-43565010 | 1845 | 0.01 |
| chr13:43565040-43565190 | 957 | 0.012 |
| chr13:43662240-43662390 | 979 | 0.015 |
| chr13:43629520-43629670 | 1088 | 0.015 |
External Databases
UCSCEnsembl (ENSG00000120675)