Gene: GTF3A
chr13: 27998680-28009825Expression Profile
(log scale)
Graphical Connections
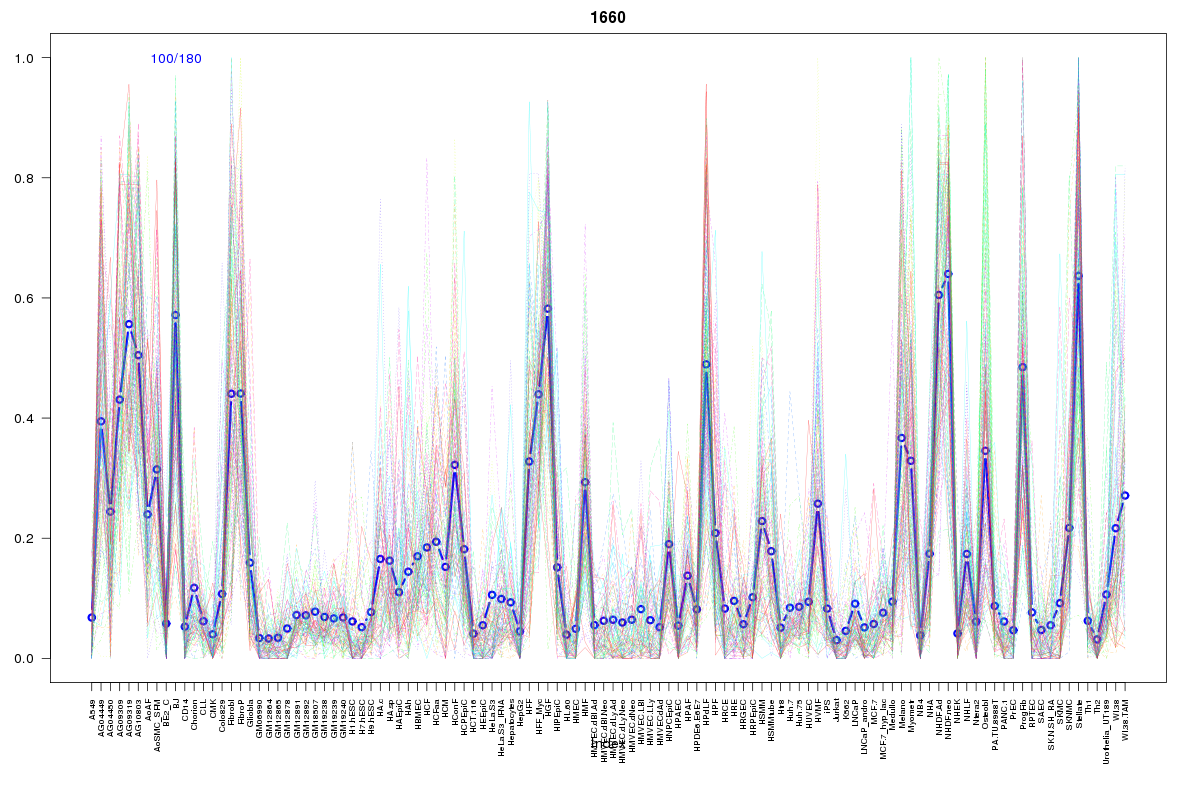
Distribution of linked clusters:
You may find it interesting if many of the connected DHS sites belong to the same cluster.| Cluster Profile | Cluster ID | Number of DHS sites in this cluster |
|---|---|---|
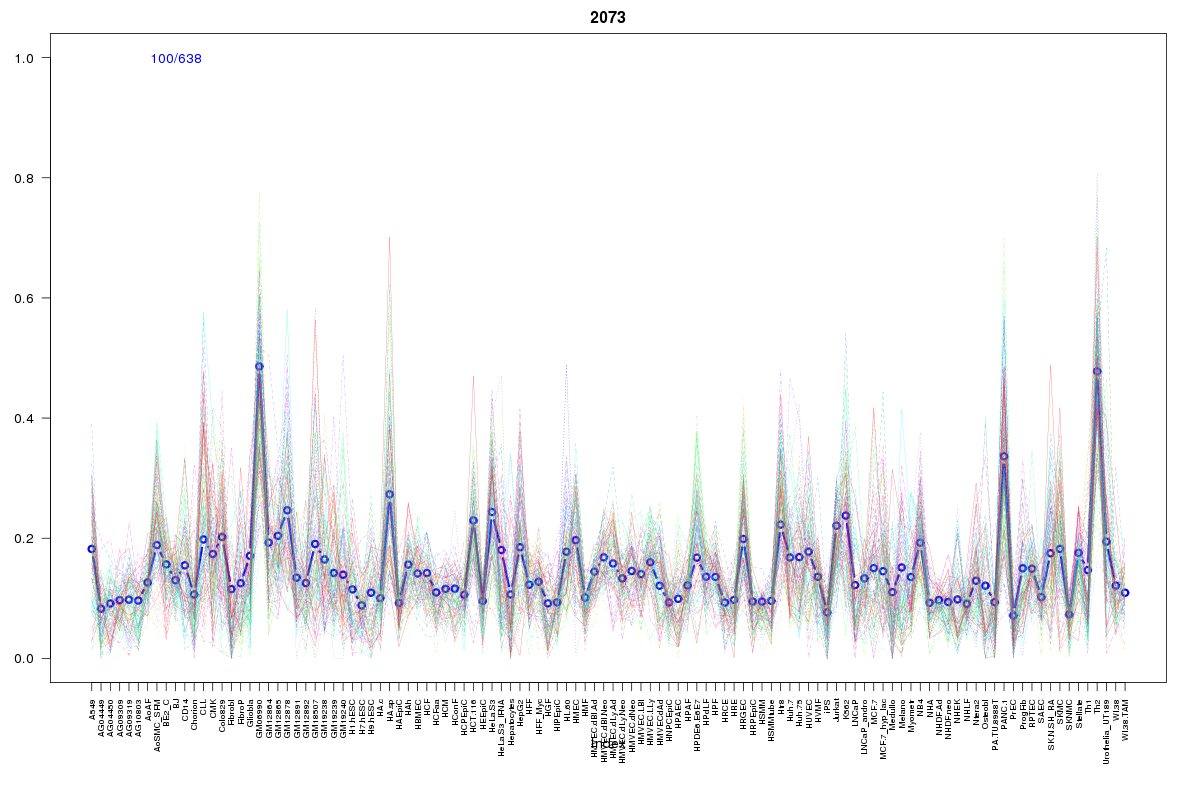 | 2073 | 2 |
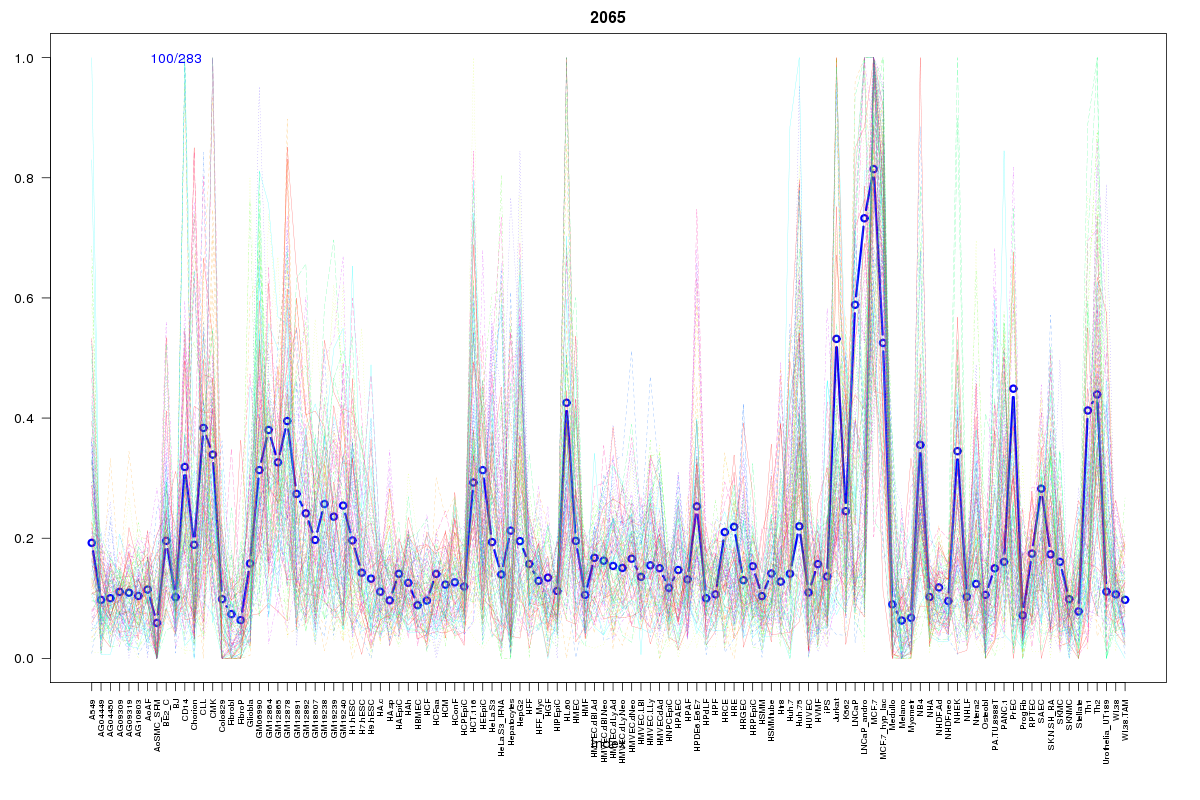 | 2065 | 2 |
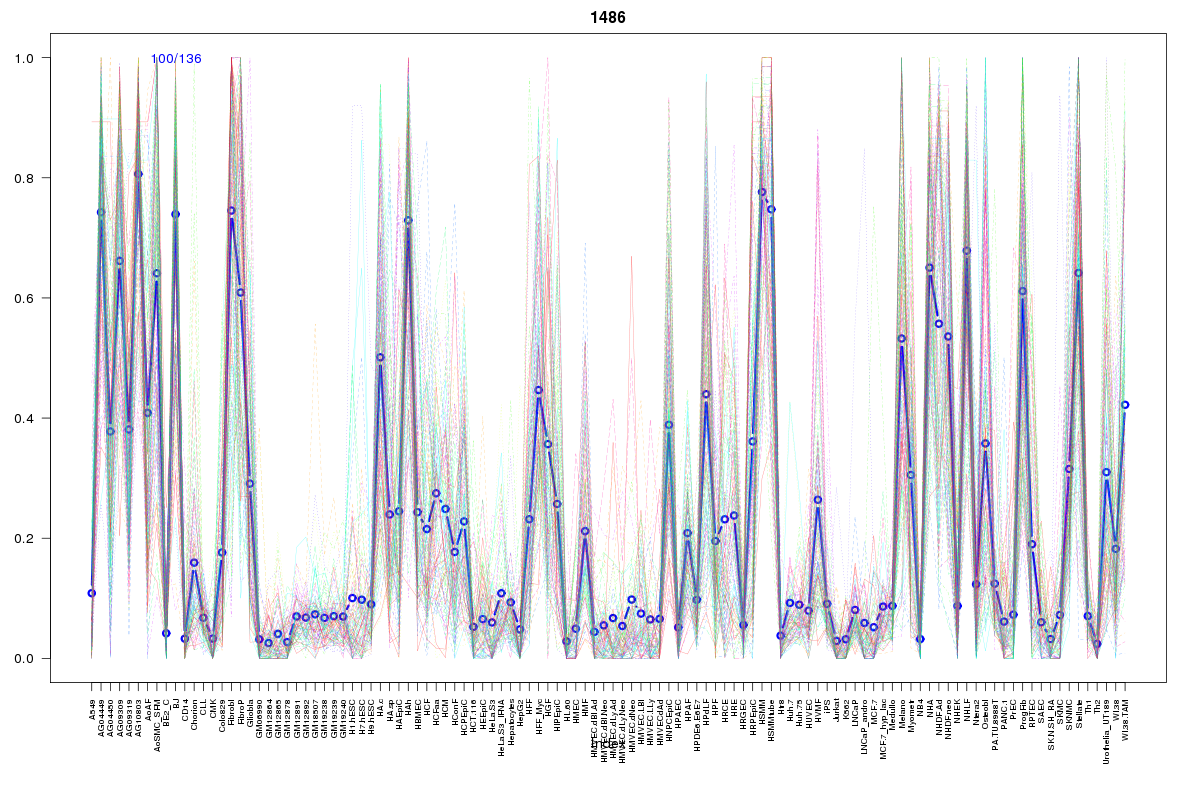 | 1486 | 2 |
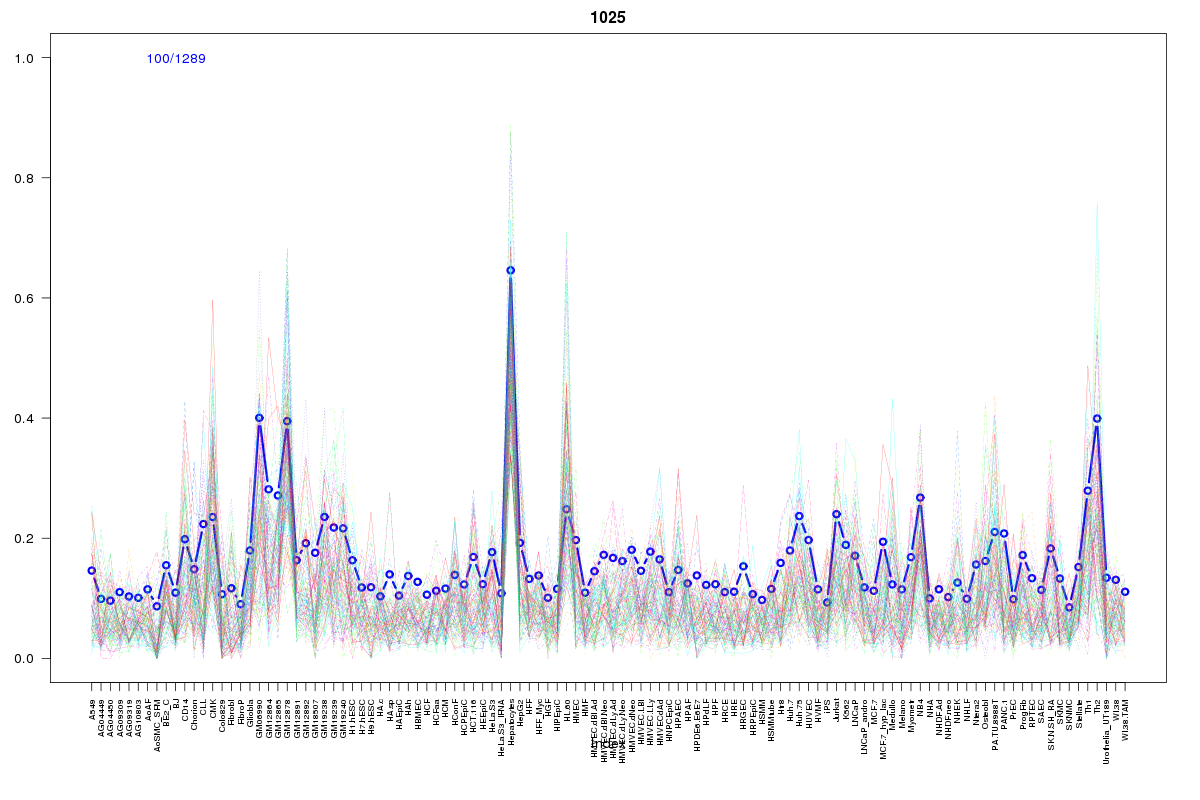 | 1025 | 1 |
 | 629 | 1 |
 | 2170 | 1 |
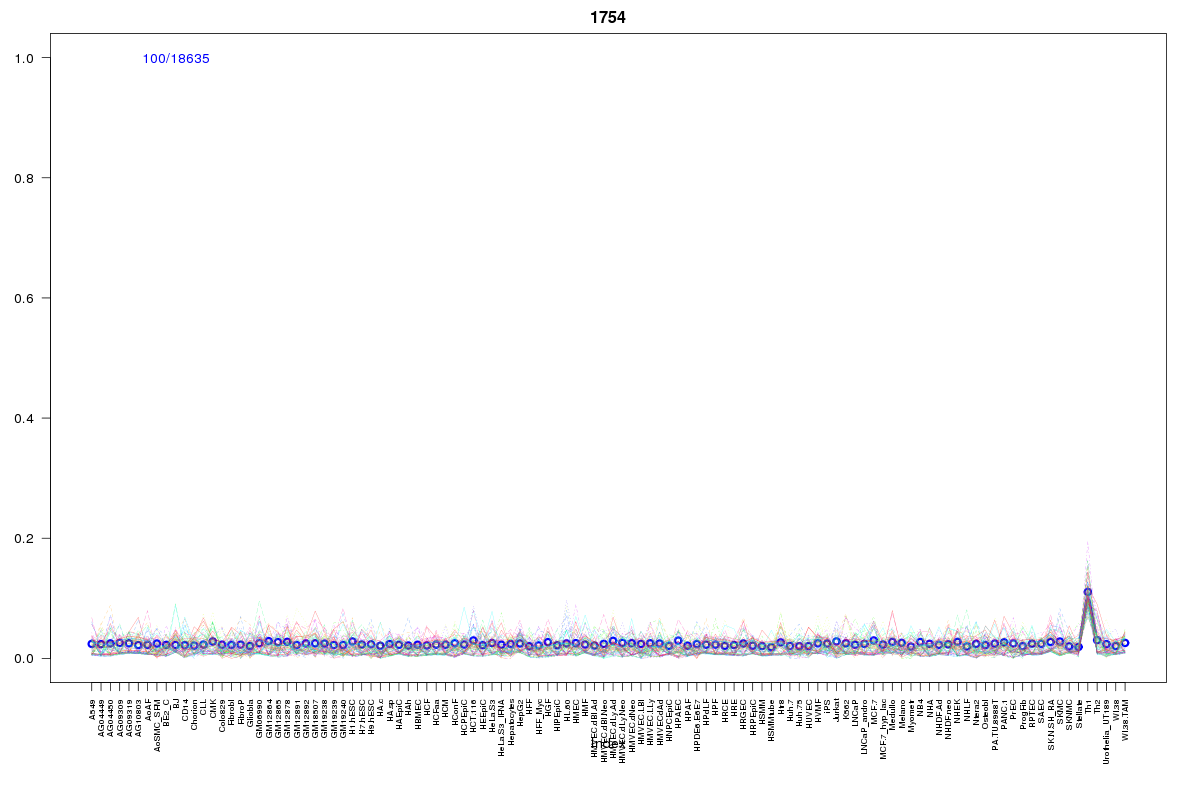 | 1754 | 1 |
 | 133 | 1 |
 | 192 | 1 |
 | 1056 | 1 |
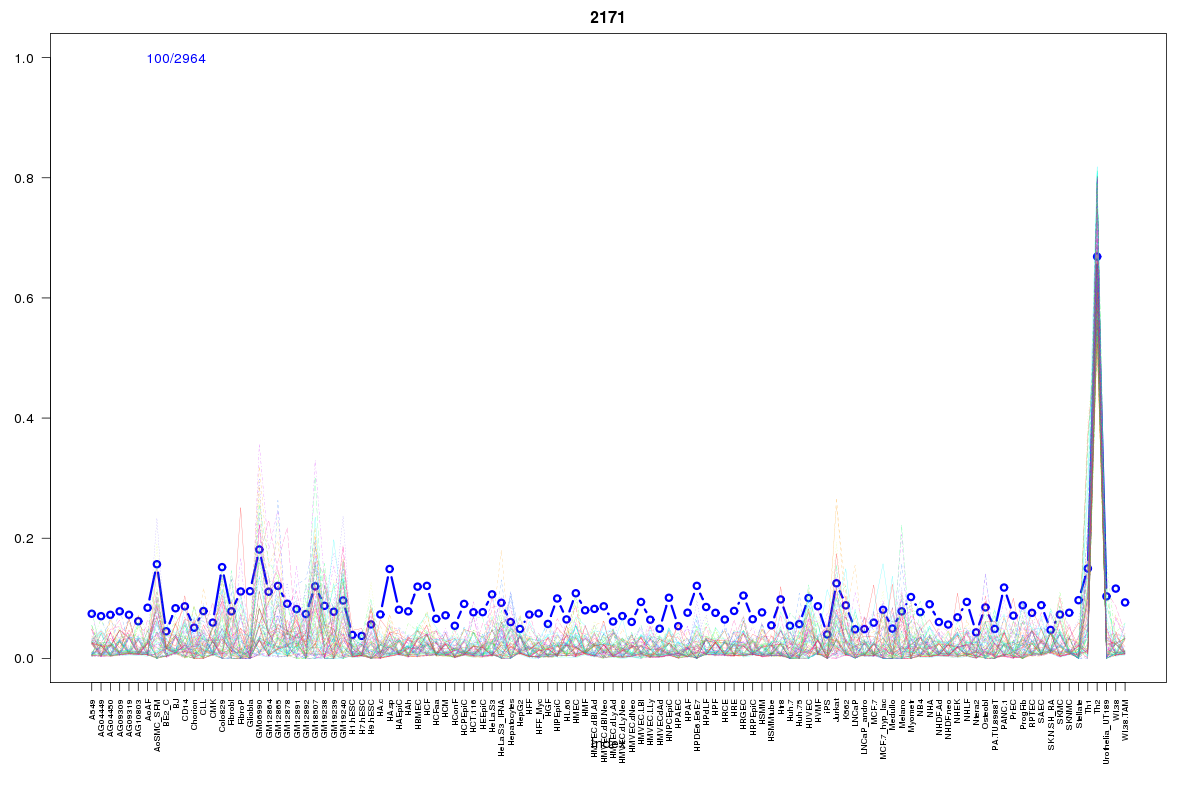 | 2171 | 1 |
 | 860 | 1 |
 | 2062 | 1 |
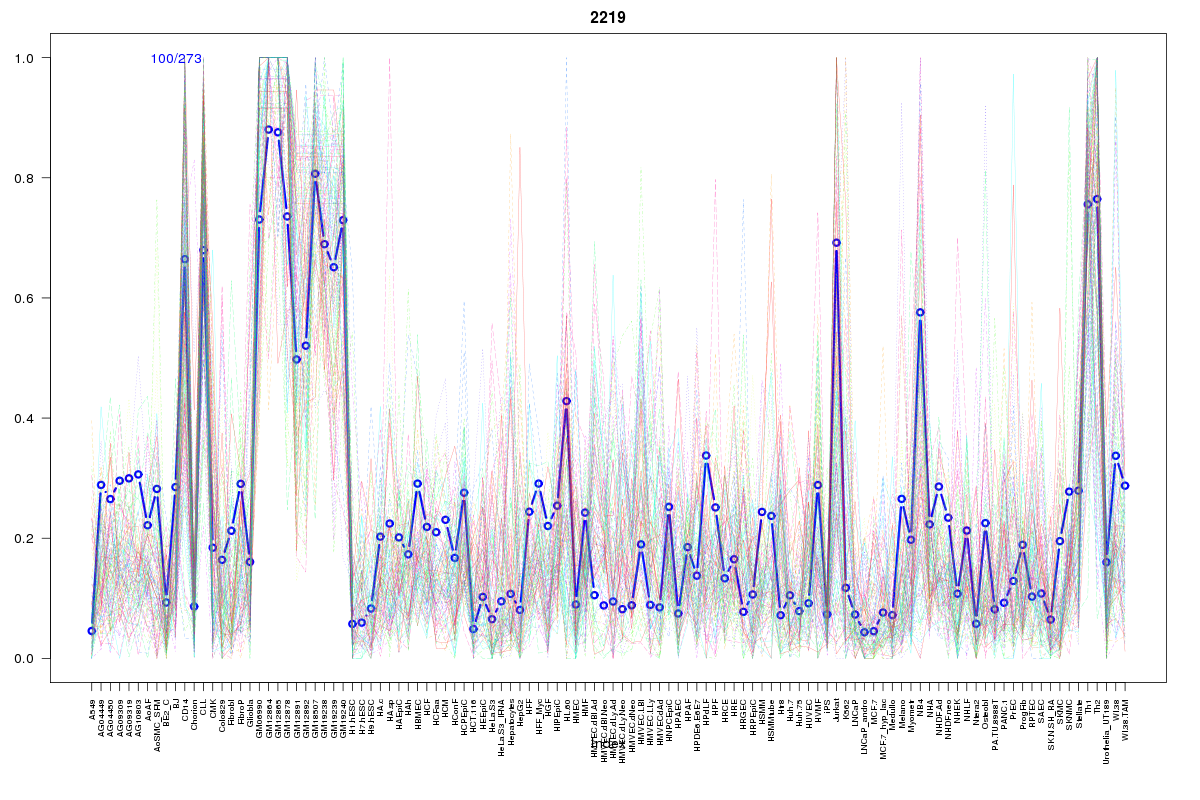 | 2219 | 1 |
 | 342 | 1 |
 | 1660 | 1 |
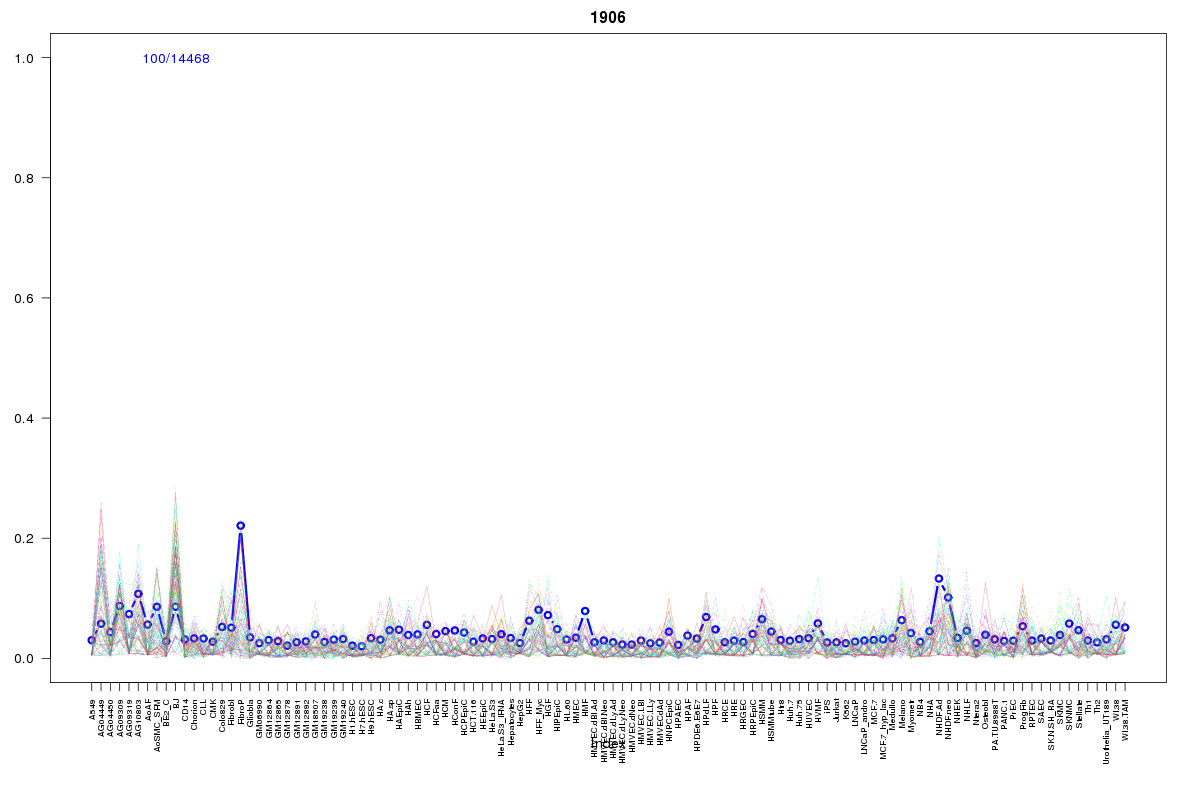 | 1906 | 1 |
 | 180 | 1 |
Resources
BED file downloads
Connects to 21 DHS sitesTop 10 Correlated DHS Sites
p-values indiciate significant higher or lower correlation| Location | Cluster | P-value |
|---|---|---|
| chr13:27999160-27999310 | 2073 | 0 |
| chr13:28000480-28000630 | 2065 | 0 |
| chr13:28024560-28024710 | 192 | 0.003 |
| chr13:28029700-28029850 | 2171 | 0.003 |
| chr13:28029545-28029695 | 1056 | 0.004 |
| chr13:28001280-28001430 | 2170 | 0.004 |
| chr13:27999780-27999930 | 629 | 0.005 |
| chr13:27998420-27998570 | 180 | 0.006 |
| chr13:27927460-27927610 | 2219 | 0.006 |
| chr13:28029865-28030015 | 2062 | 0.009 |
| chr13:28023840-28023990 | 2073 | 0.01 |
External Databases
UCSCEnsembl (ENSG00000122034)