Gene: ATP5E
chr20: 57600521-57607437Expression Profile
(log scale)
Graphical Connections
Distribution of linked clusters:
You may find it interesting if many of the connected DHS sites belong to the same cluster.| Cluster Profile | Cluster ID | Number of DHS sites in this cluster |
|---|---|---|
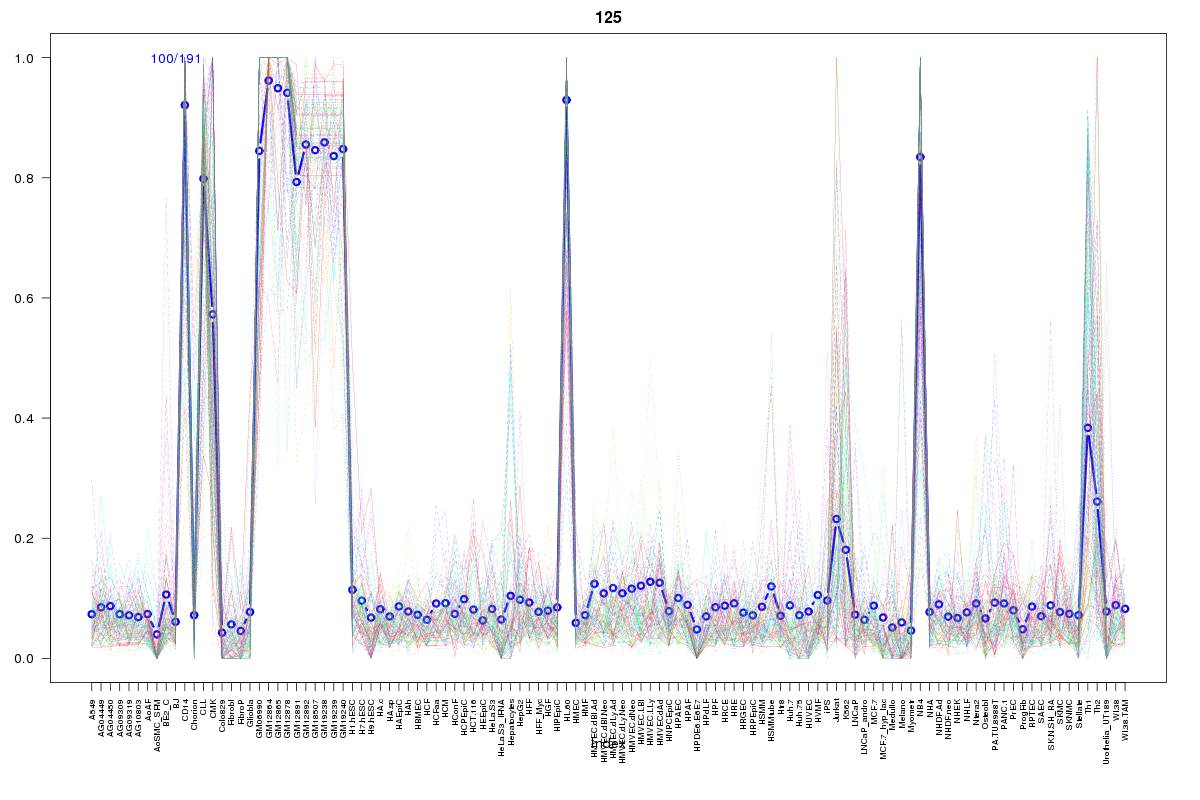 | 125 | 3 |
 | 2107 | 1 |
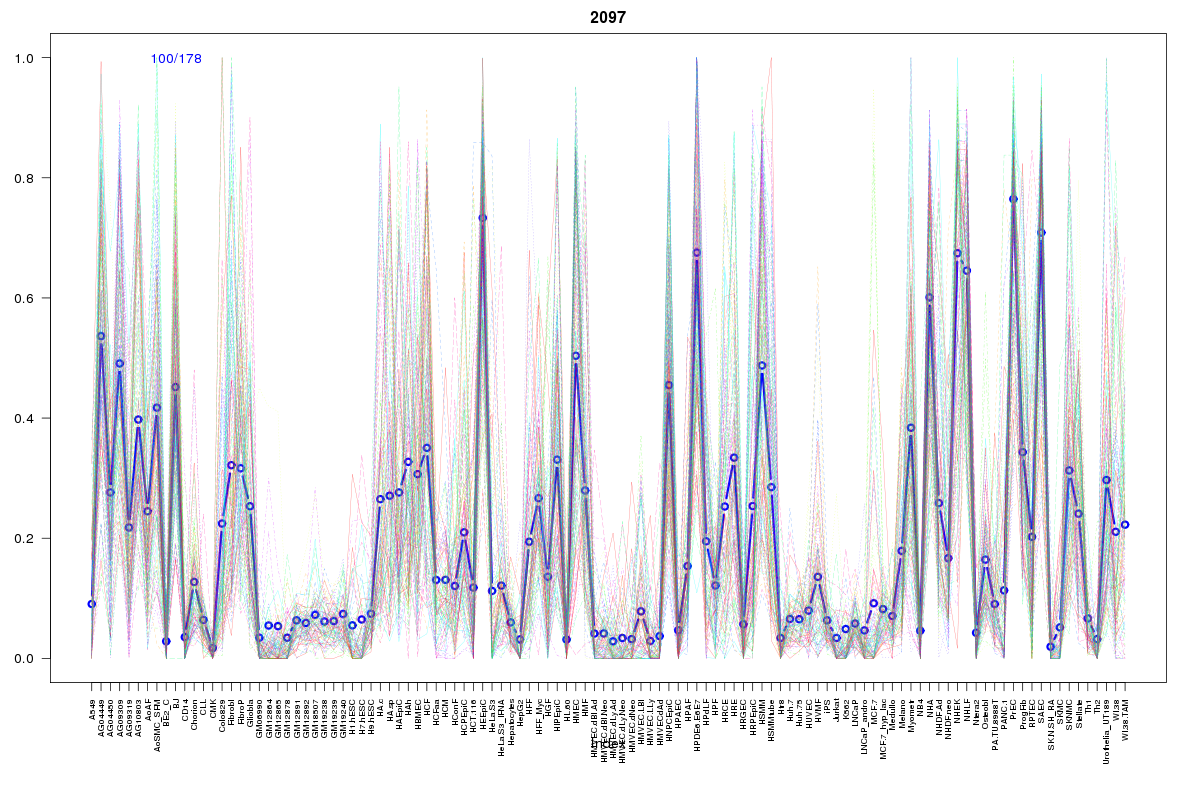 | 2097 | 1 |
 | 66 | 1 |
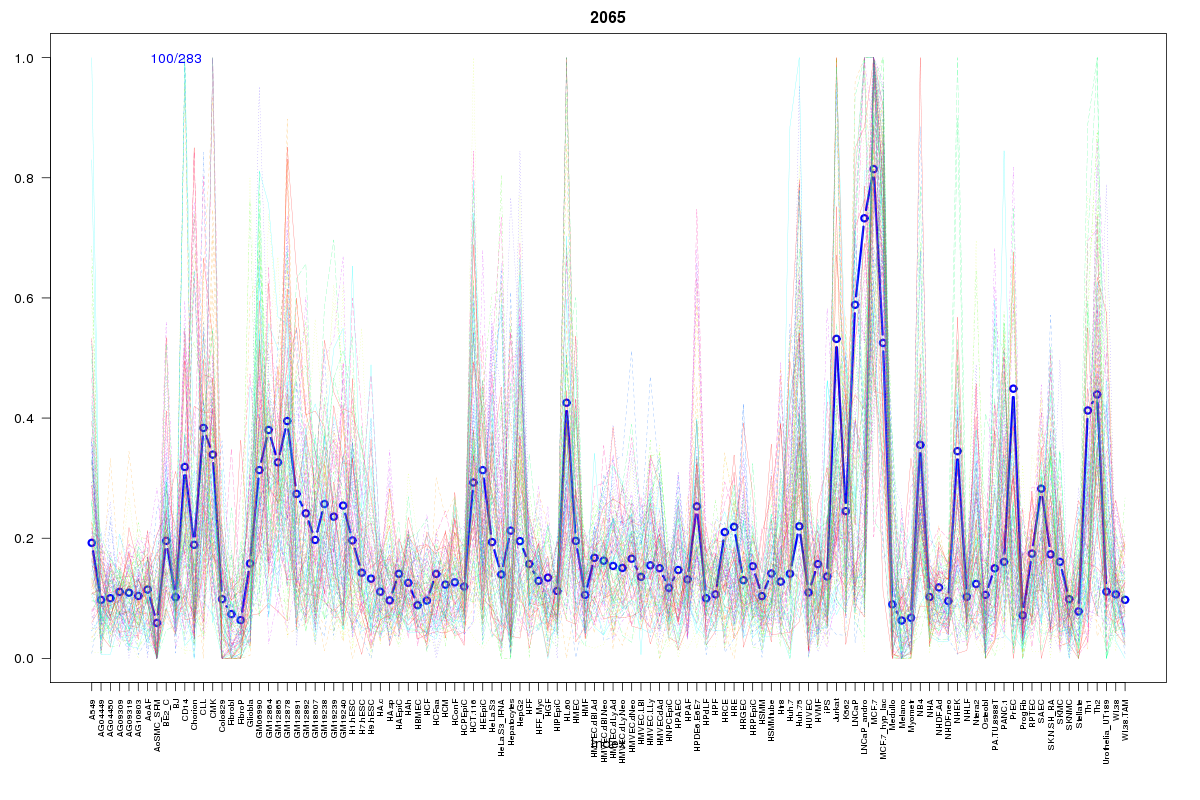 | 2065 | 1 |
 | 881 | 1 |
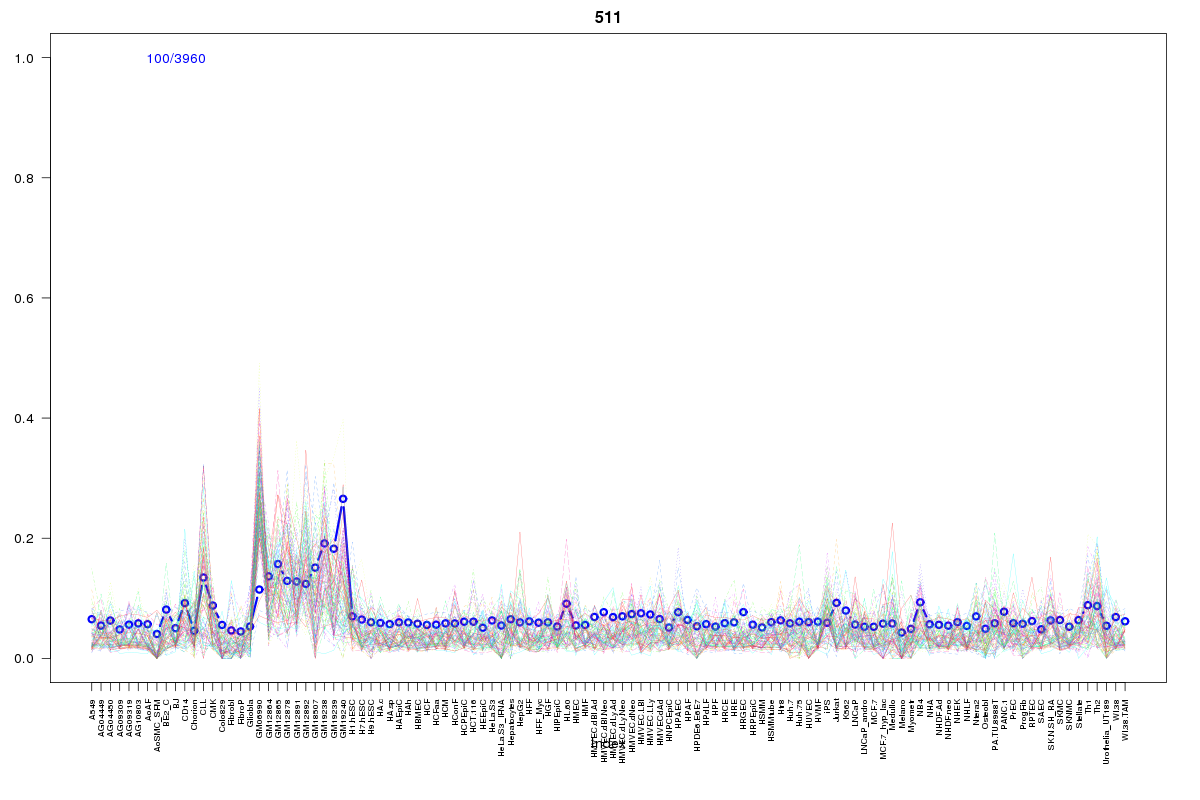 | 511 | 1 |
 | 77 | 1 |
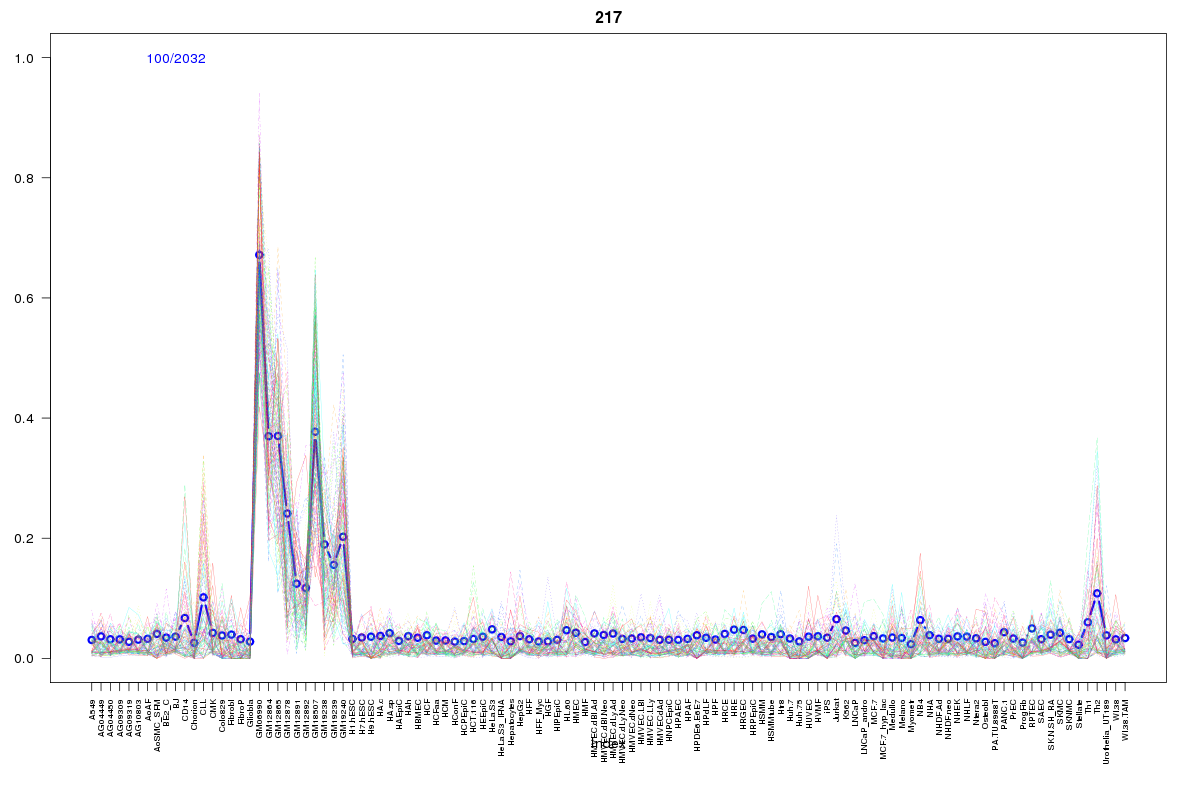 | 217 | 1 |
 | 324 | 1 |
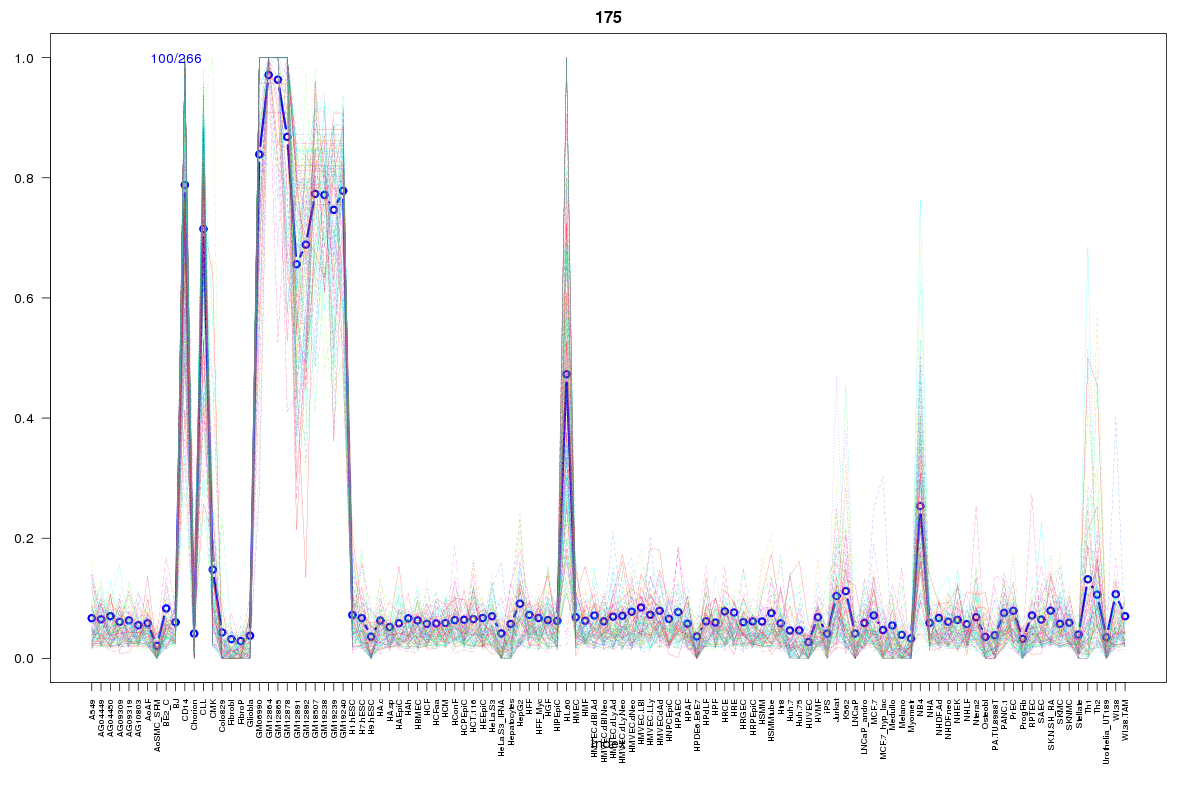 | 175 | 1 |
 | 498 | 1 |
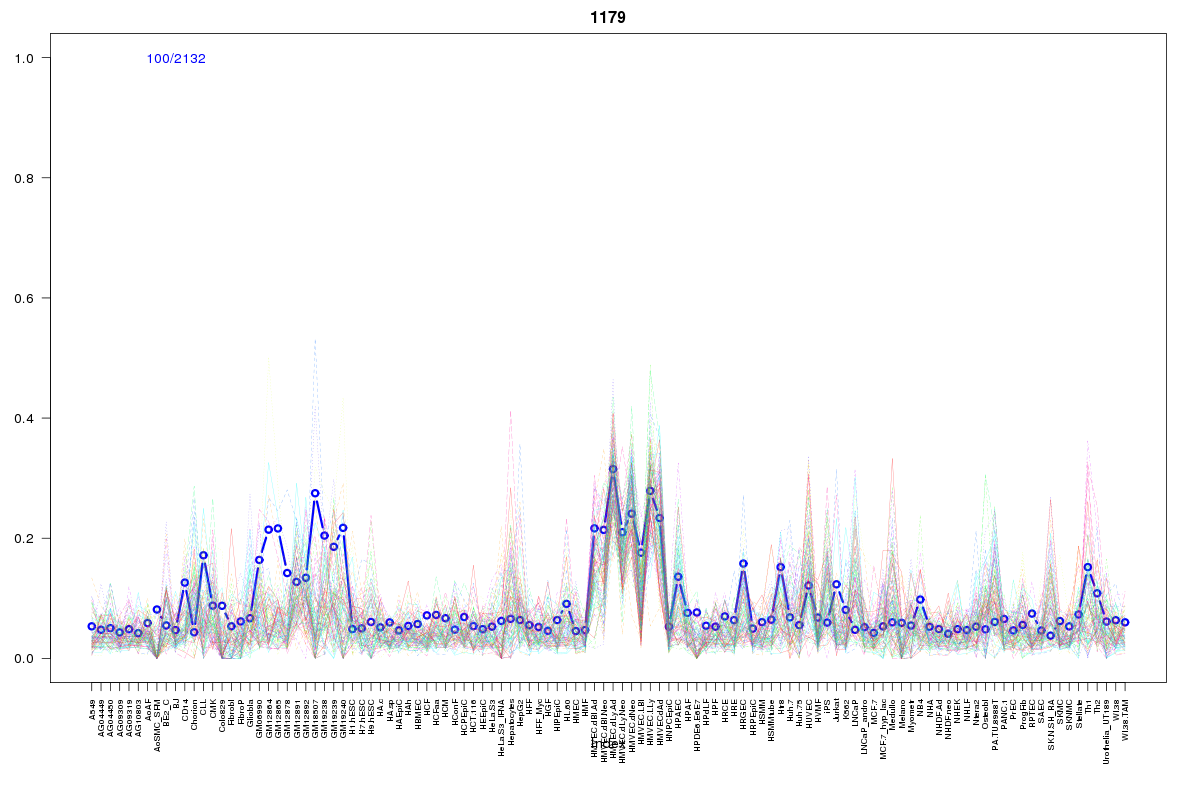 | 1179 | 1 |
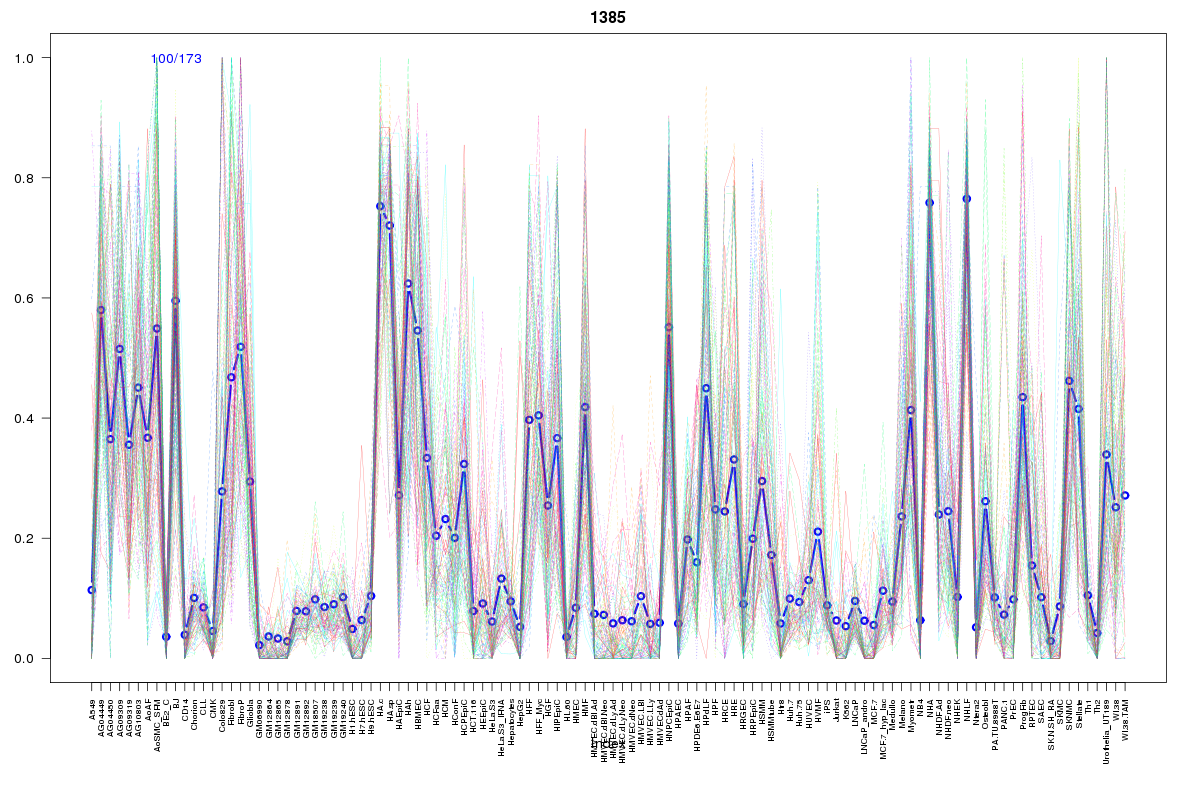 | 1385 | 1 |
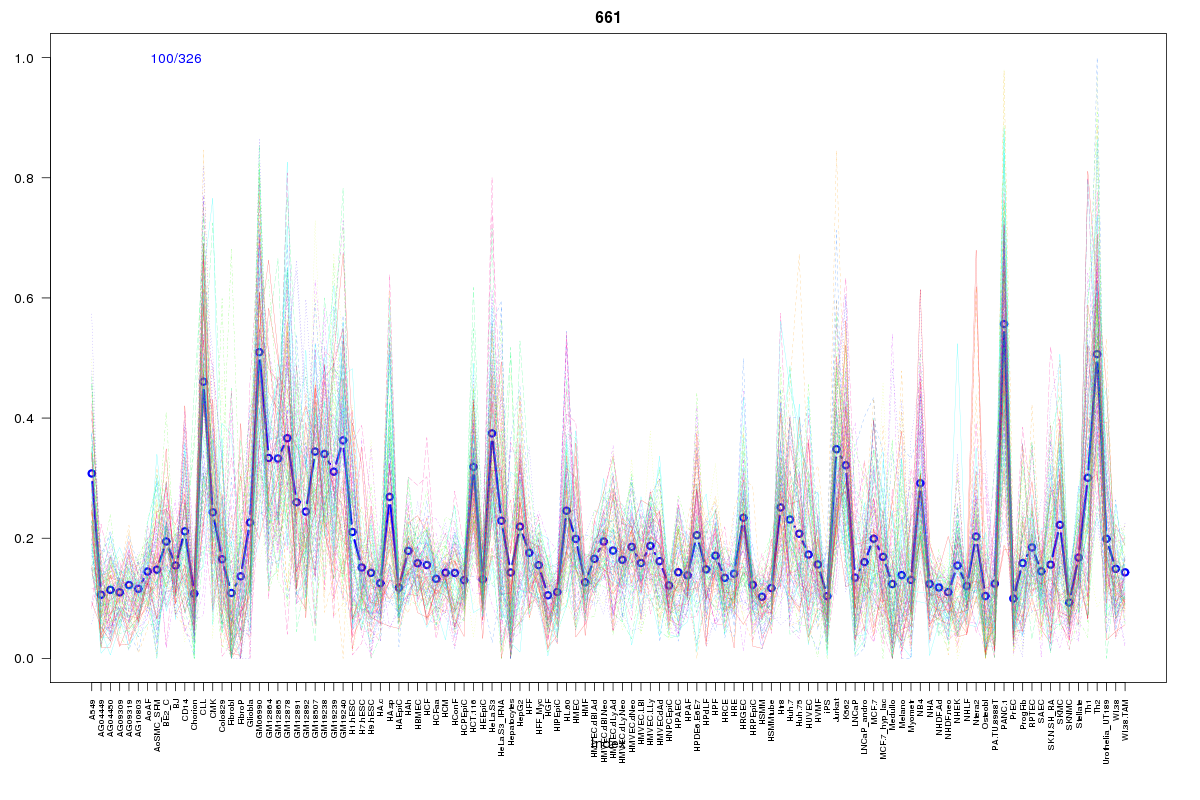 | 661 | 1 |
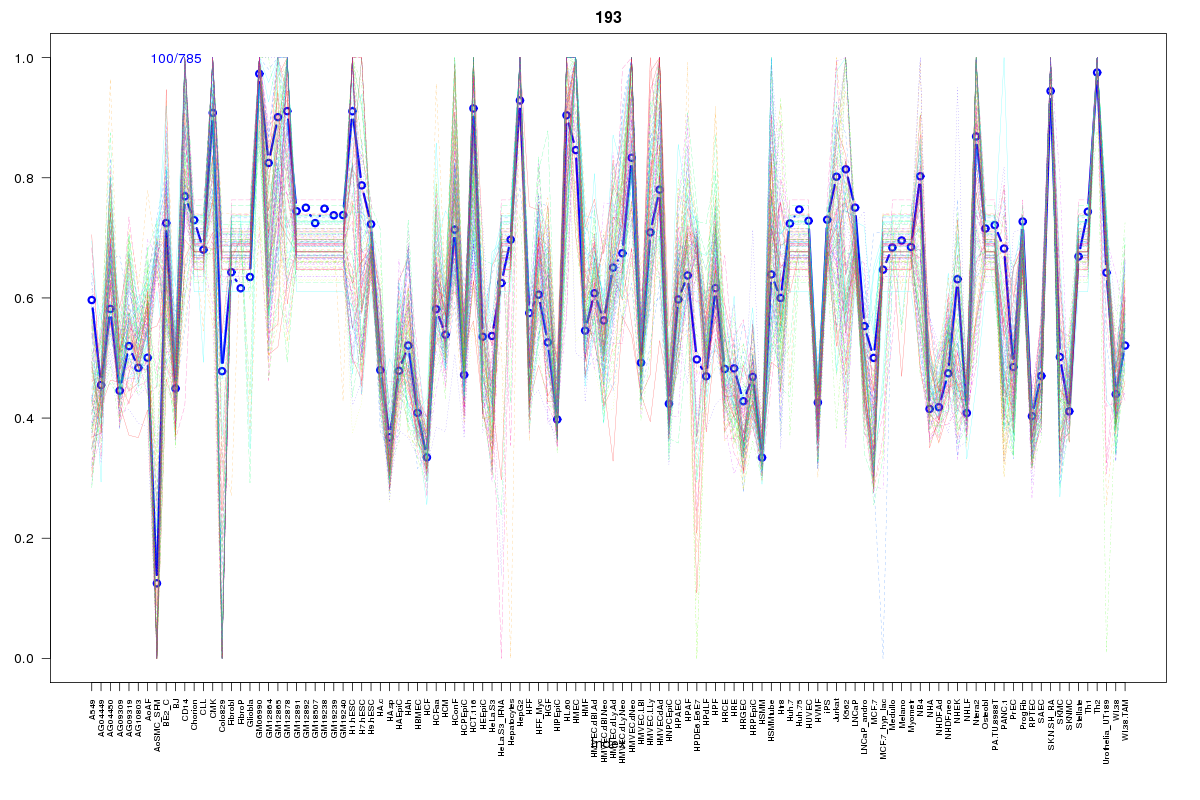 | 193 | 1 |
Resources
BED file downloads
Connects to 18 DHS sitesTop 10 Correlated DHS Sites
p-values indiciate significant higher or lower correlation| Location | Cluster | P-value |
|---|---|---|
| chr20:57607840-57607990 | 661 | 0 |
| chr20:57557025-57557175 | 2065 | 0.003 |
| chr20:57591900-57592050 | 1179 | 0.003 |
| chr20:57582920-57583070 | 125 | 0.004 |
| chr20:57568565-57568715 | 511 | 0.006 |
| chr20:57657180-57657330 | 2107 | 0.006 |
| chr20:57580360-57580510 | 77 | 0.006 |
| chr20:57583280-57583430 | 175 | 0.014 |
| chr20:57582645-57582795 | 217 | 0.016 |
| chr20:57580040-57580190 | 125 | 0.016 |
| chr20:57579780-57579930 | 125 | 0.016 |
External Databases
UCSCEnsembl (ENSG00000124172)