Gene: HCST
chr19: 36393381-36395279Expression Profile
(log scale)
Graphical Connections
Distribution of linked clusters:
You may find it interesting if many of the connected DHS sites belong to the same cluster.| Cluster Profile | Cluster ID | Number of DHS sites in this cluster |
|---|---|---|
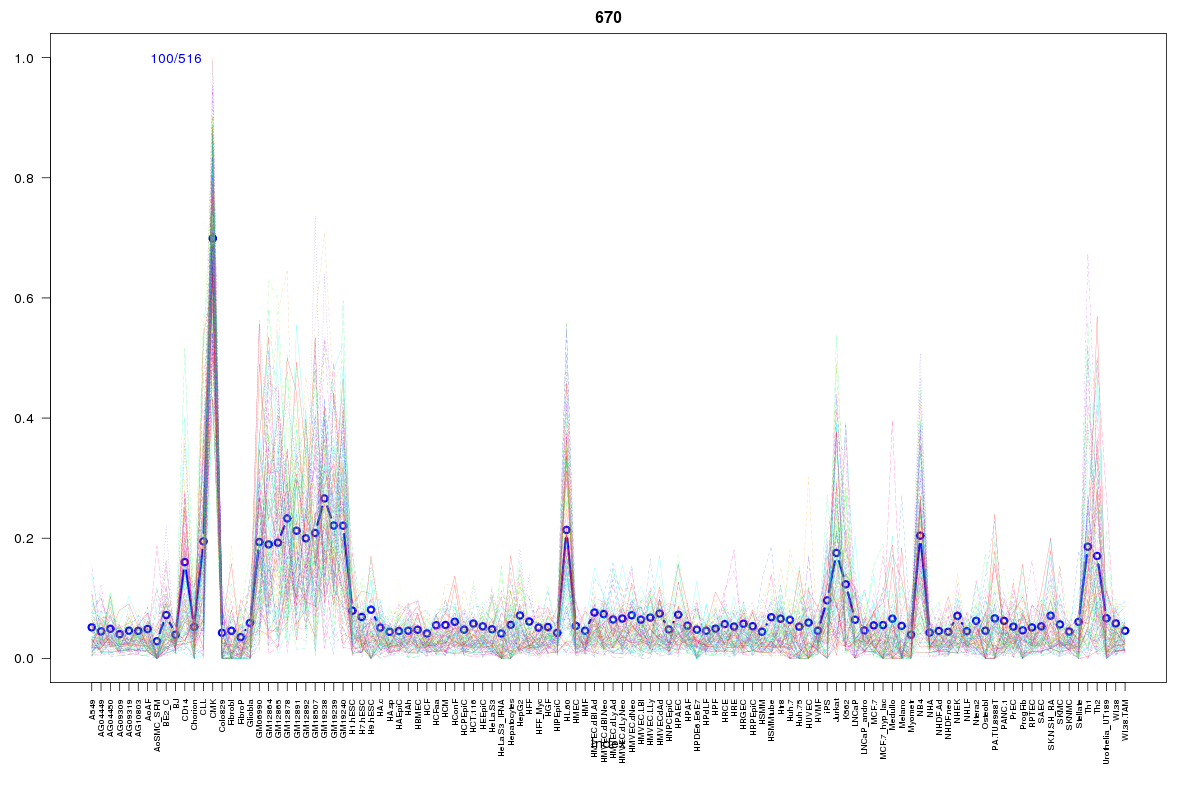 | 670 | 3 |
 | 570 | 3 |
 | 1604 | 2 |
 | 2062 | 2 |
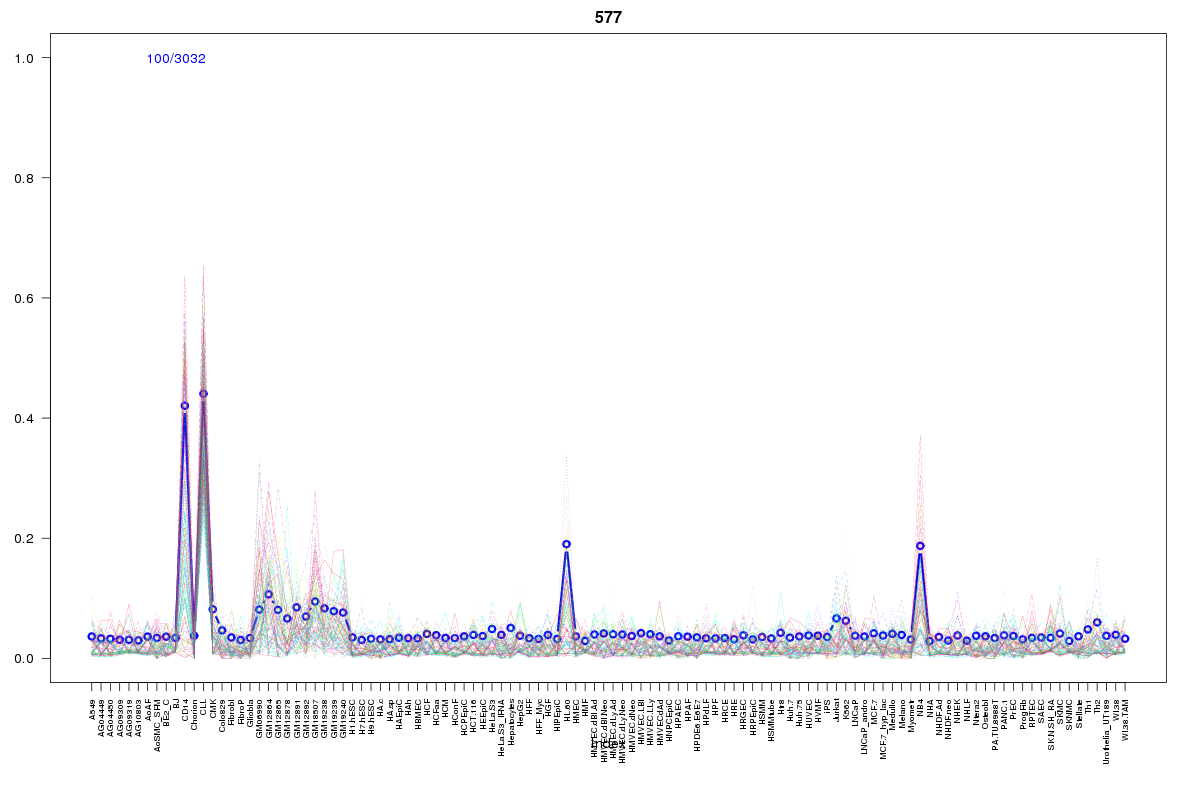 | 577 | 2 |
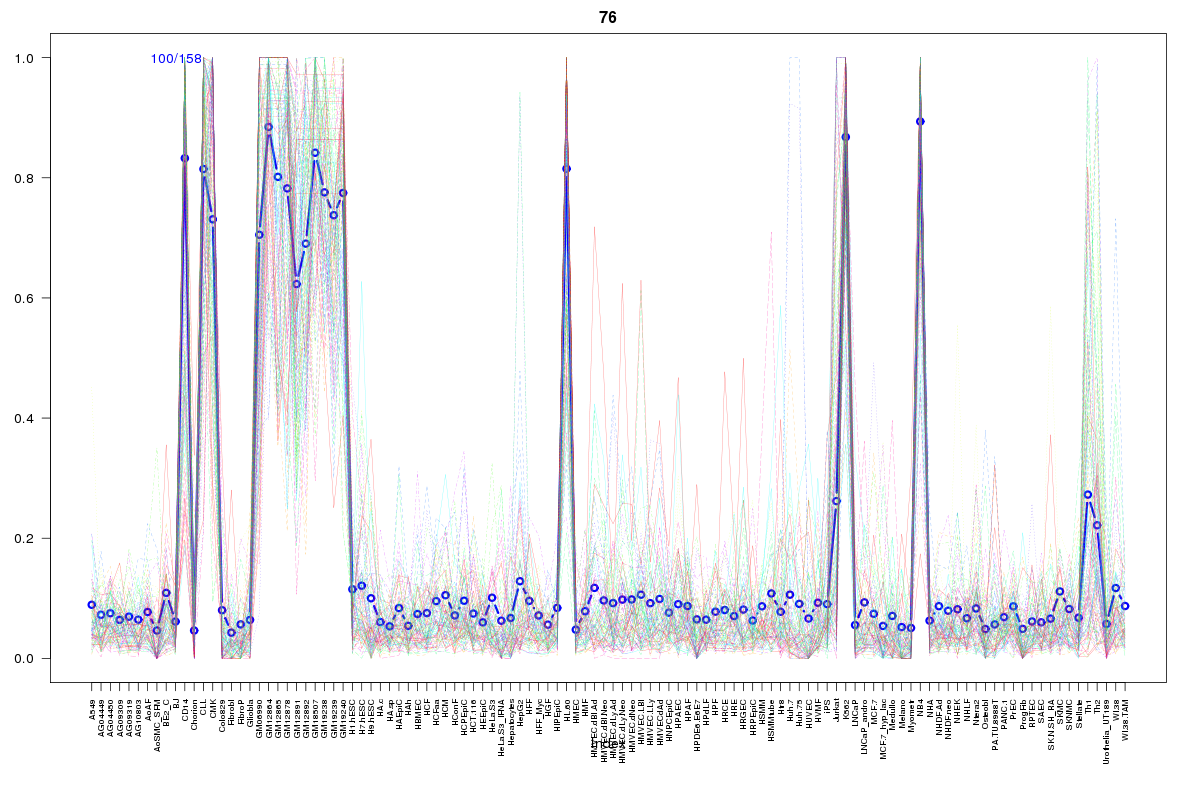 | 76 | 2 |
 | 66 | 1 |
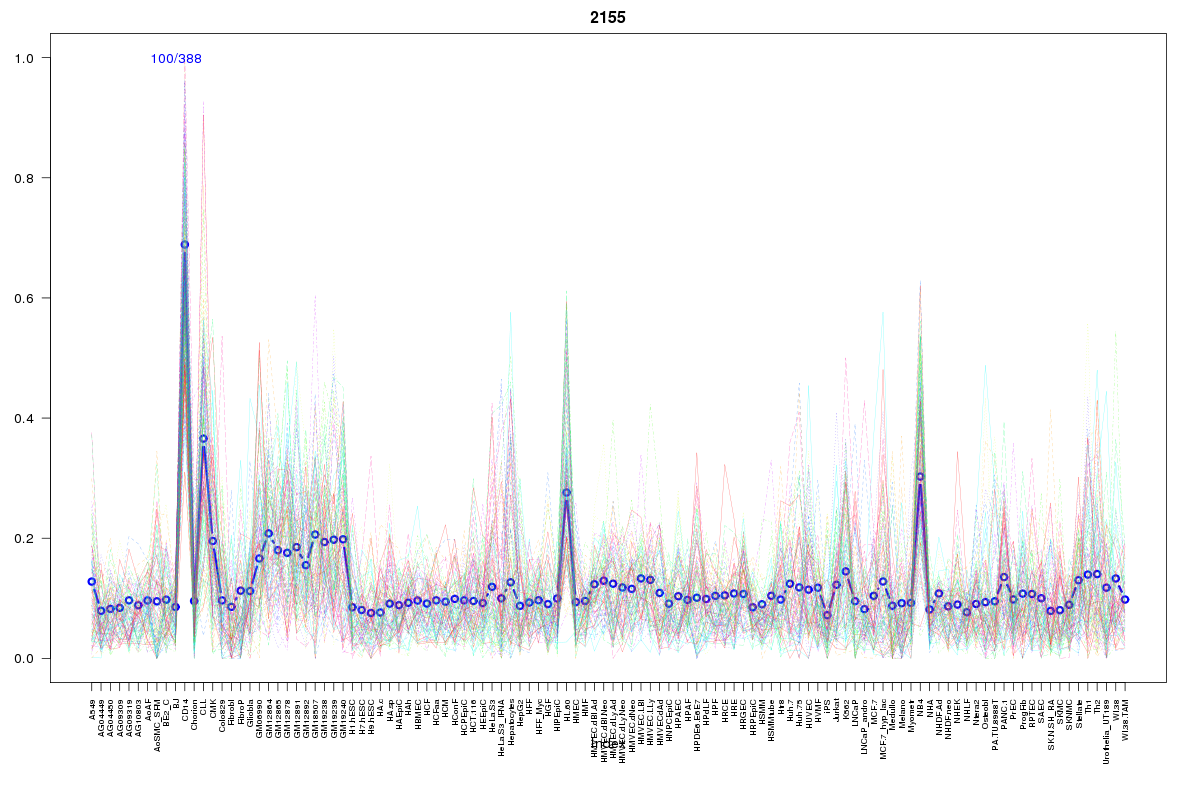 | 2155 | 1 |
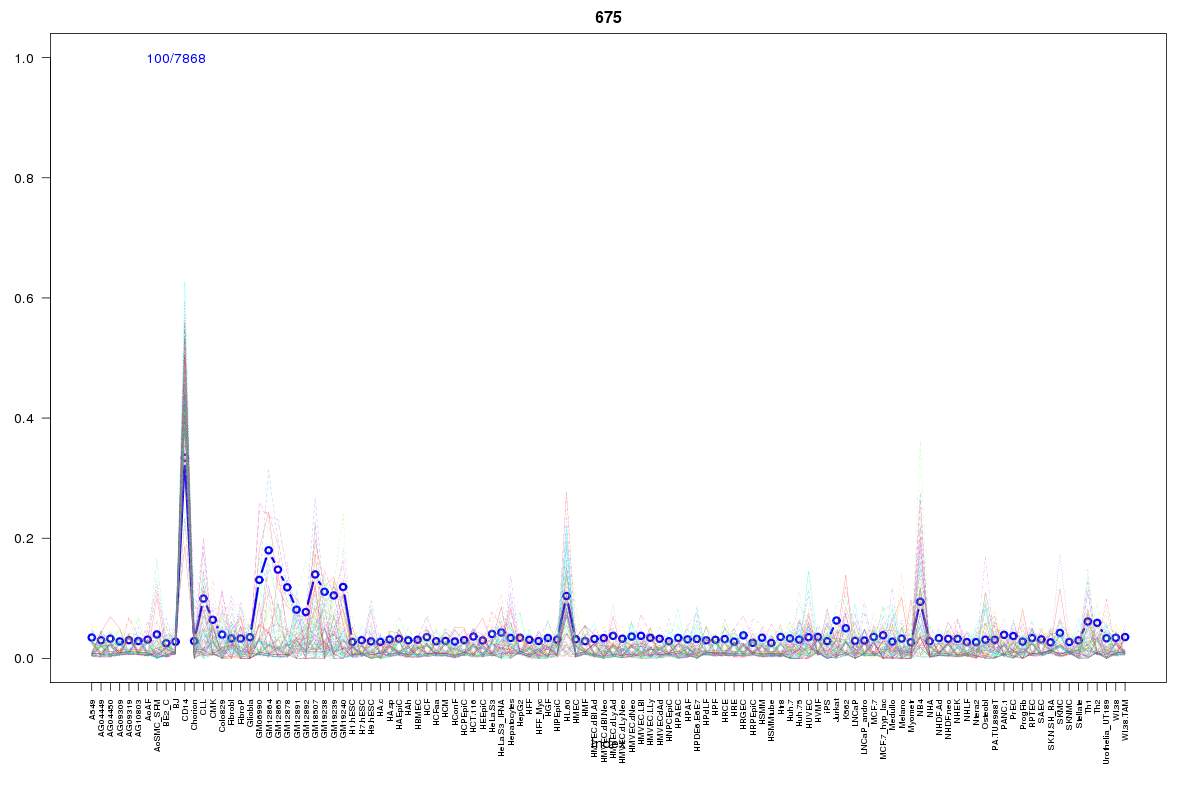 | 675 | 1 |
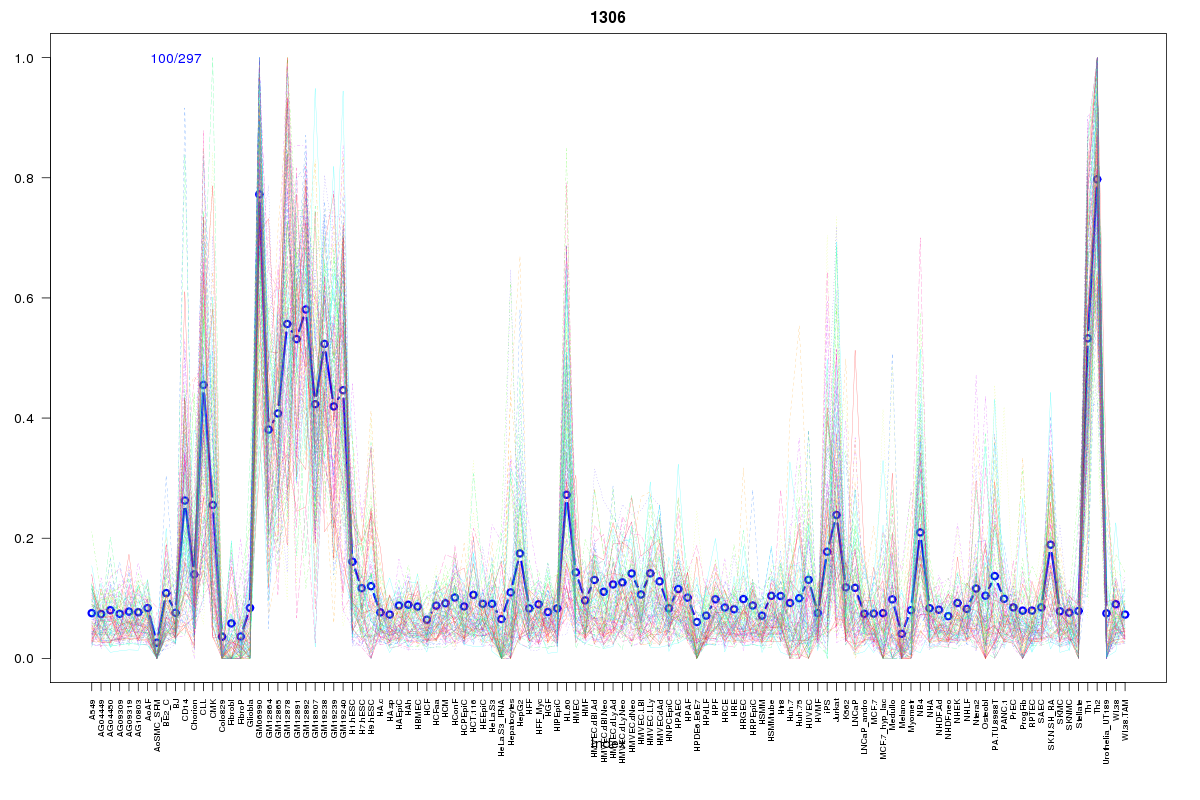 | 1306 | 1 |
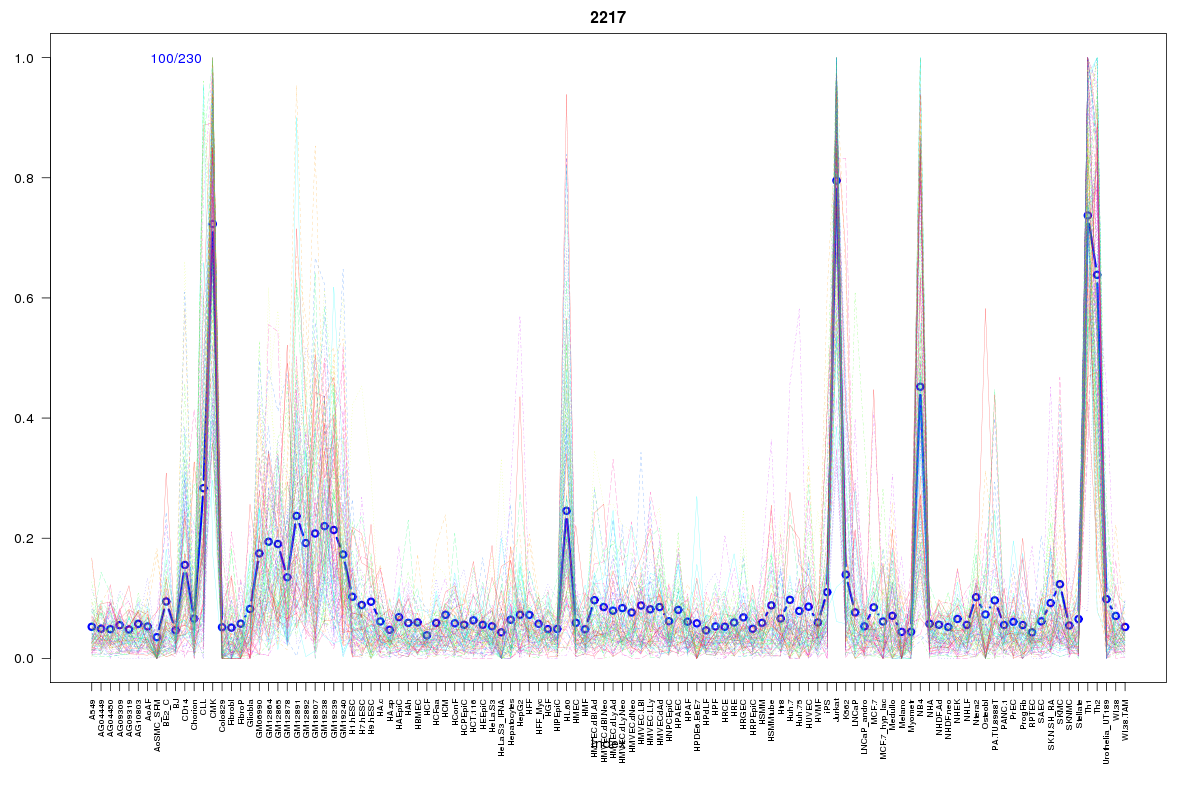 | 2217 | 1 |
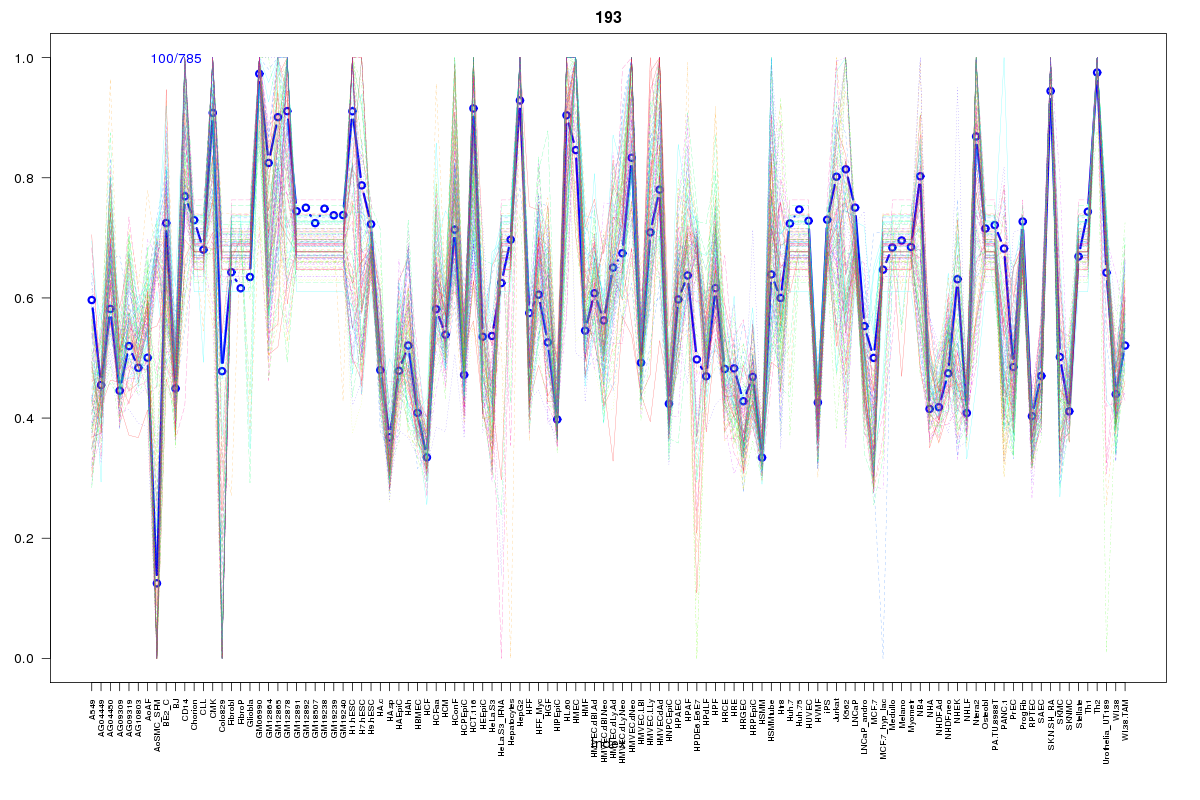 | 193 | 1 |
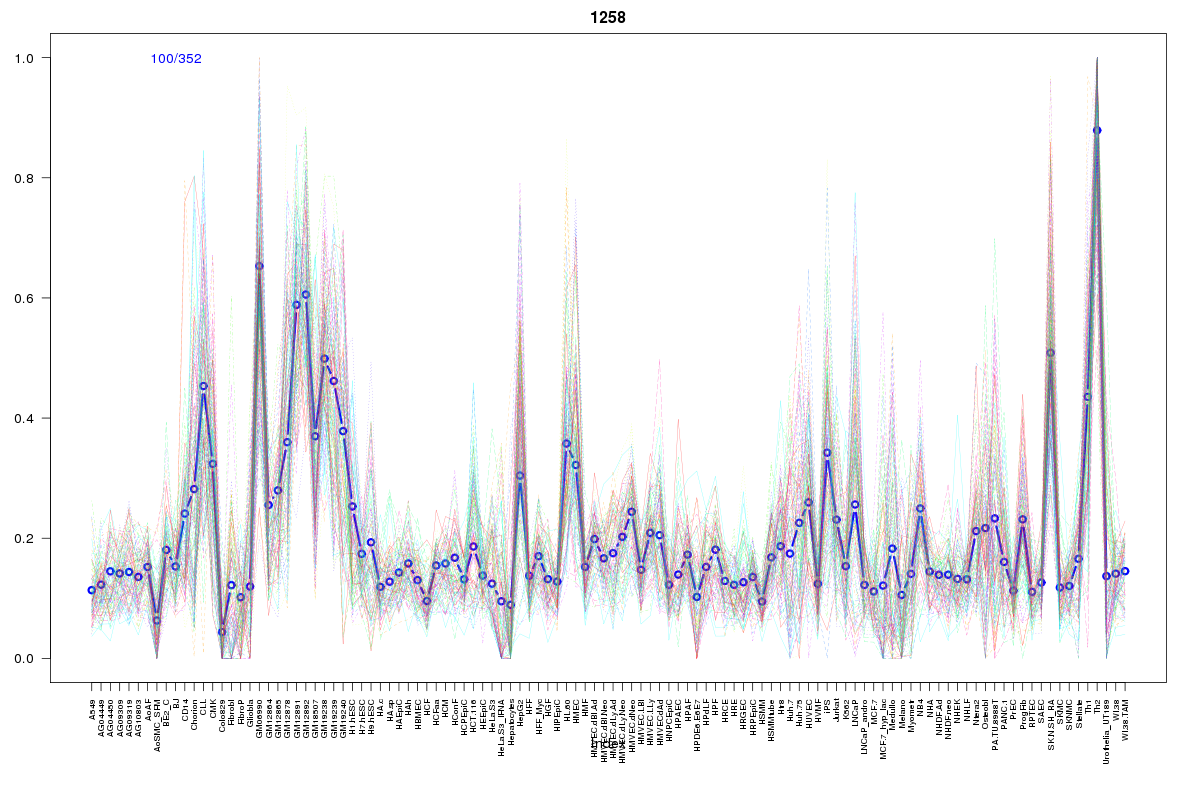 | 1258 | 1 |
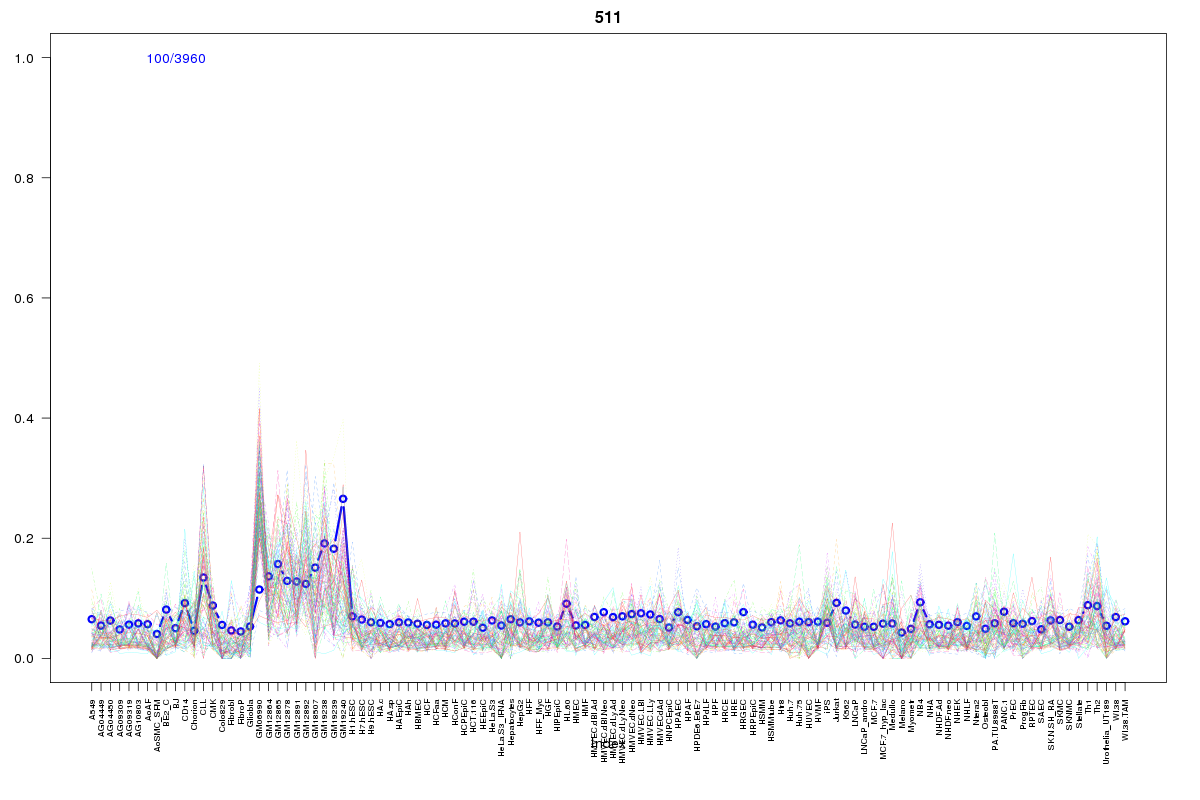 | 511 | 1 |
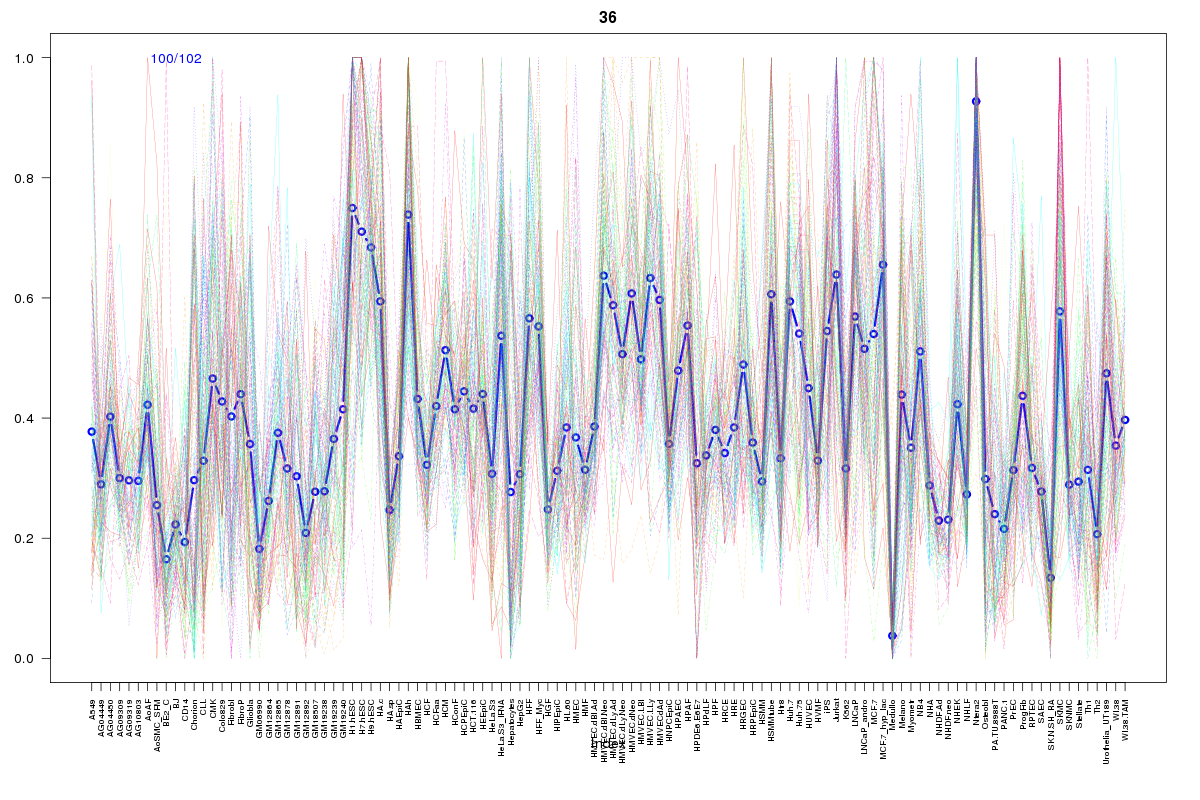 | 36 | 1 |
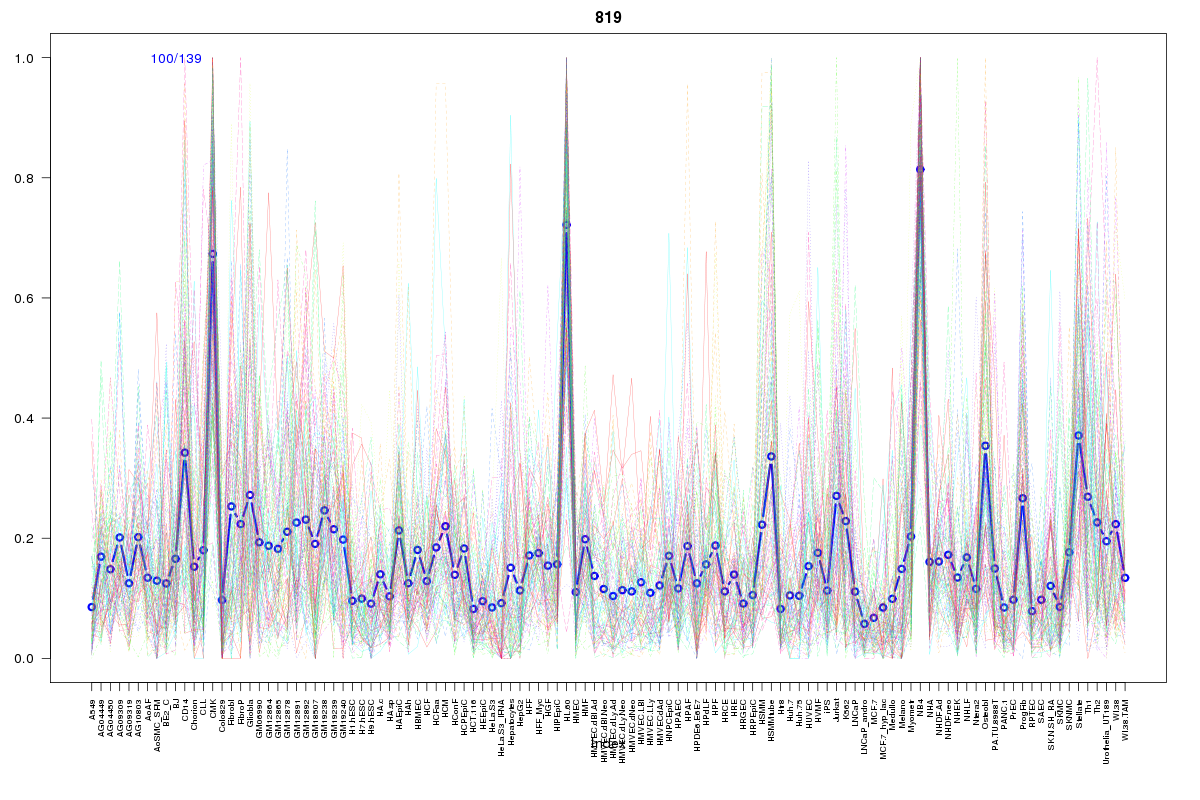 | 819 | 1 |
 | 608 | 1 |
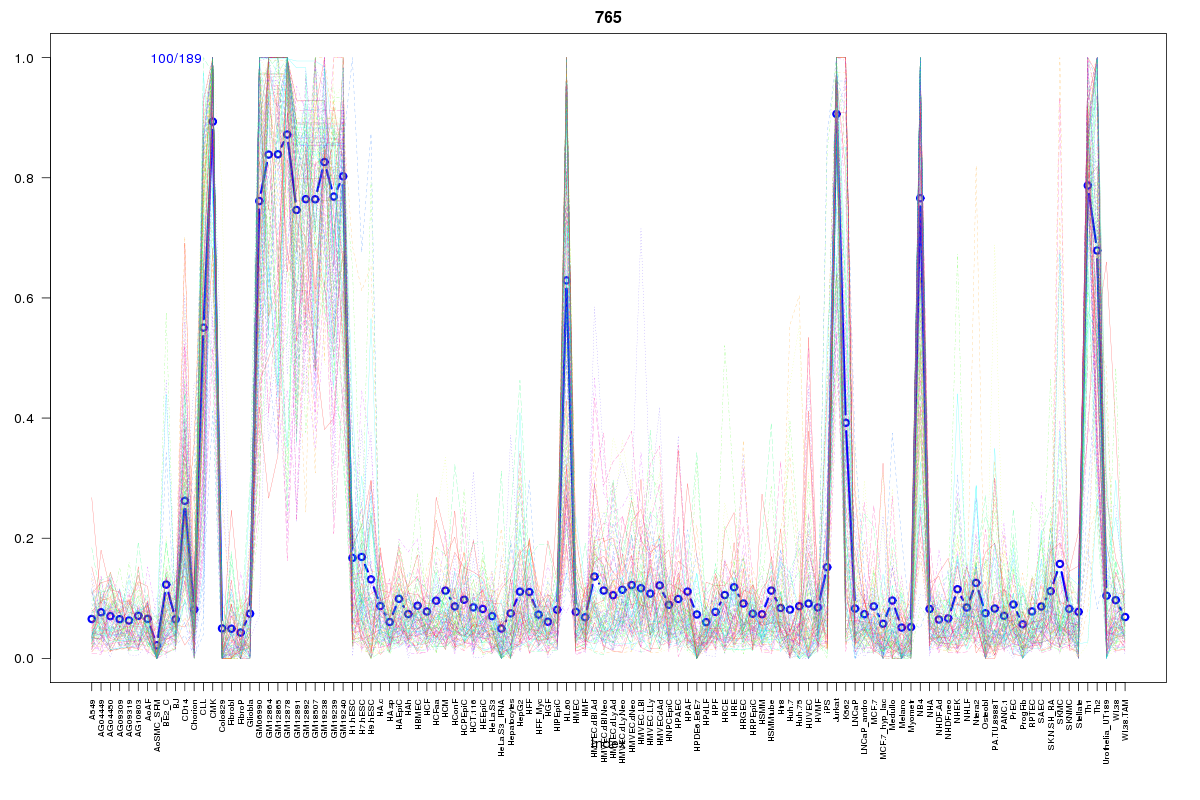 | 765 | 1 |
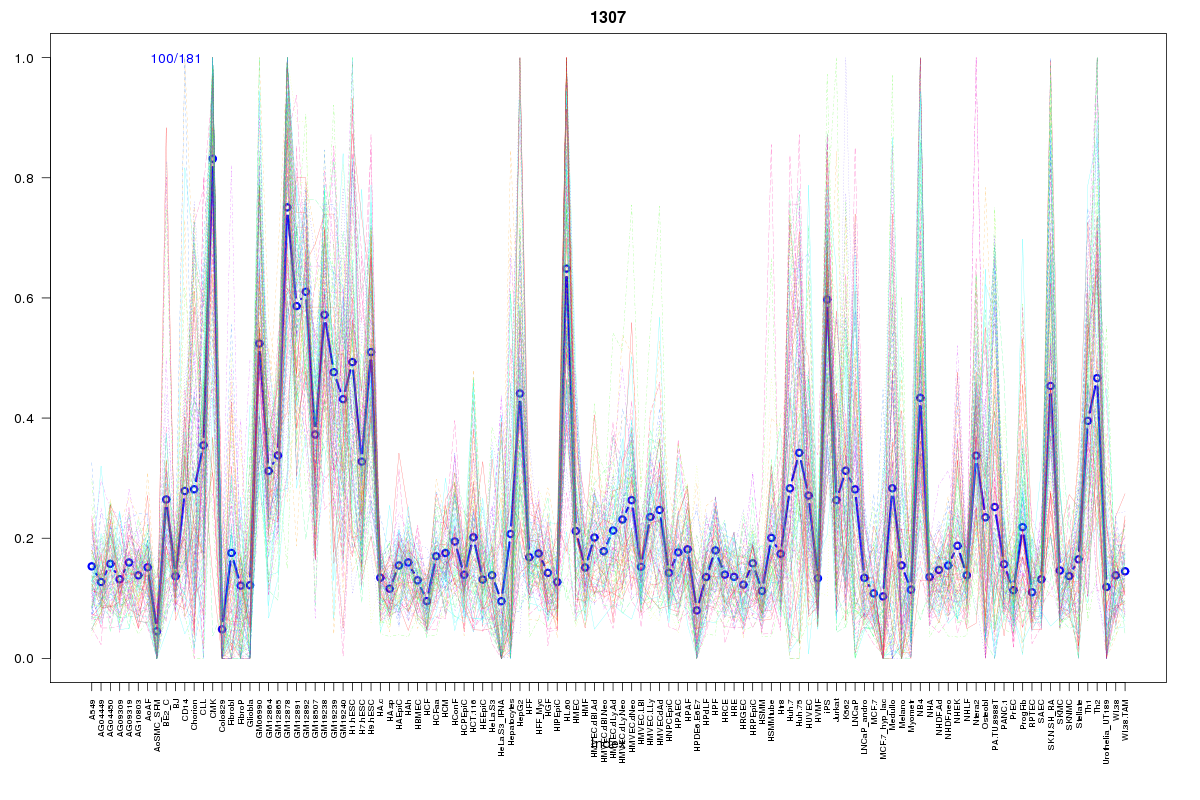 | 1307 | 1 |
 | 881 | 1 |
 | 2072 | 1 |
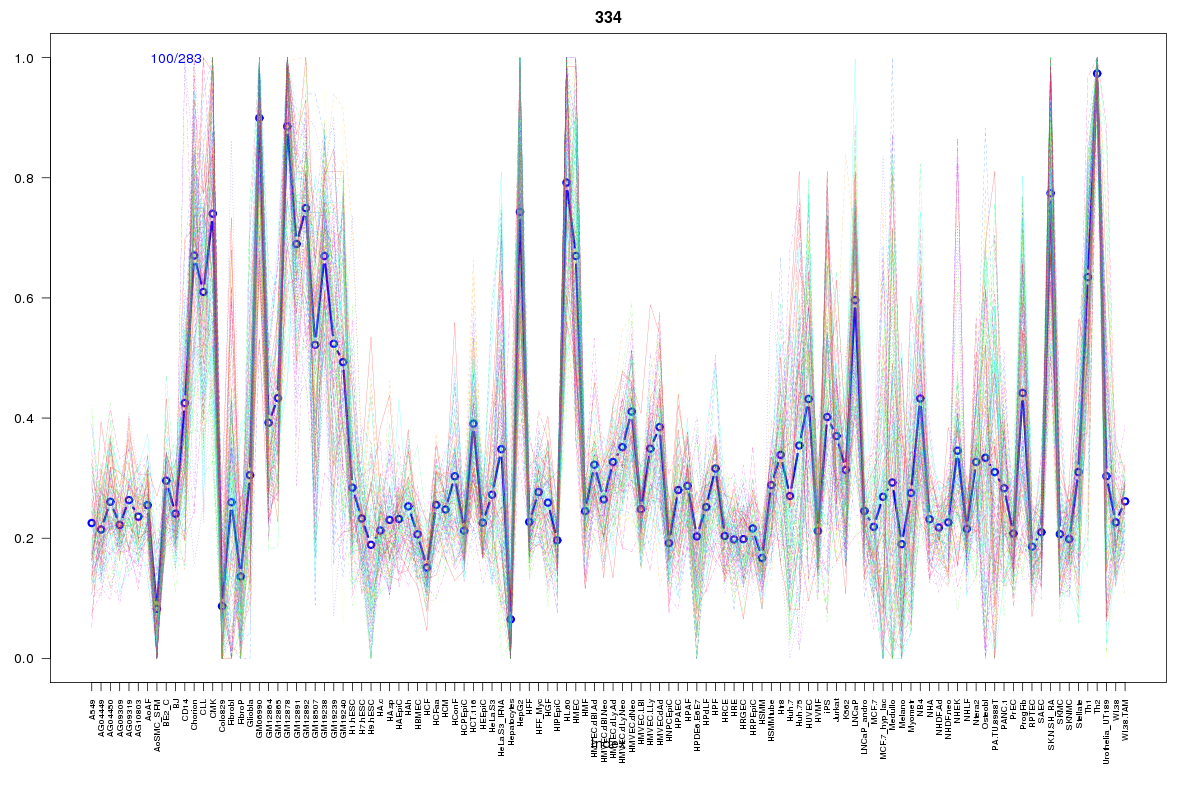 | 334 | 1 |
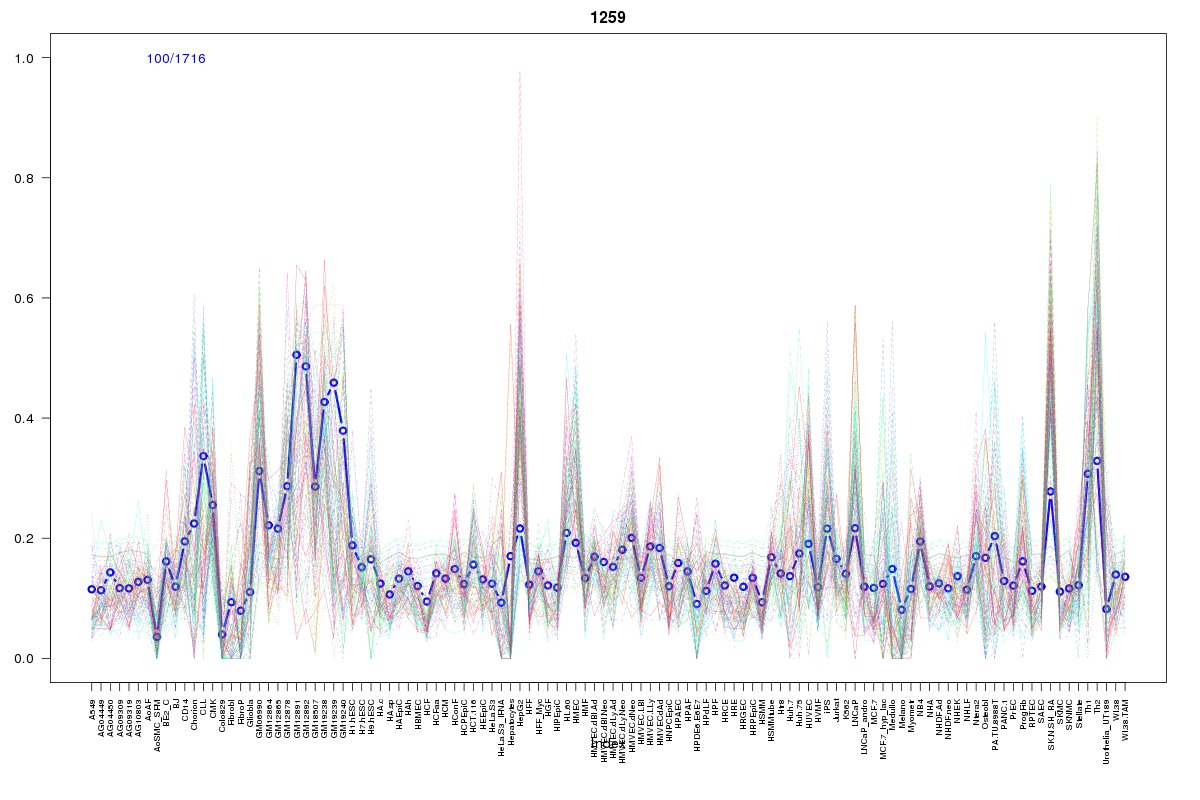 | 1259 | 1 |
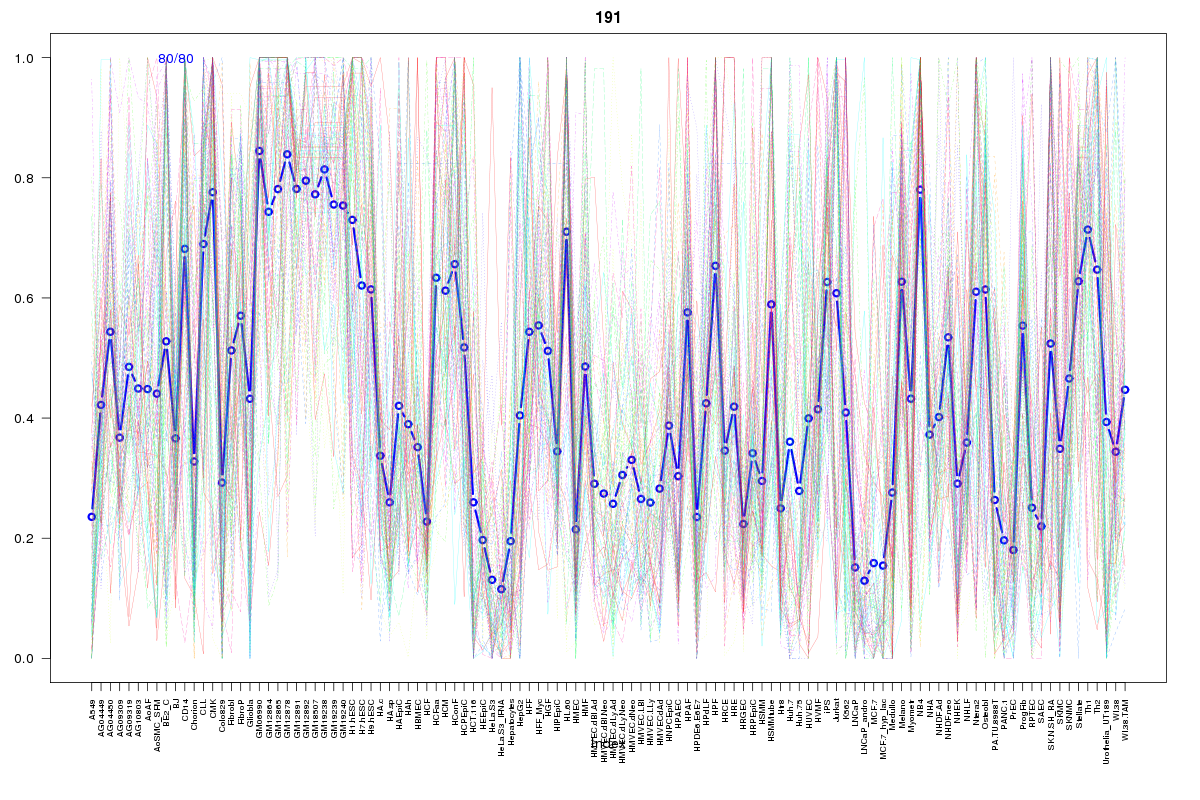 | 191 | 1 |
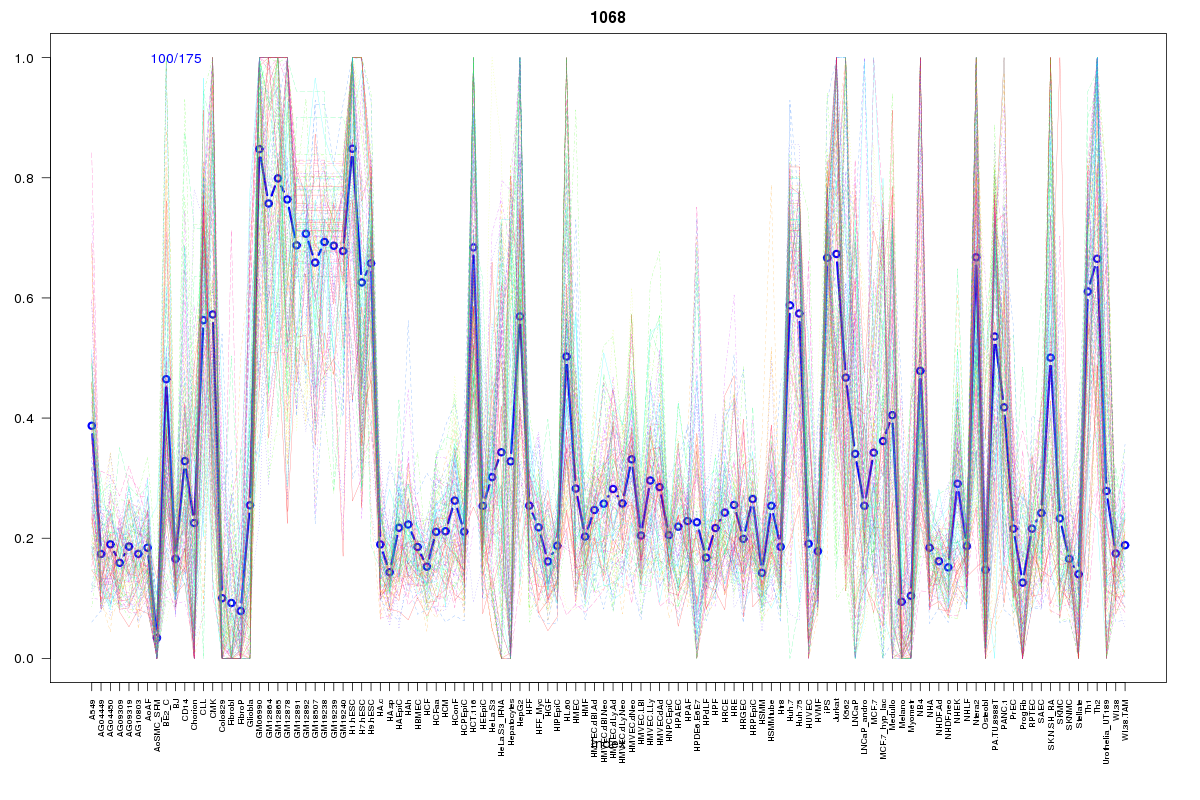 | 1068 | 1 |
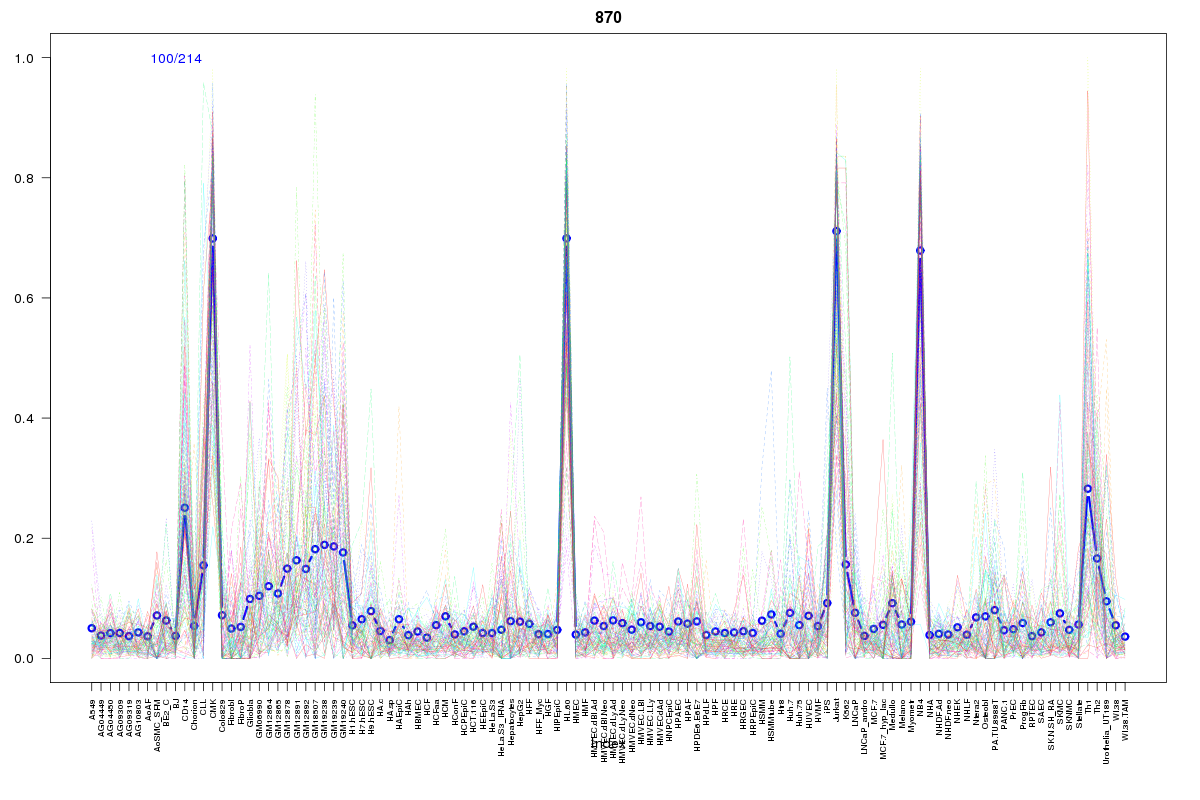 | 870 | 1 |
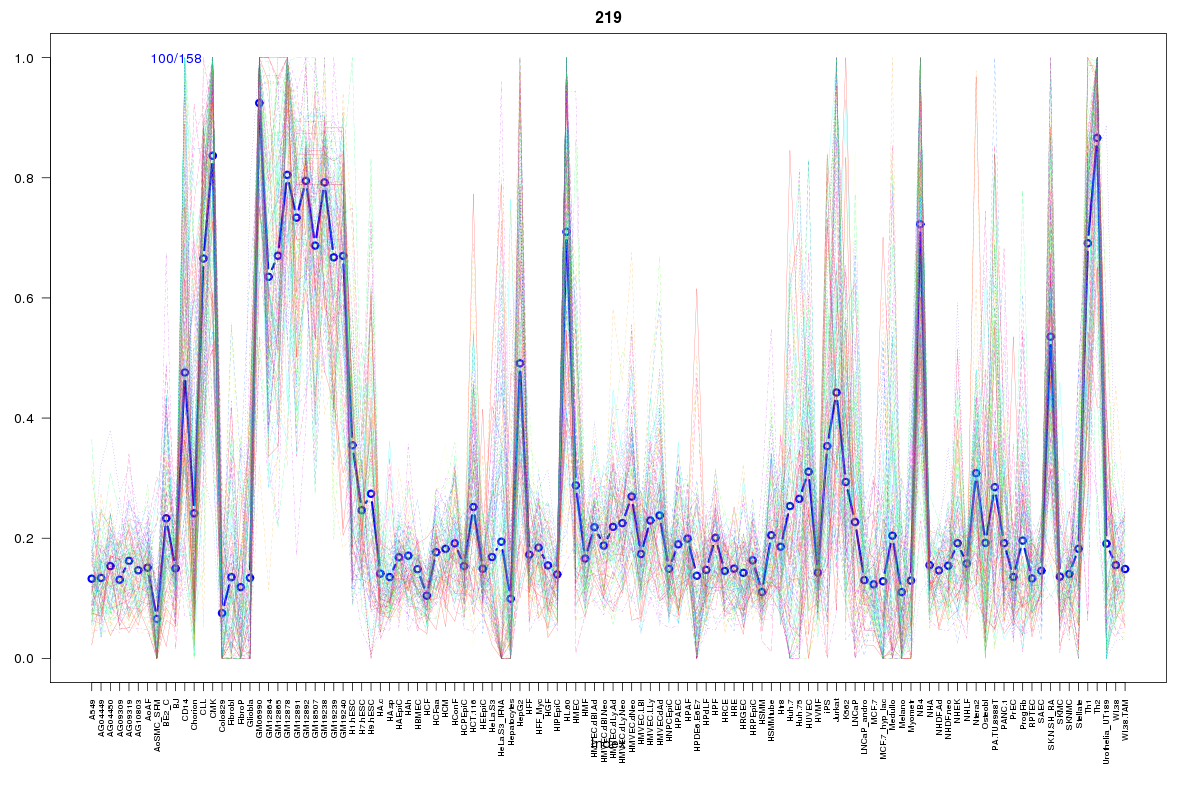 | 219 | 1 |
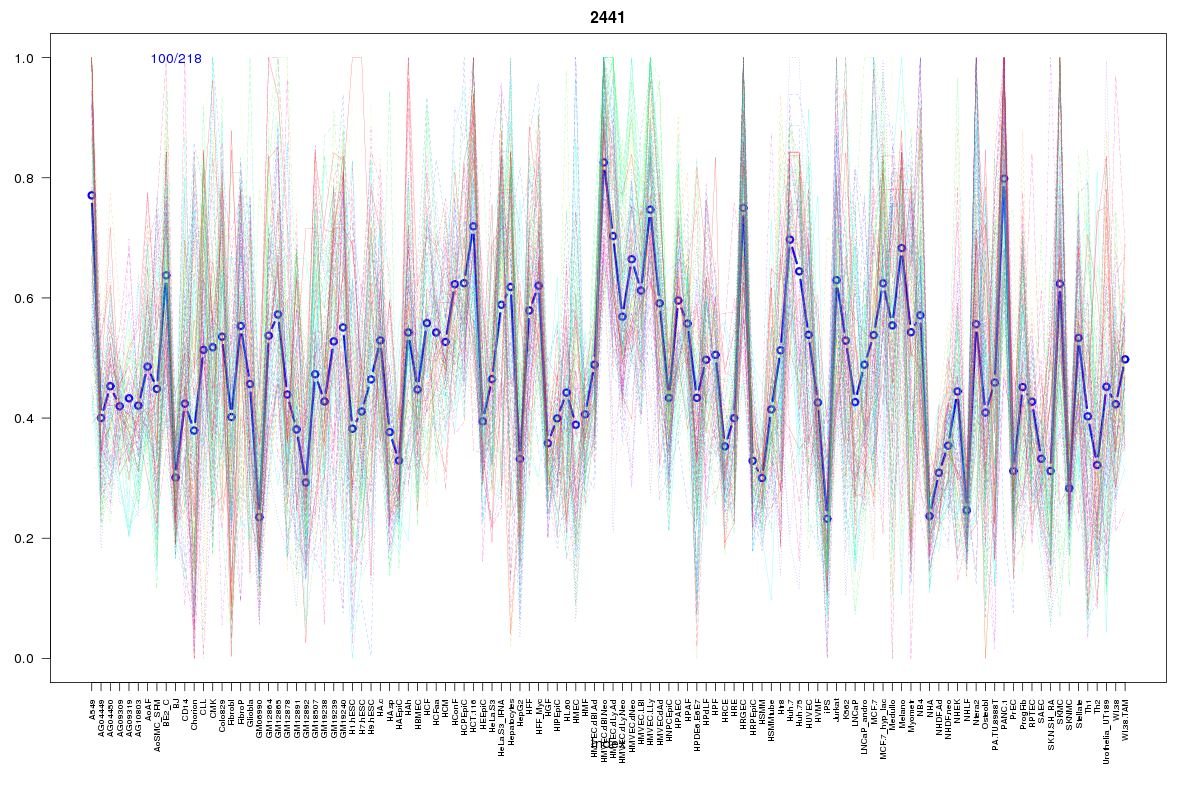 | 2441 | 1 |
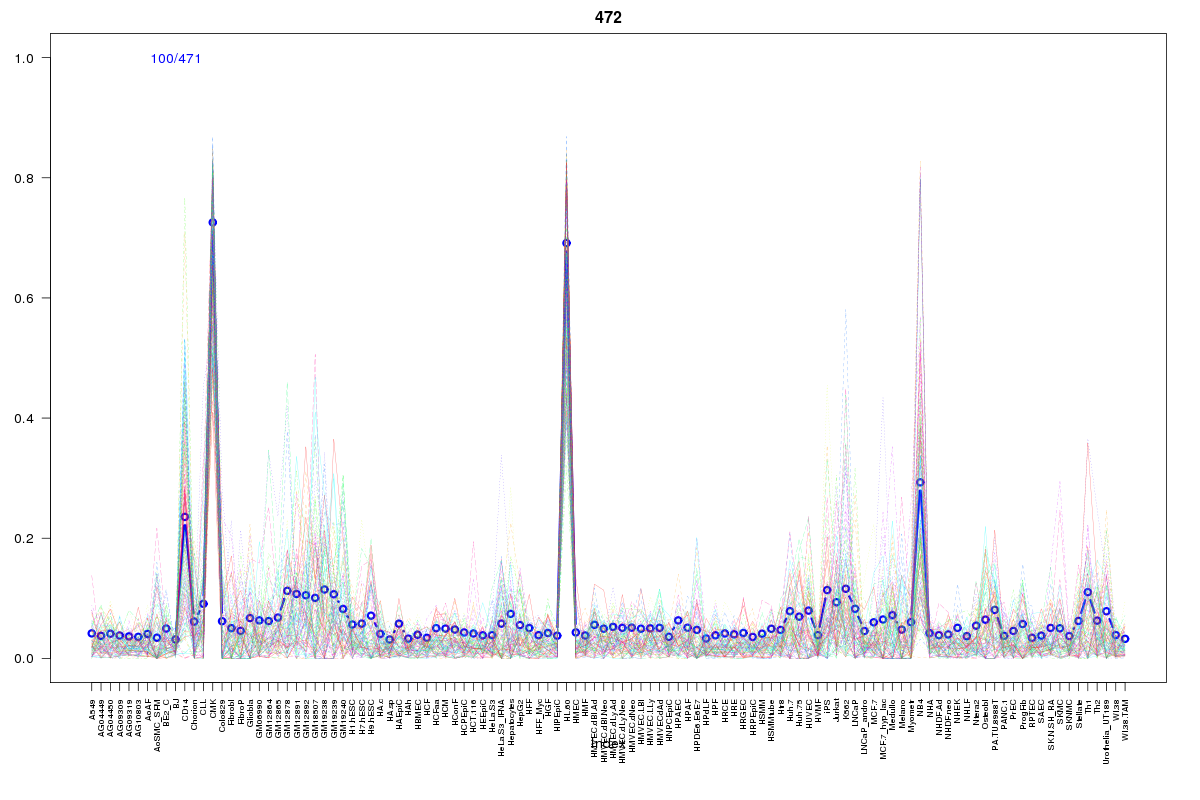 | 472 | 1 |
 | 2393 | 1 |
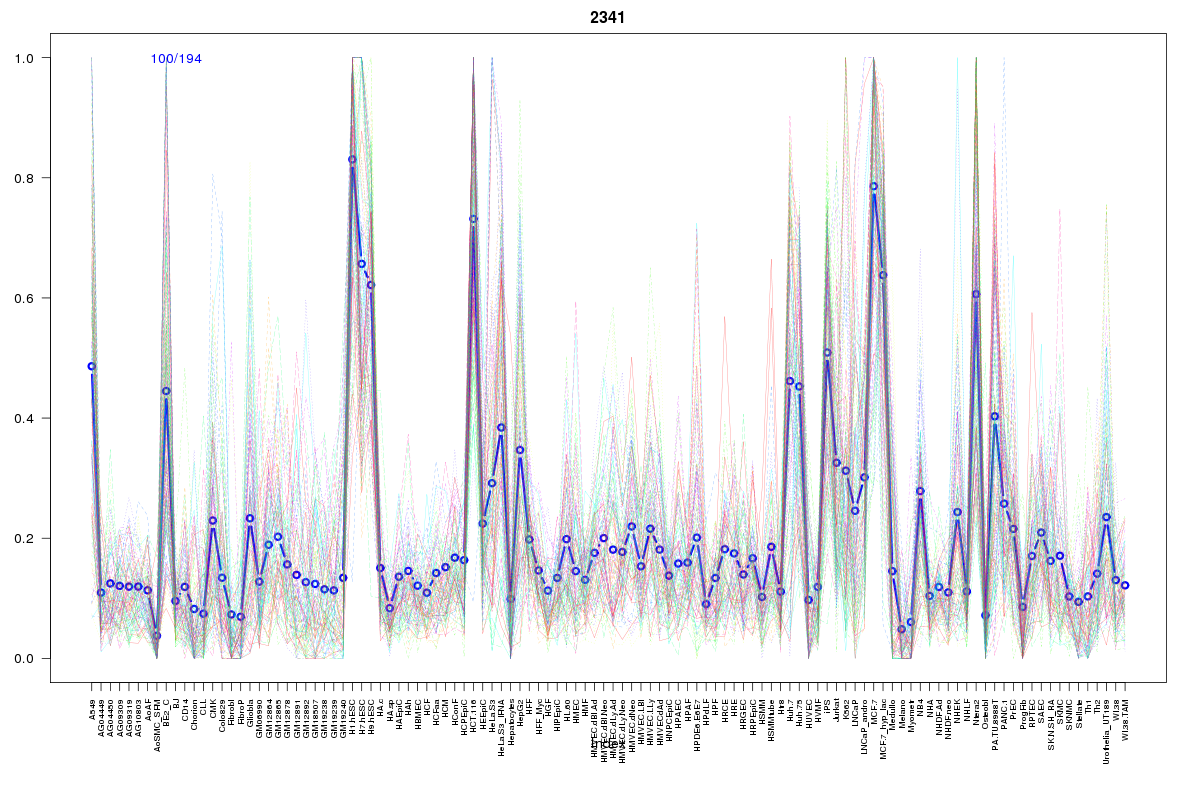 | 2341 | 1 |
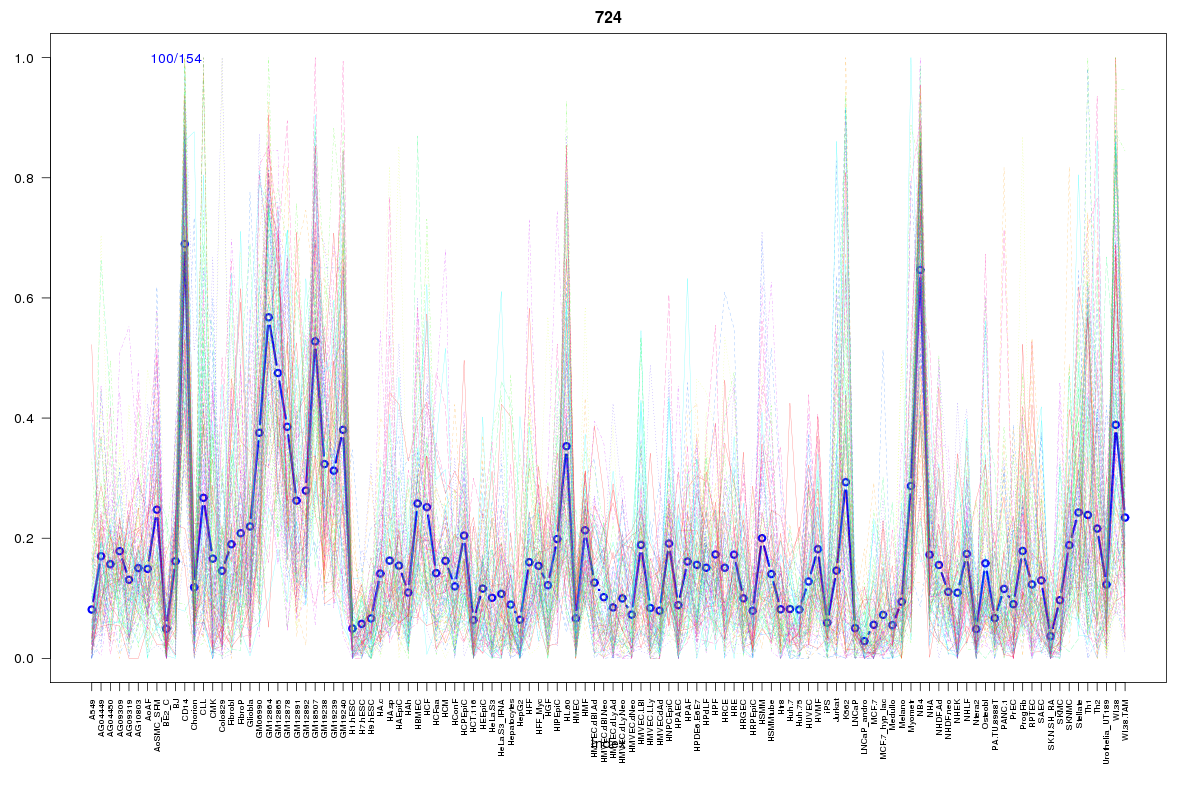 | 724 | 1 |
Resources
BED file downloads
Connects to 40 DHS sitesTop 10 Correlated DHS Sites
p-values indiciate significant higher or lower correlation| Location | Cluster | P-value |
|---|---|---|
| chr19:36400185-36400335 | 76 | 0 |
| chr19:36394785-36394935 | 219 | 0 |
| chr19:36393280-36393430 | 765 | 0 |
| chr19:36400360-36400510 | 76 | 0.001 |
| chr19:36394620-36394770 | 191 | 0.003 |
| chr19:36420880-36421030 | 577 | 0.003 |
| chr19:36450100-36450250 | 1258 | 0.003 |
| chr19:36393440-36393590 | 670 | 0.004 |
| chr19:36390885-36391035 | 1306 | 0.004 |
| chr19:36394200-36394350 | 2062 | 0.004 |
| chr19:36389765-36389915 | 1604 | 0.005 |
External Databases
UCSCEnsembl (ENSG00000126264)