Gene: TMEM35
chrX: 100333708-100351353Expression Profile
(log scale)
Graphical Connections
Distribution of linked clusters:
You may find it interesting if many of the connected DHS sites belong to the same cluster.| Cluster Profile | Cluster ID | Number of DHS sites in this cluster |
|---|---|---|
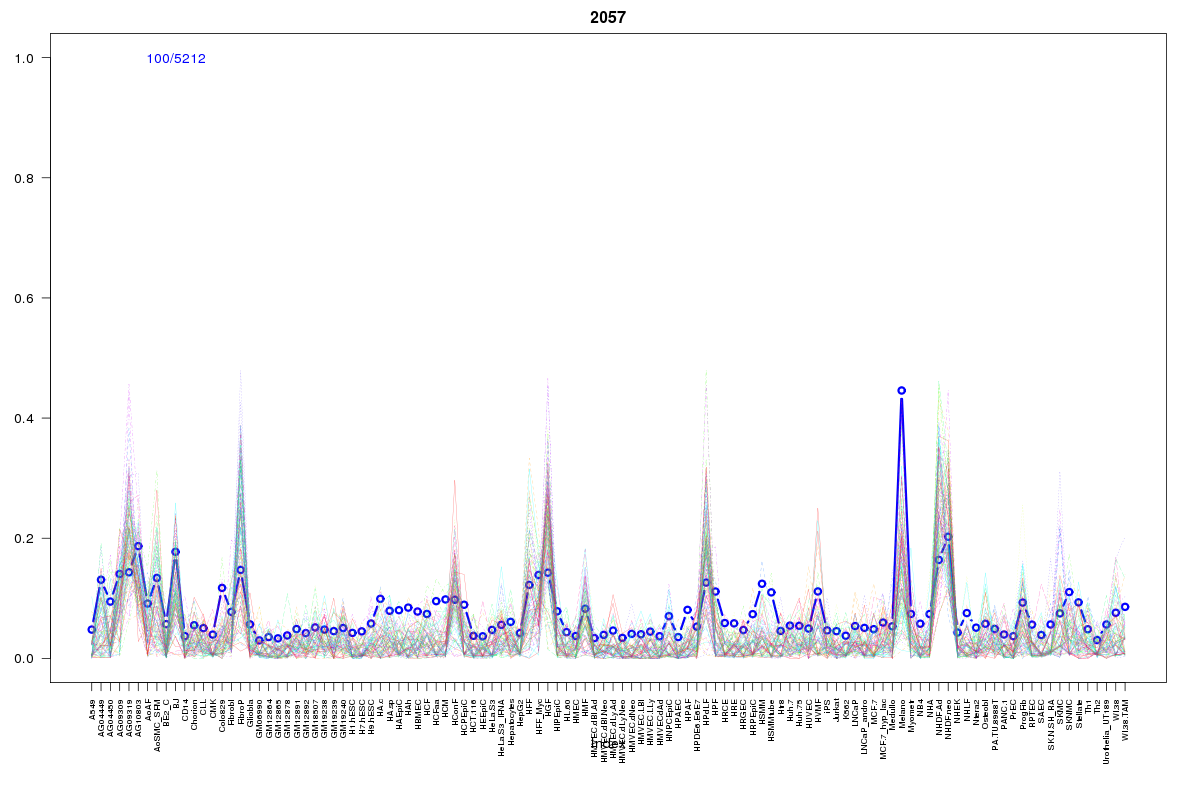 | 2057 | 2 |
 | 1269 | 2 |
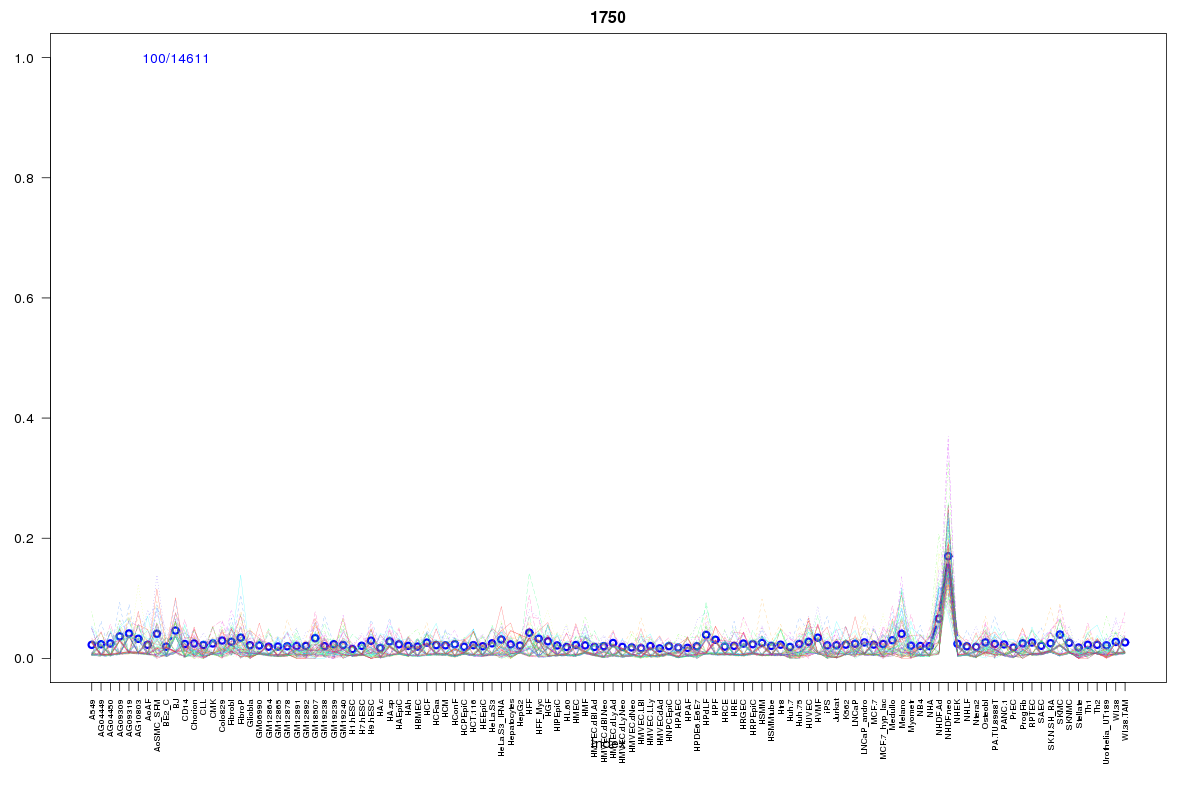 | 1750 | 2 |
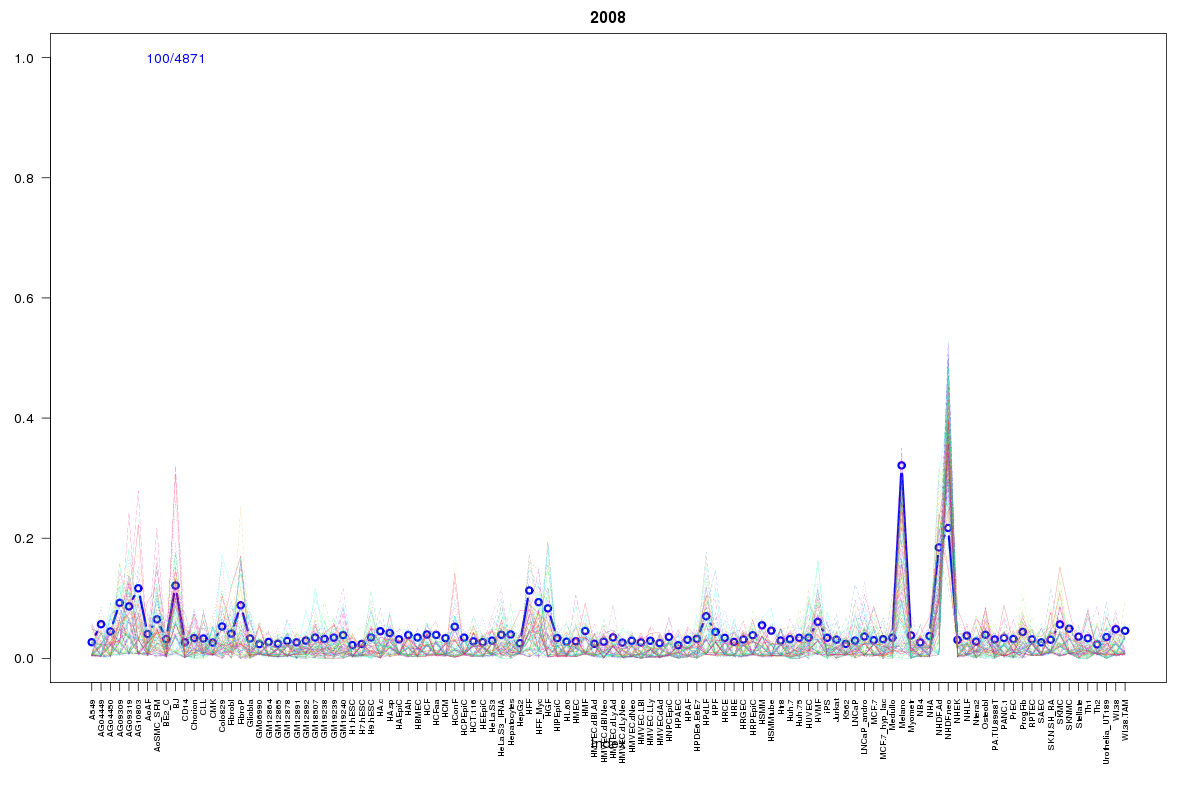 | 2008 | 1 |
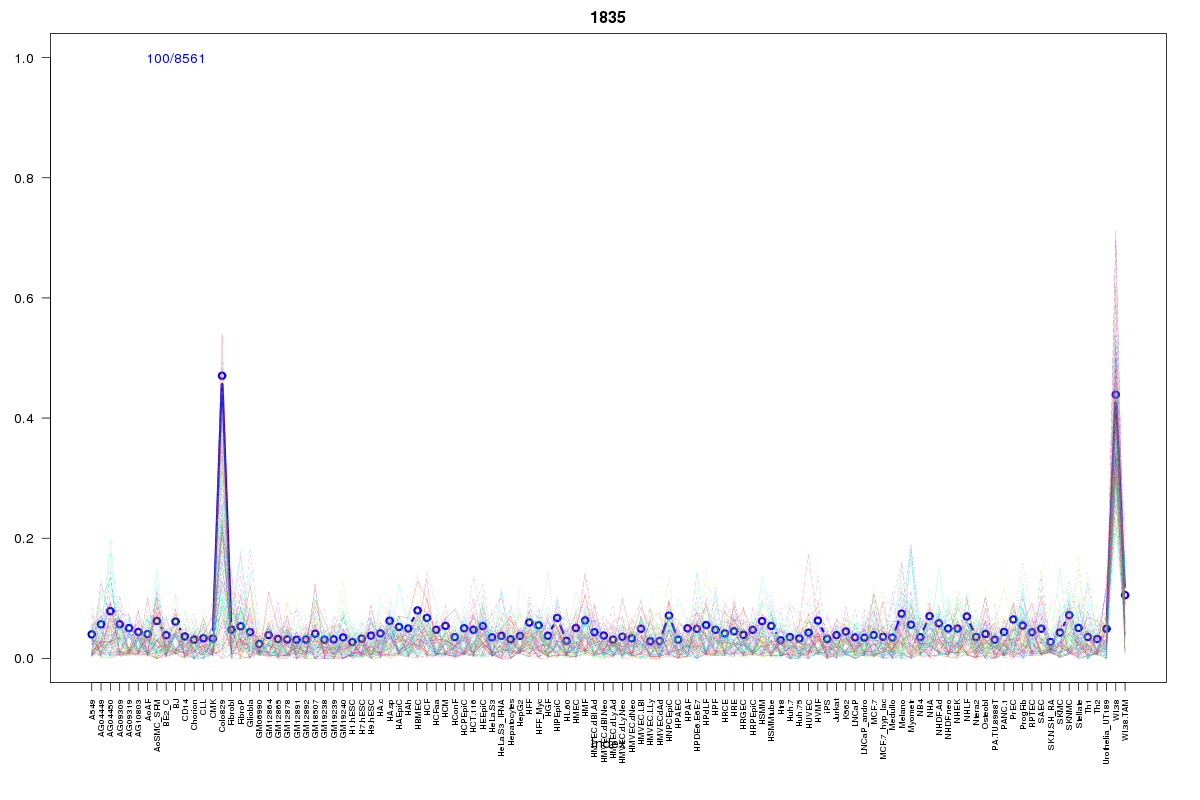 | 1835 | 1 |
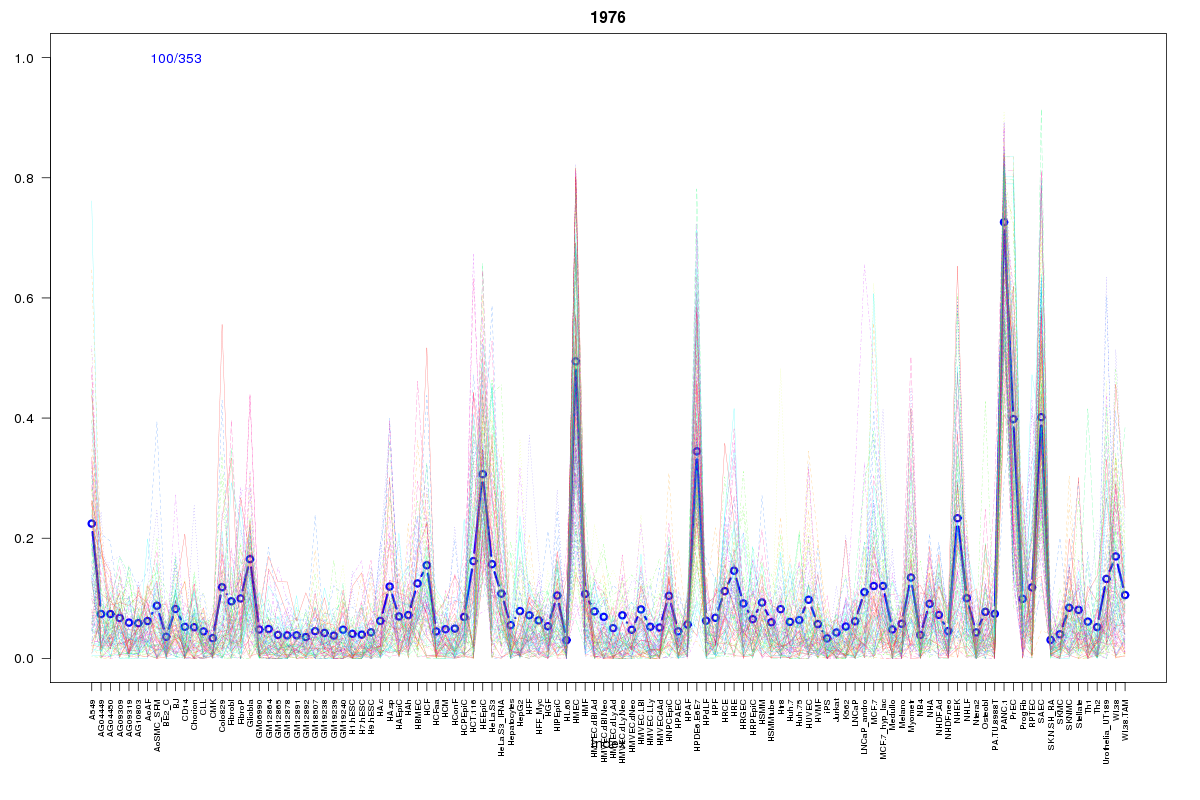 | 1976 | 1 |
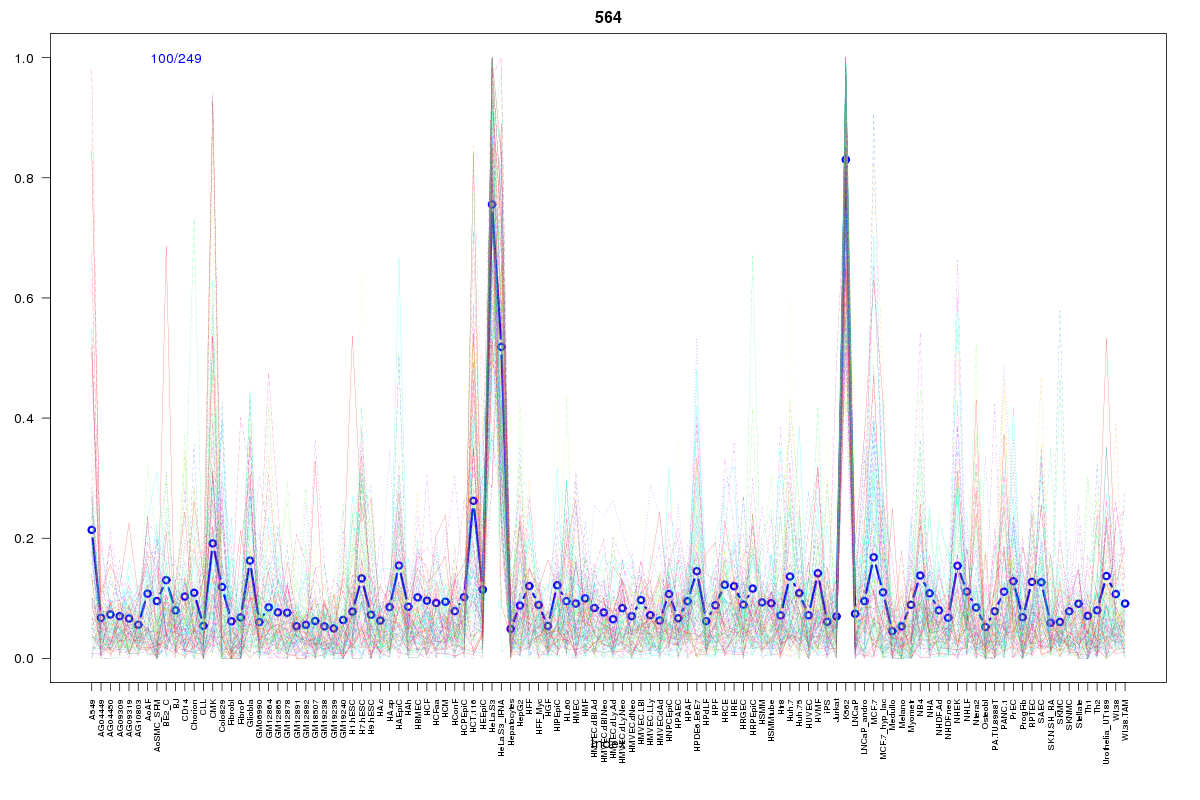 | 564 | 1 |
 | 1095 | 1 |
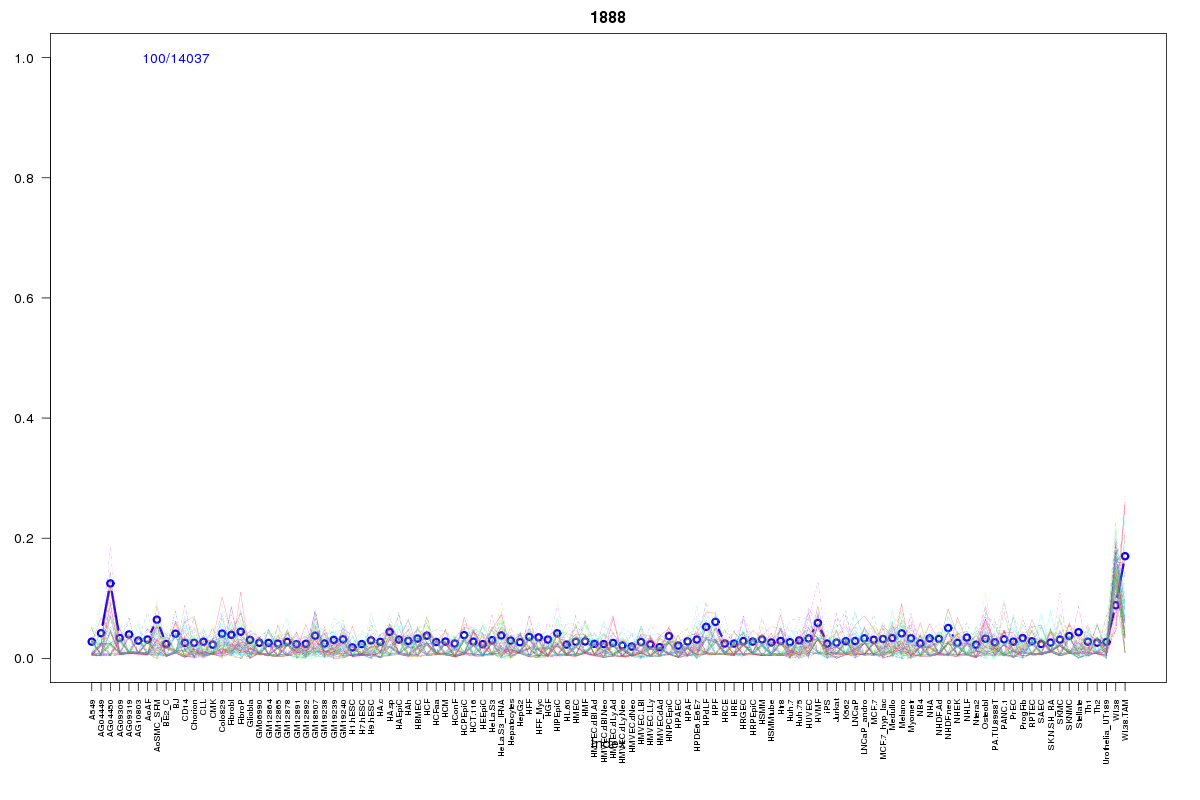 | 1888 | 1 |
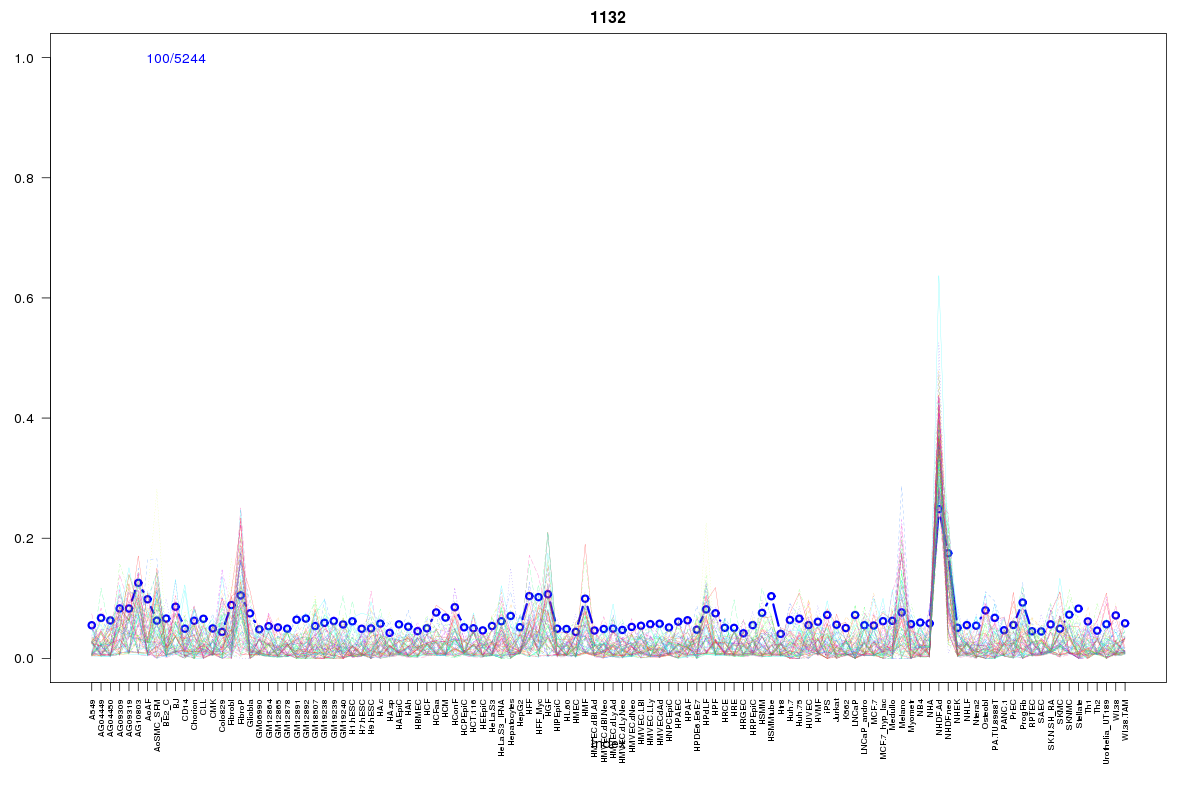 | 1132 | 1 |
 | 282 | 1 |
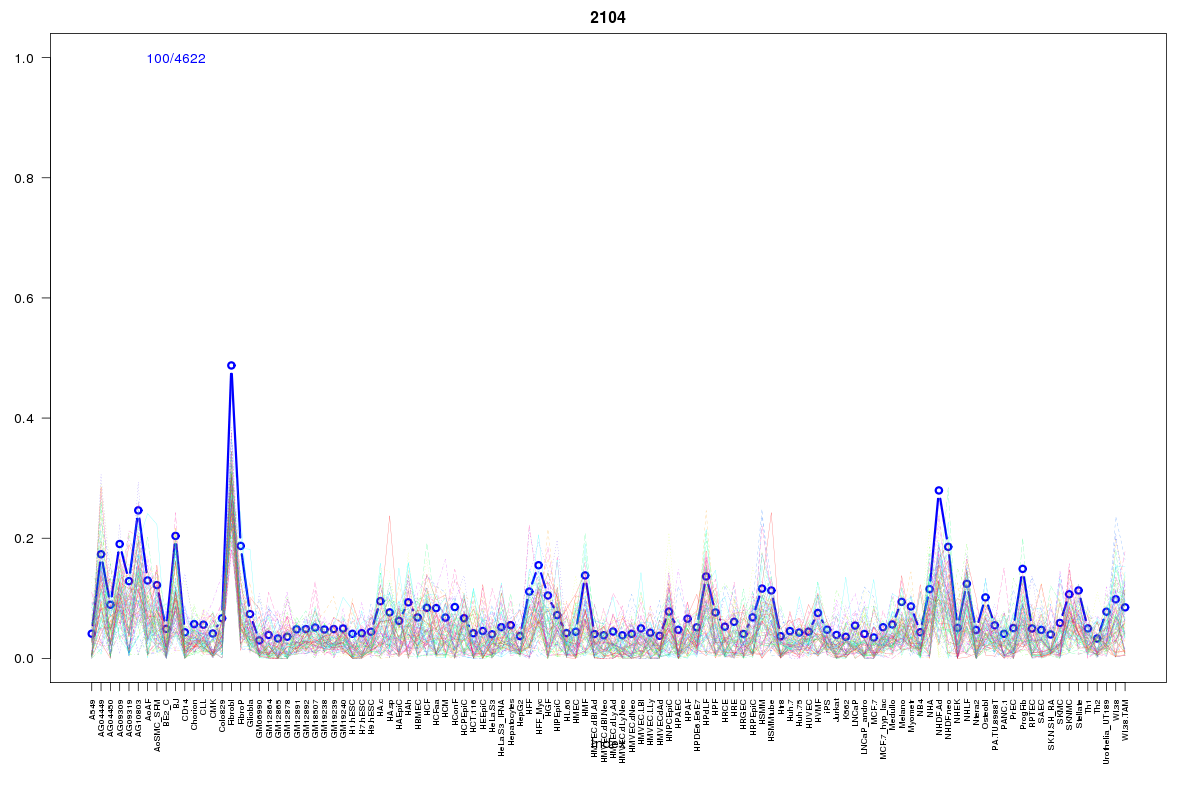 | 2104 | 1 |
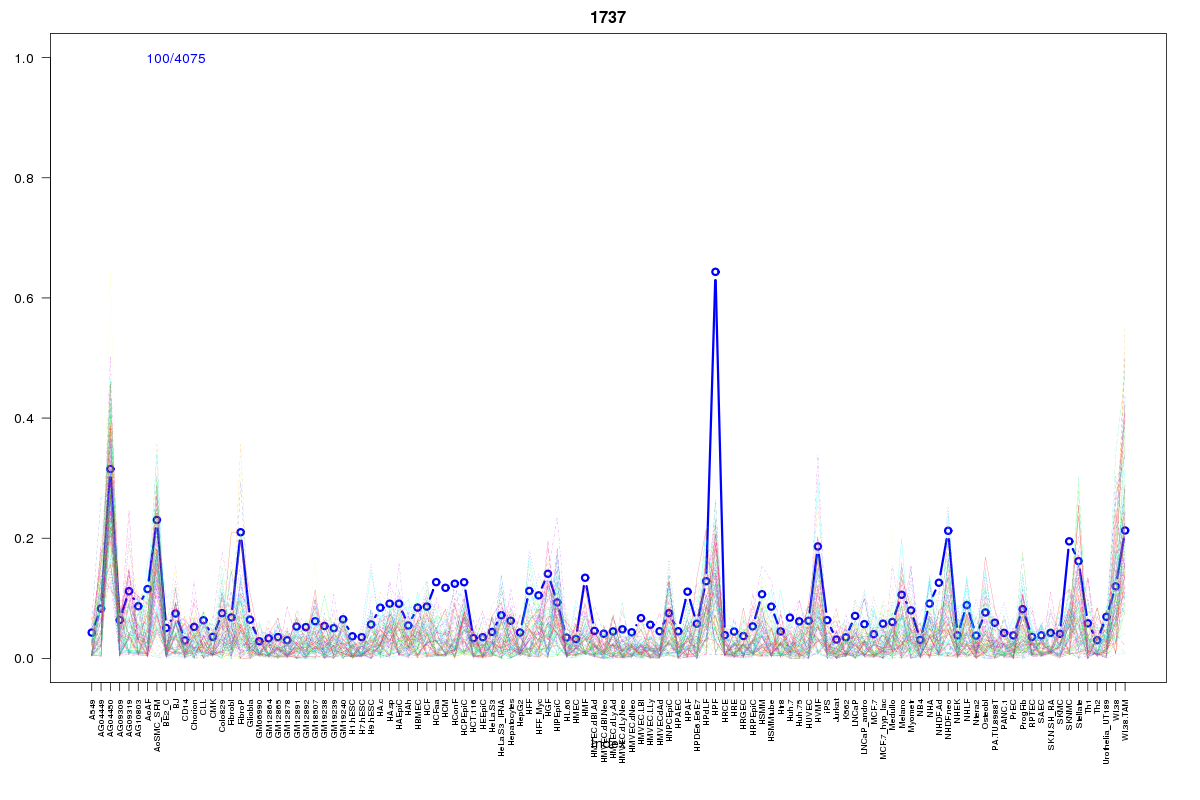 | 1737 | 1 |
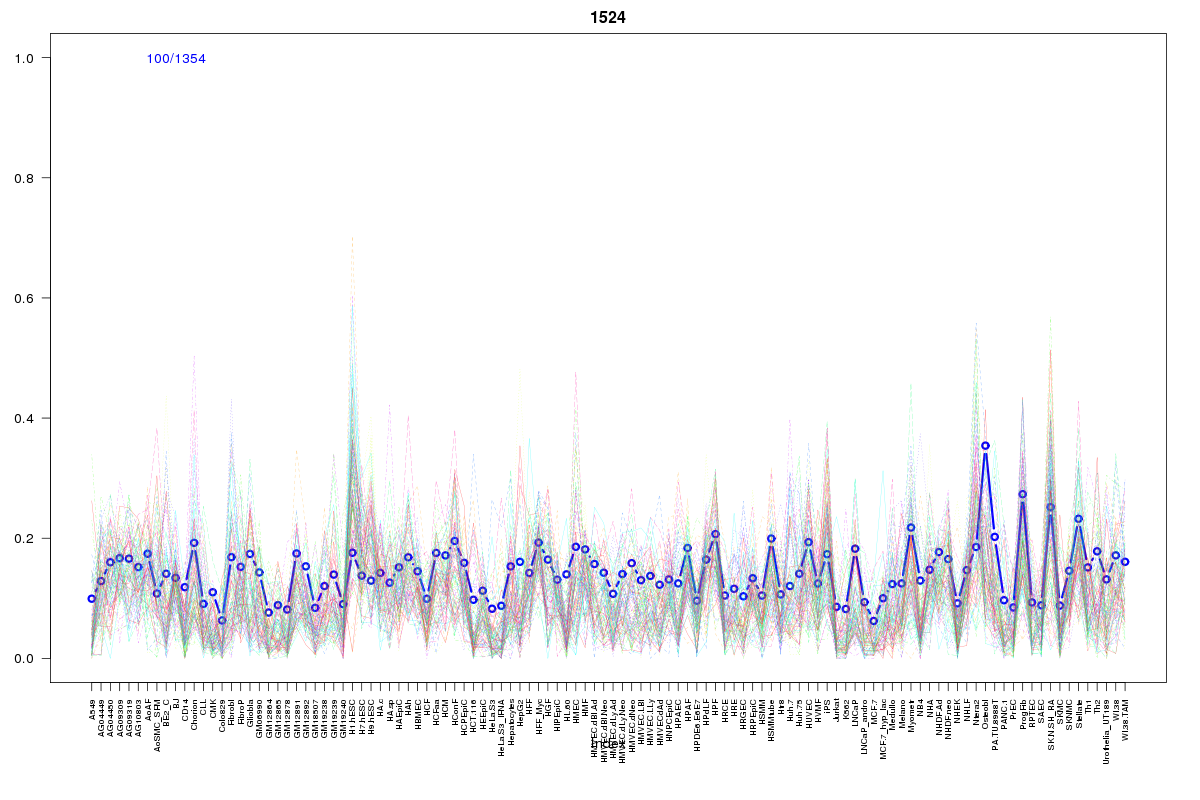 | 1524 | 1 |
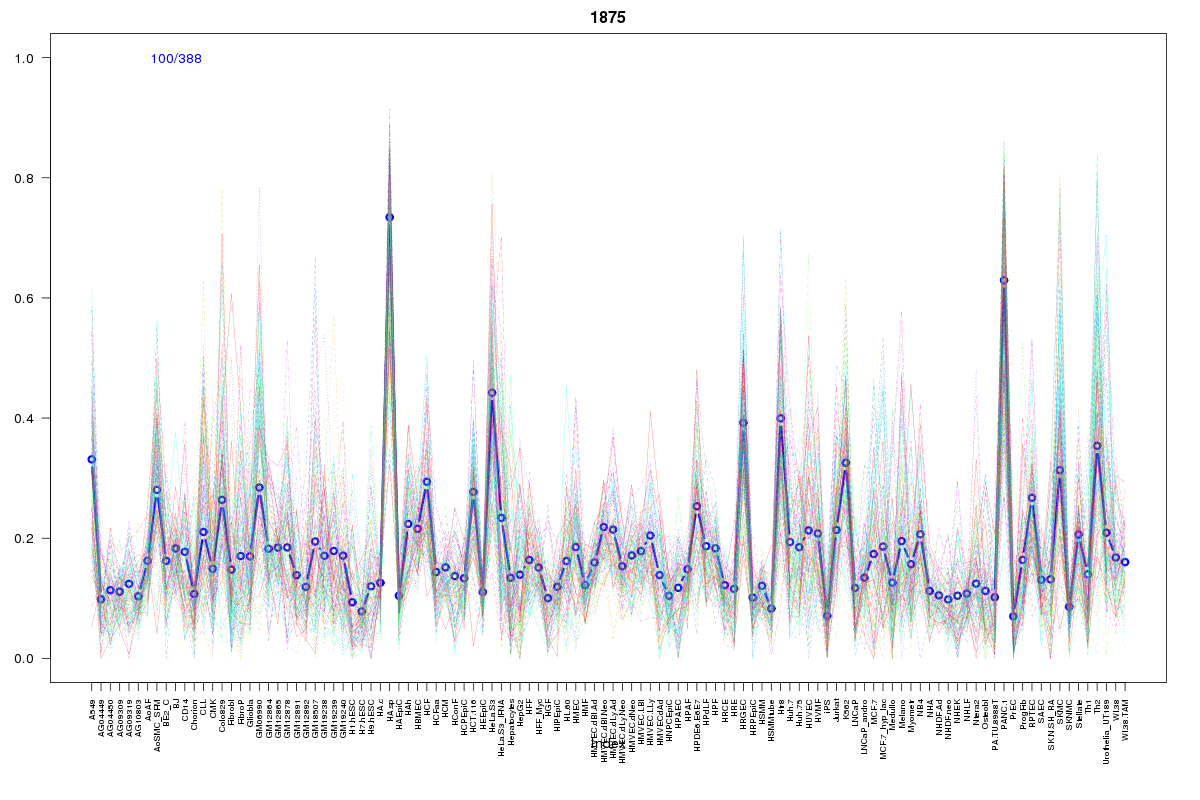 | 1875 | 1 |
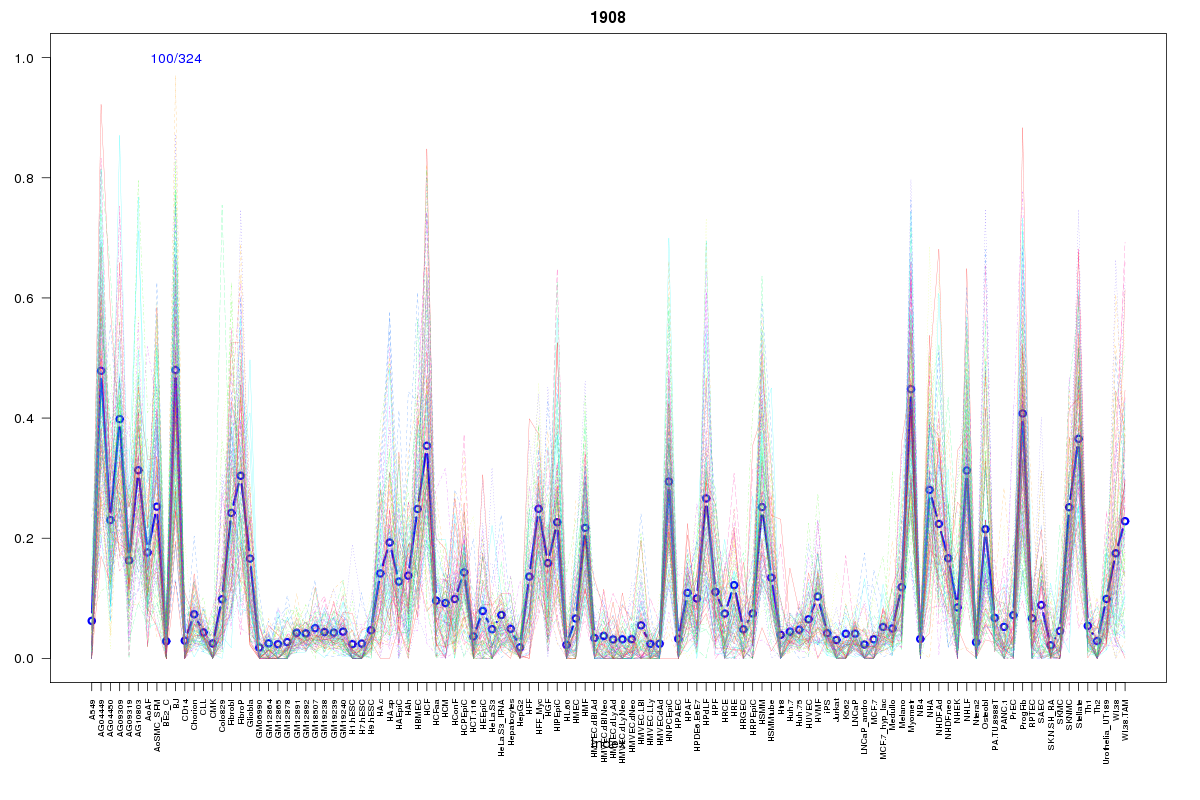 | 1908 | 1 |
Resources
BED file downloads
Connects to 19 DHS sitesTop 10 Correlated DHS Sites
p-values indiciate significant higher or lower correlation| Location | Cluster | P-value |
|---|---|---|
| chrX:100333740-100333890 | 1524 | 0.002 |
| chrX:100321700-100321850 | 1737 | 0.002 |
| chrX:100363420-100363570 | 1908 | 0.003 |
| chrX:100418260-100418410 | 2008 | 0.004 |
| chrX:100250560-100250710 | 1095 | 0.004 |
| chrX:100295300-100295450 | 2057 | 0.007 |
| chrX:100338060-100338210 | 1750 | 0.013 |
| chrX:100342660-100342810 | 1750 | 0.015 |
| chrX:100296360-100296510 | 1132 | 0.018 |
| chrX:100317340-100317490 | 2104 | 0.02 |
| chrX:100292260-100292410 | 1888 | 0.021 |
External Databases
UCSCEnsembl (ENSG00000126950)