Gene: MTUS1
chr8: 17501303-17533838Expression Profile
(log scale)
Graphical Connections
Distribution of linked clusters:
You may find it interesting if many of the connected DHS sites belong to the same cluster.| Cluster Profile | Cluster ID | Number of DHS sites in this cluster |
|---|---|---|
 | 1659 | 4 |
 | 739 | 3 |
 | 2175 | 3 |
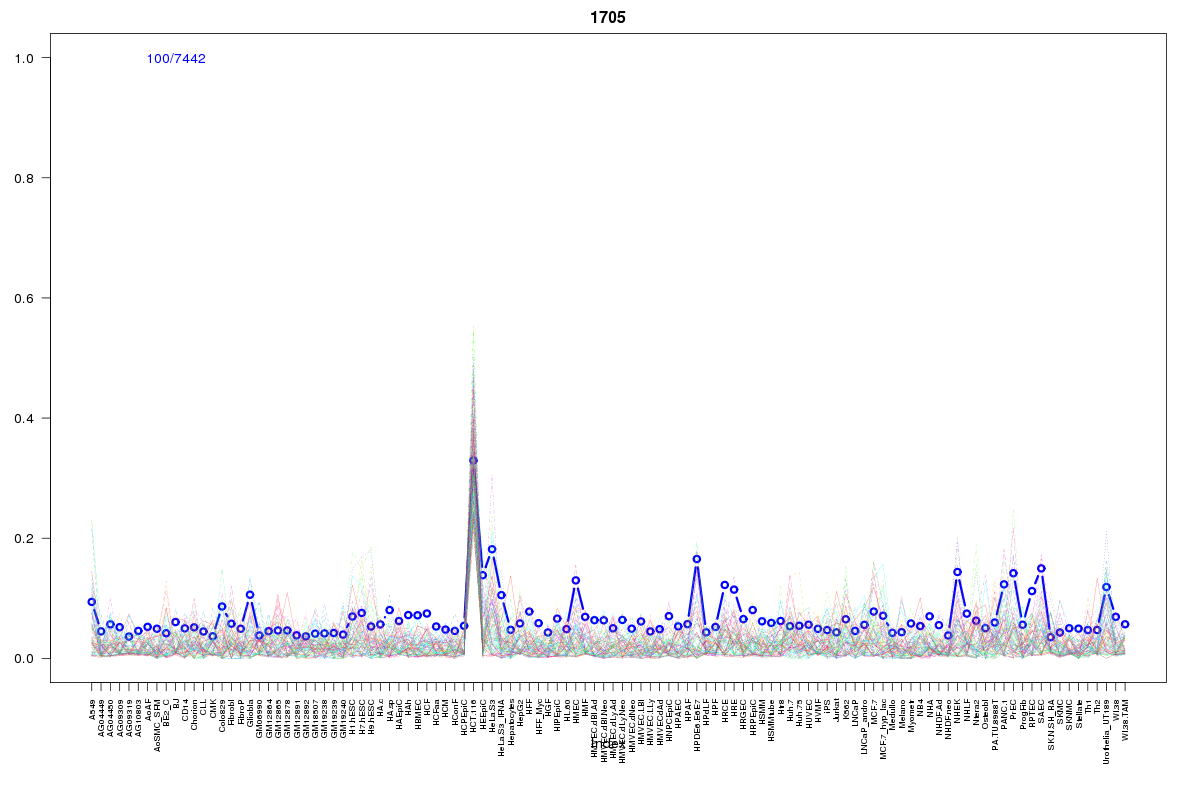 | 1705 | 3 |
 | 687 | 3 |
 | 2322 | 2 |
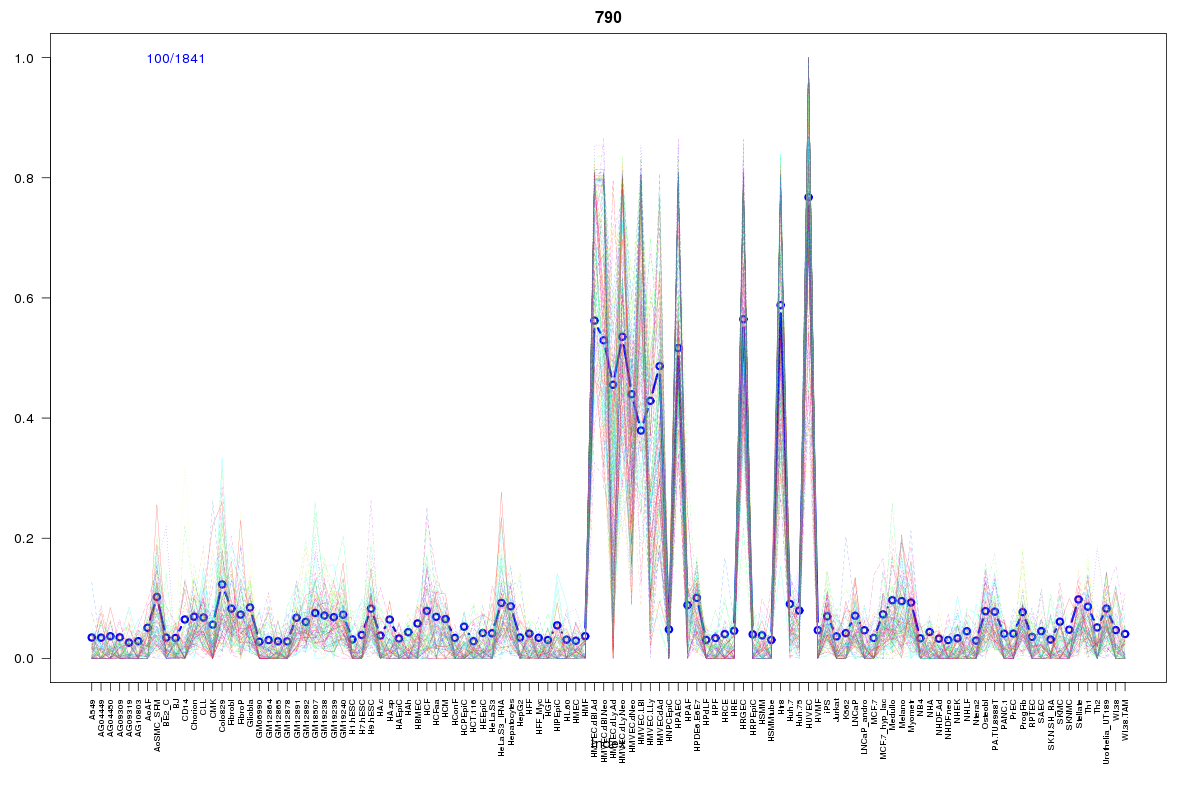 | 790 | 2 |
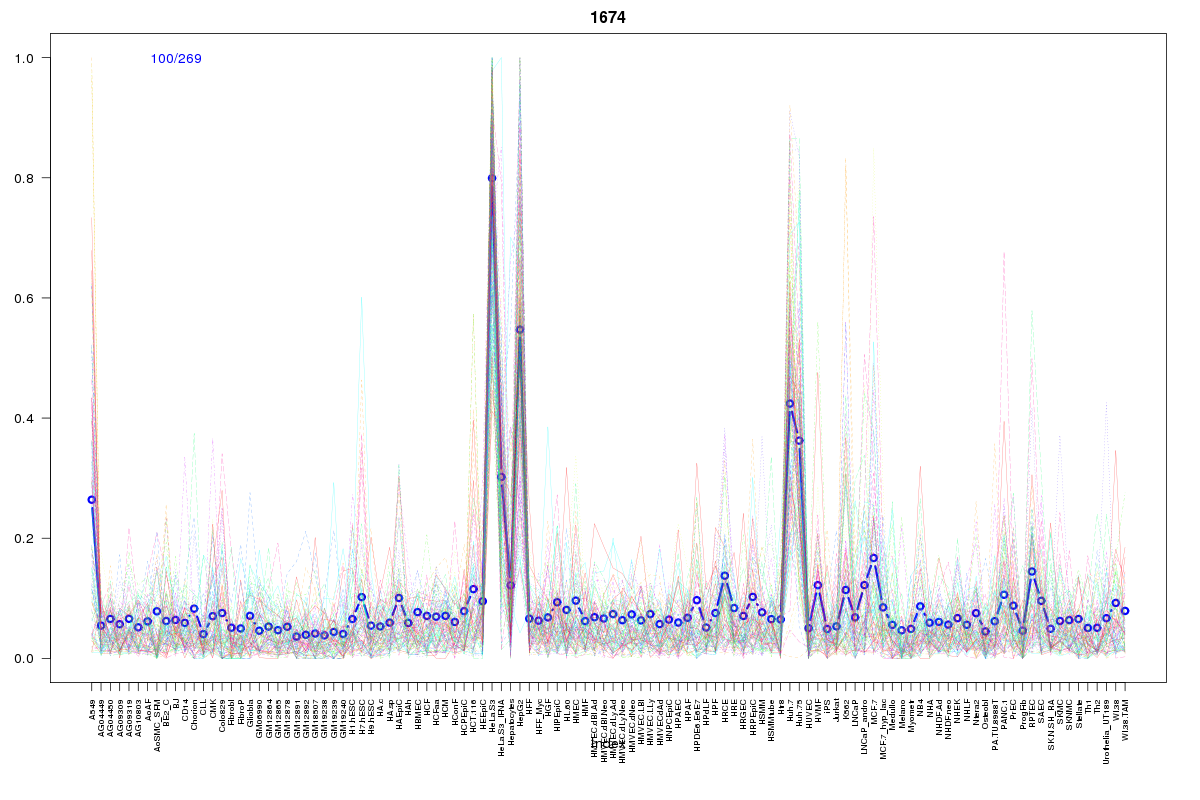 | 1674 | 2 |
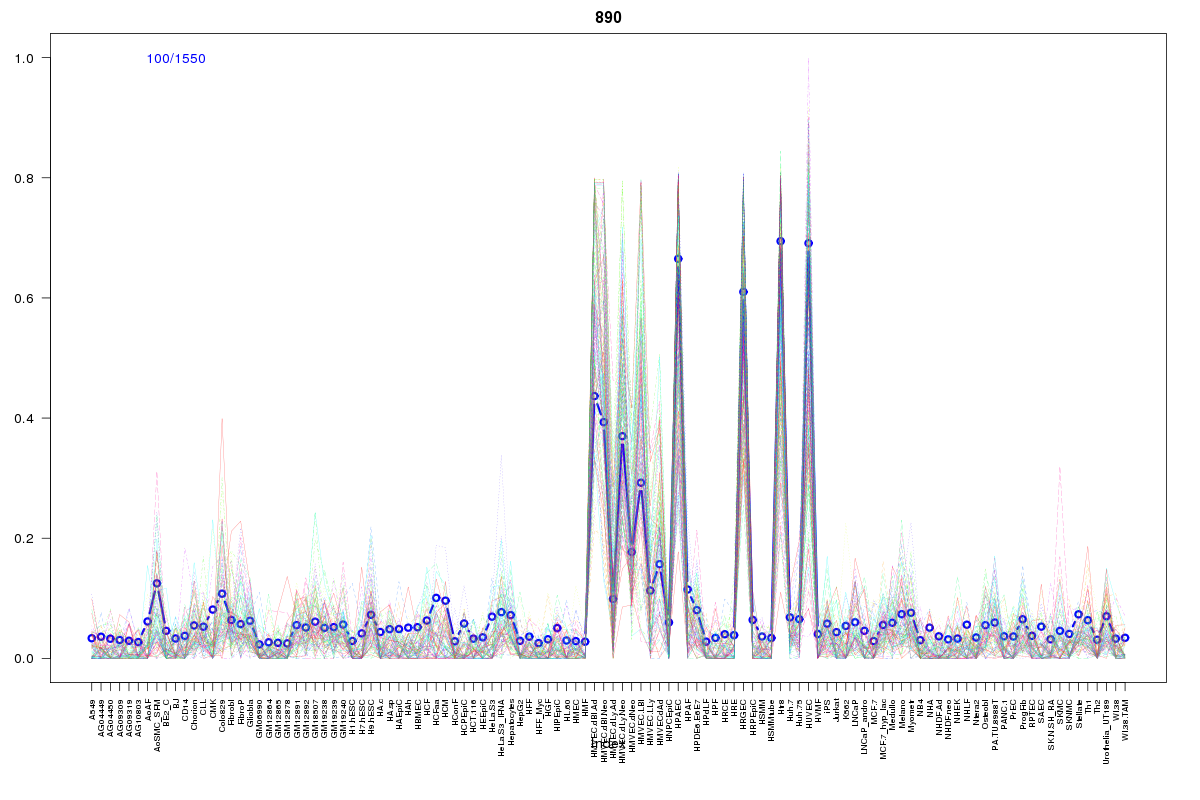 | 890 | 2 |
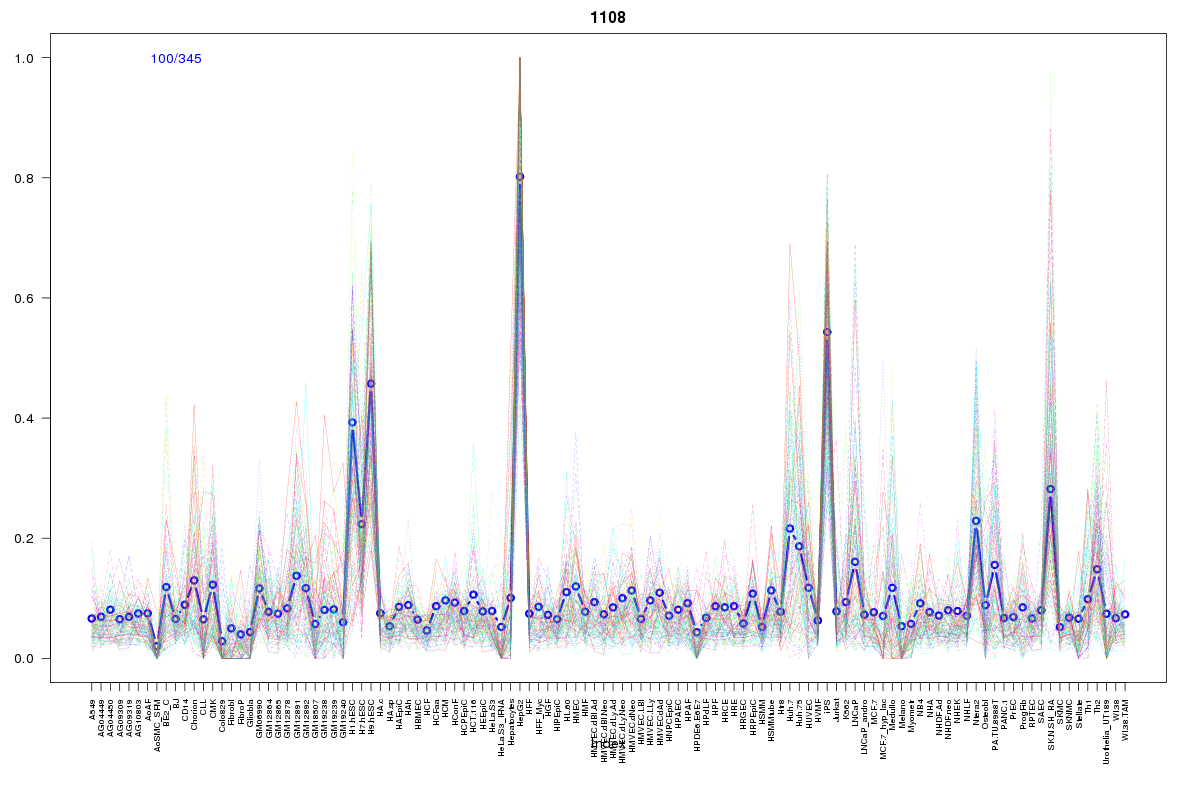 | 1108 | 2 |
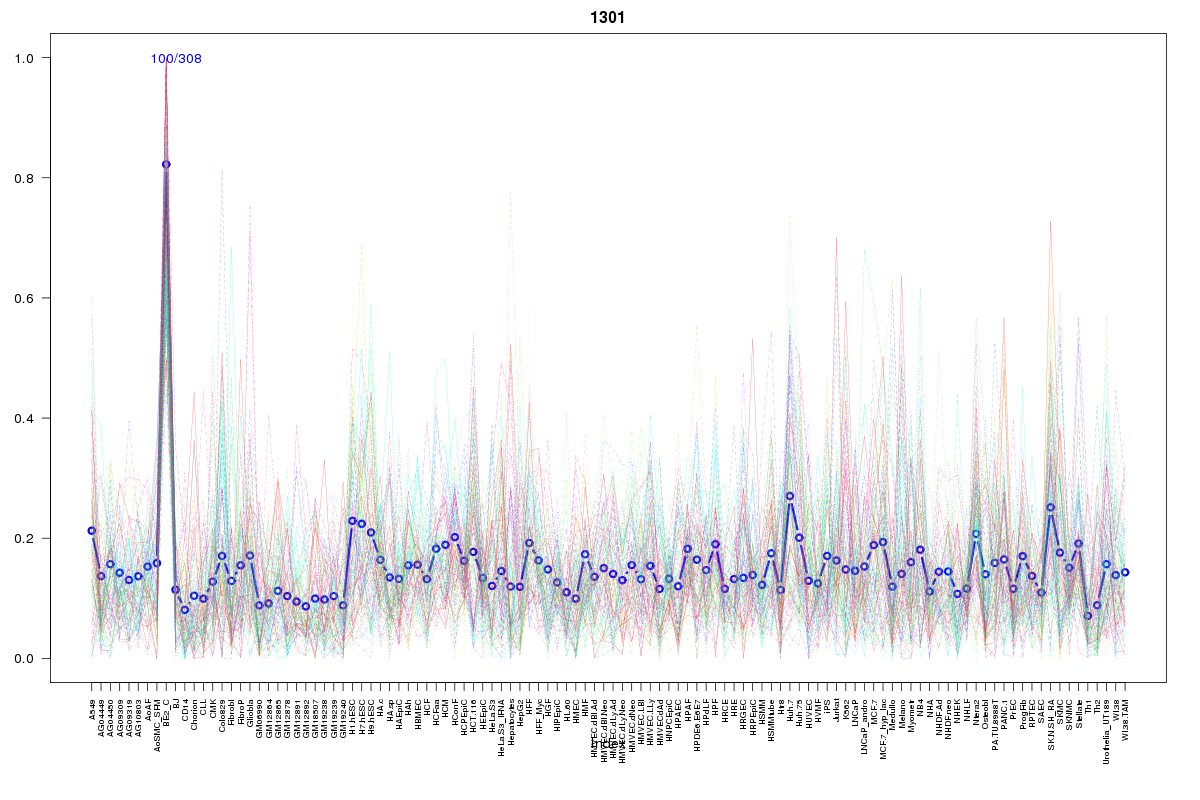 | 1301 | 2 |
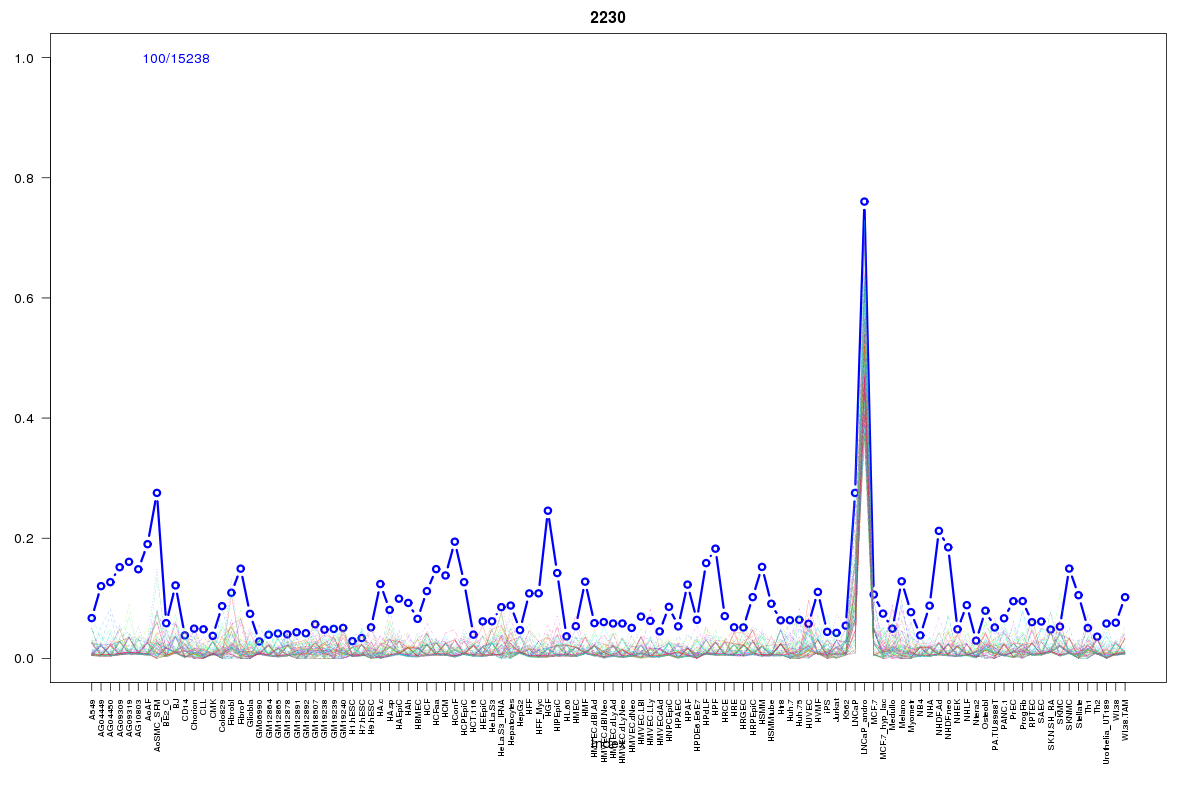 | 2230 | 2 |
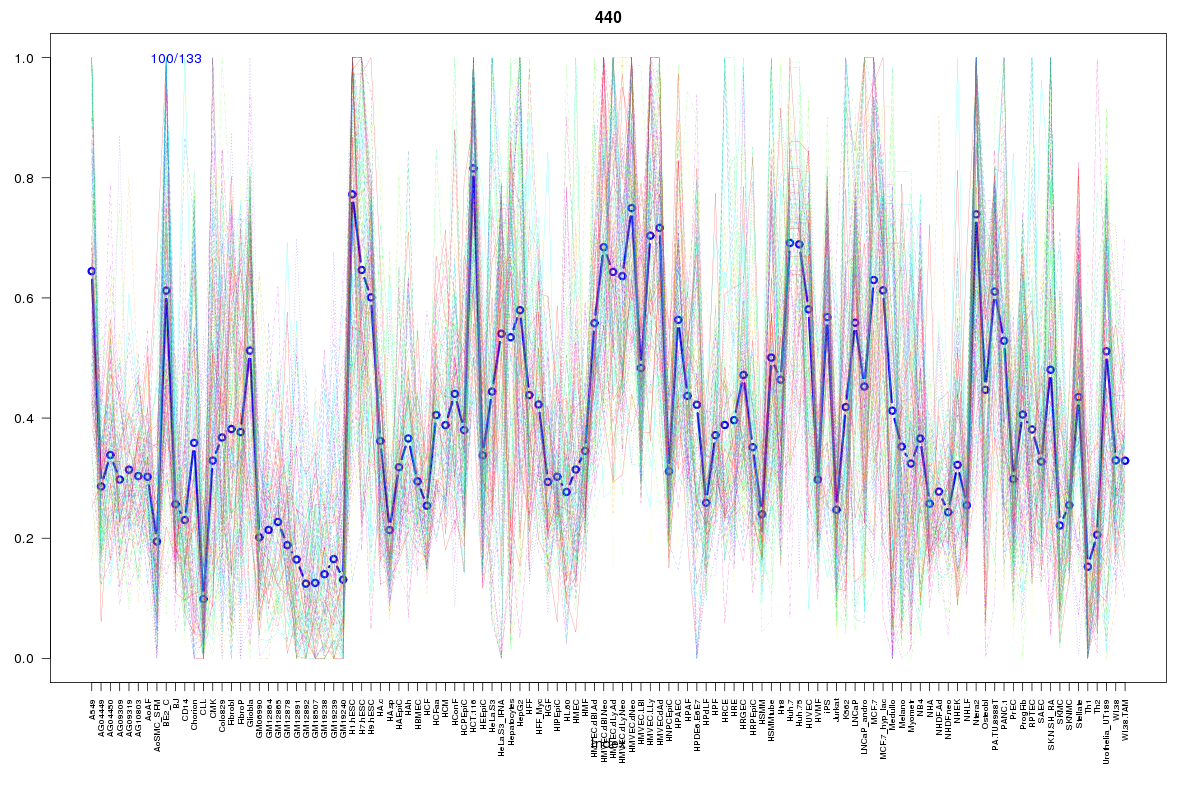 | 440 | 1 |
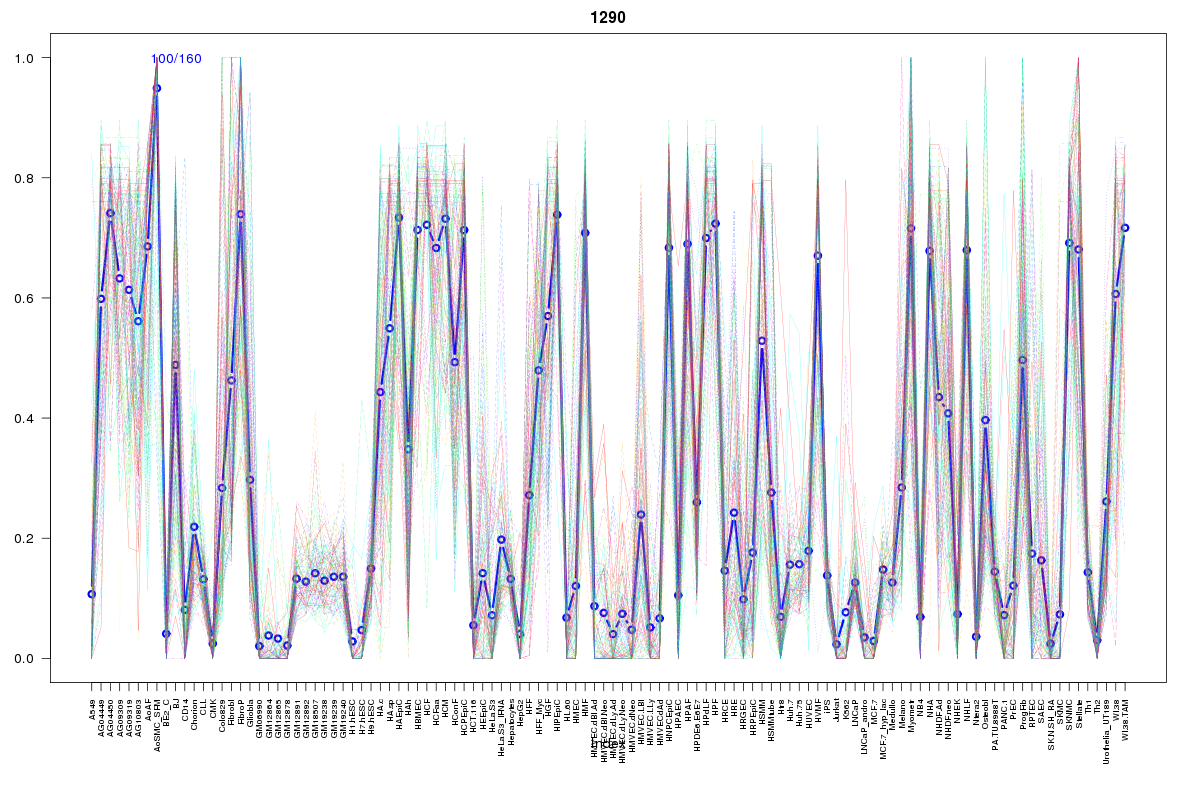 | 1290 | 1 |
 | 1876 | 1 |
 | 1099 | 1 |
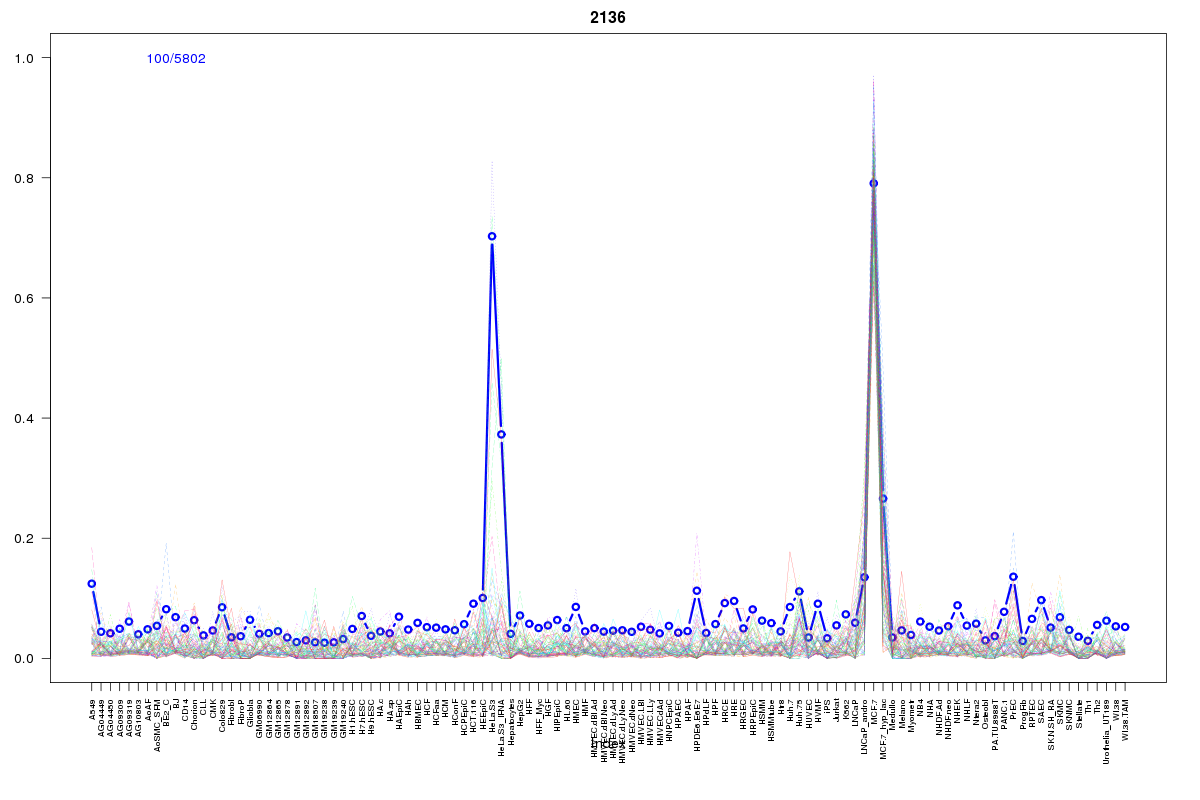 | 2136 | 1 |
 | 2100 | 1 |
 | 1724 | 1 |
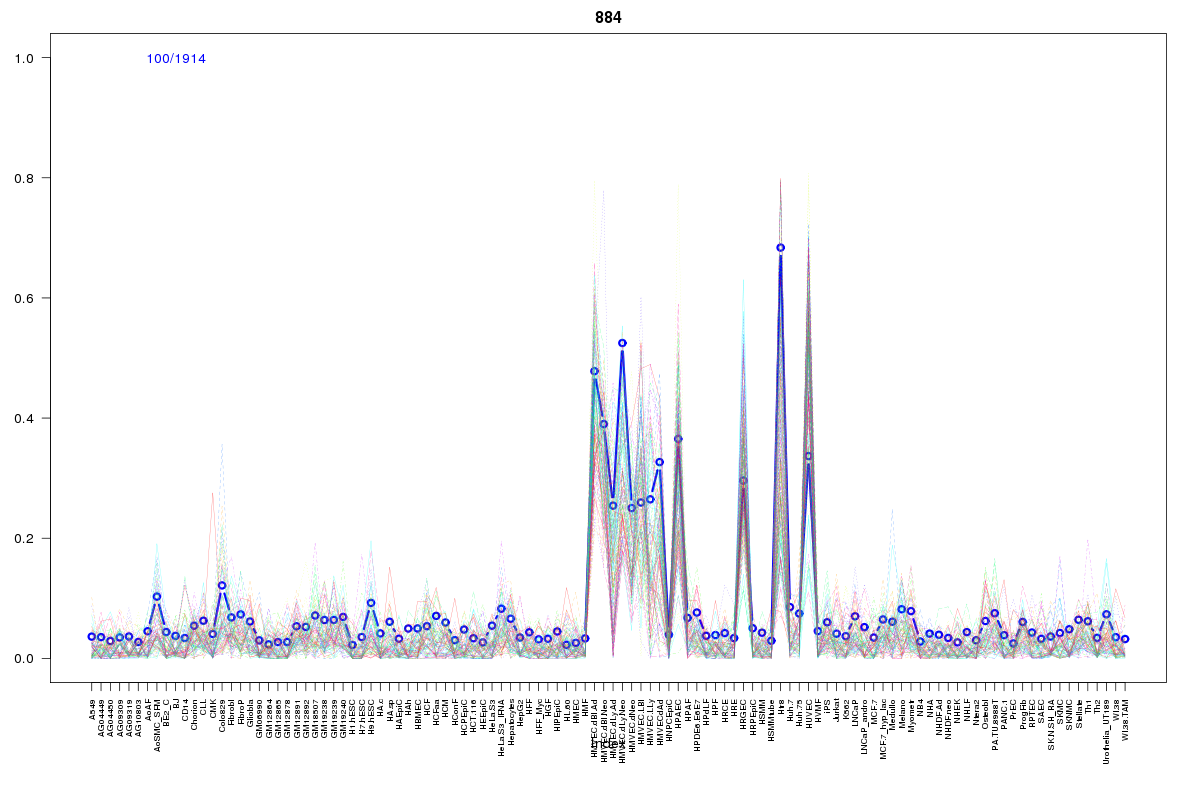 | 884 | 1 |
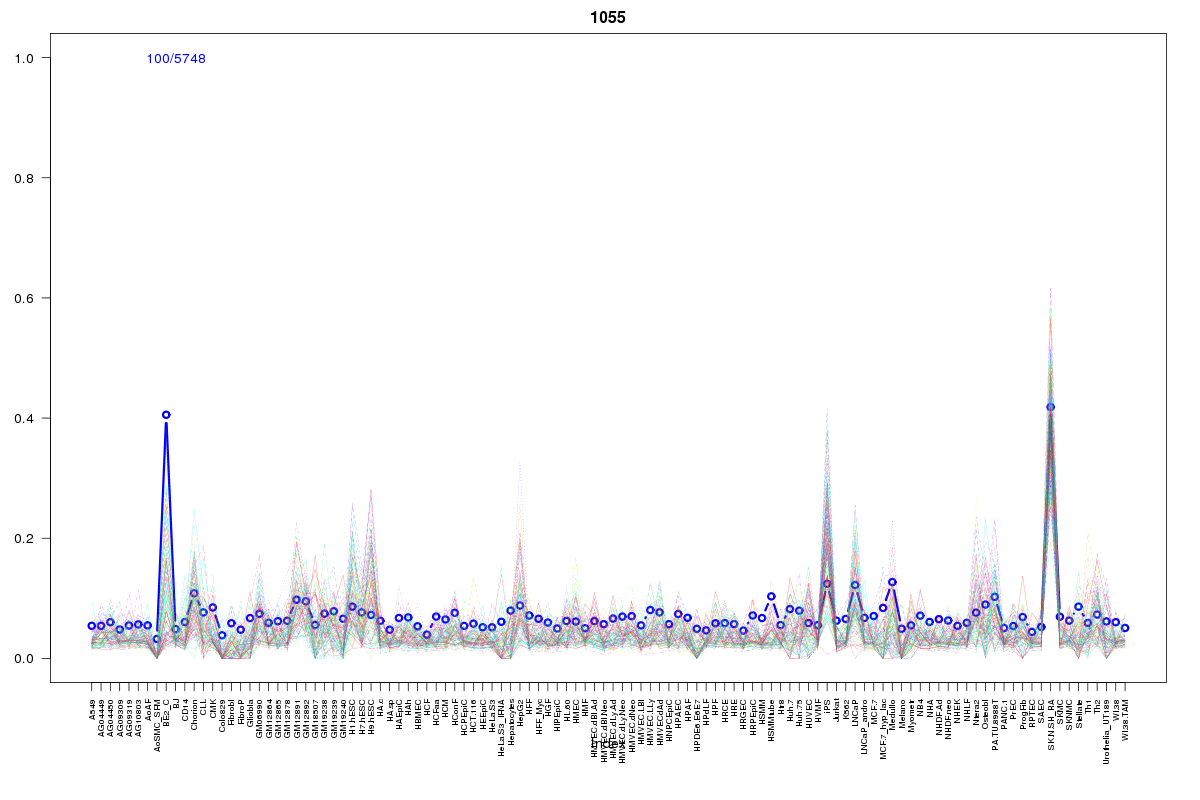 | 1055 | 1 |
 | 1355 | 1 |
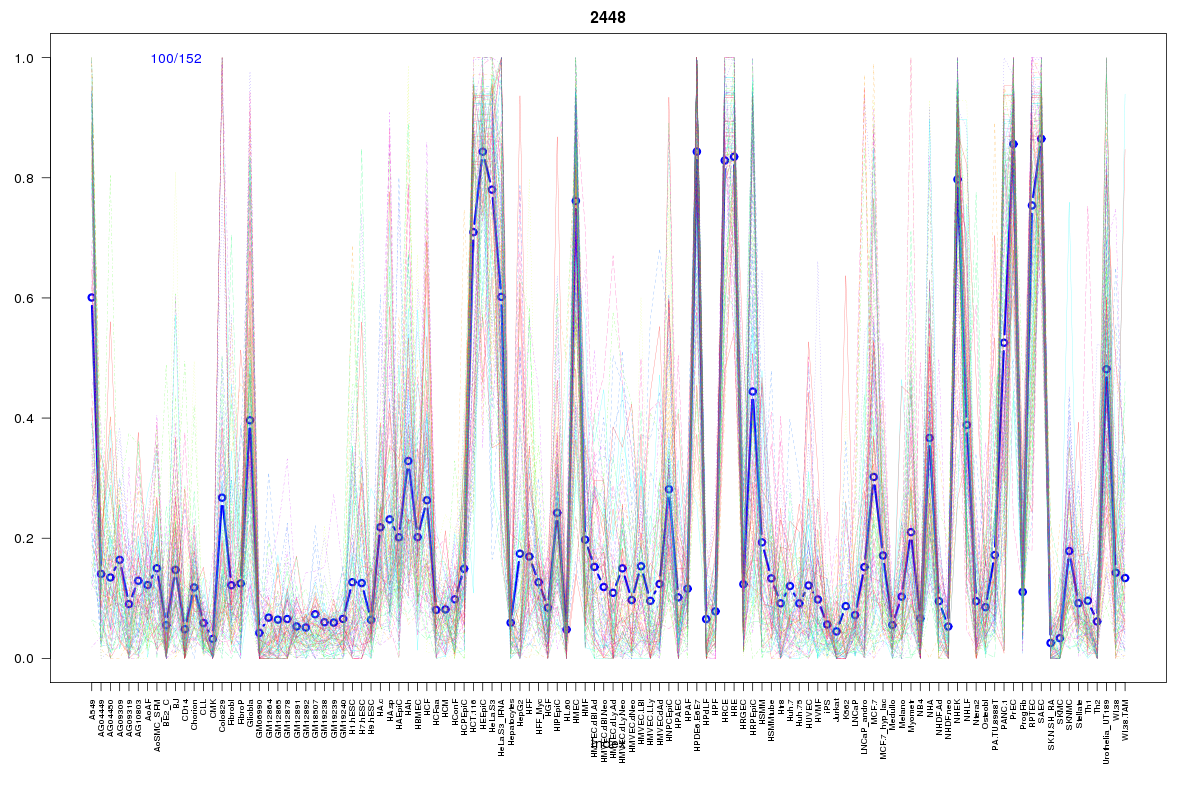 | 2448 | 1 |
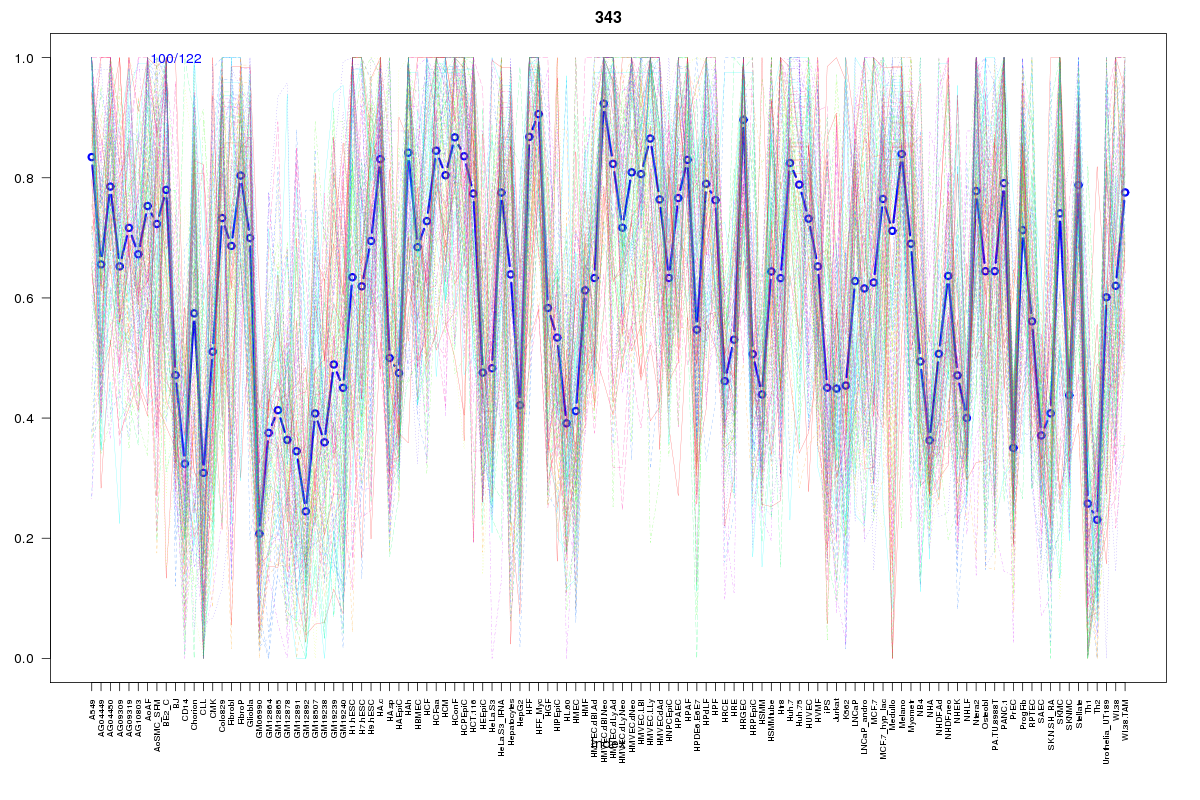 | 343 | 1 |
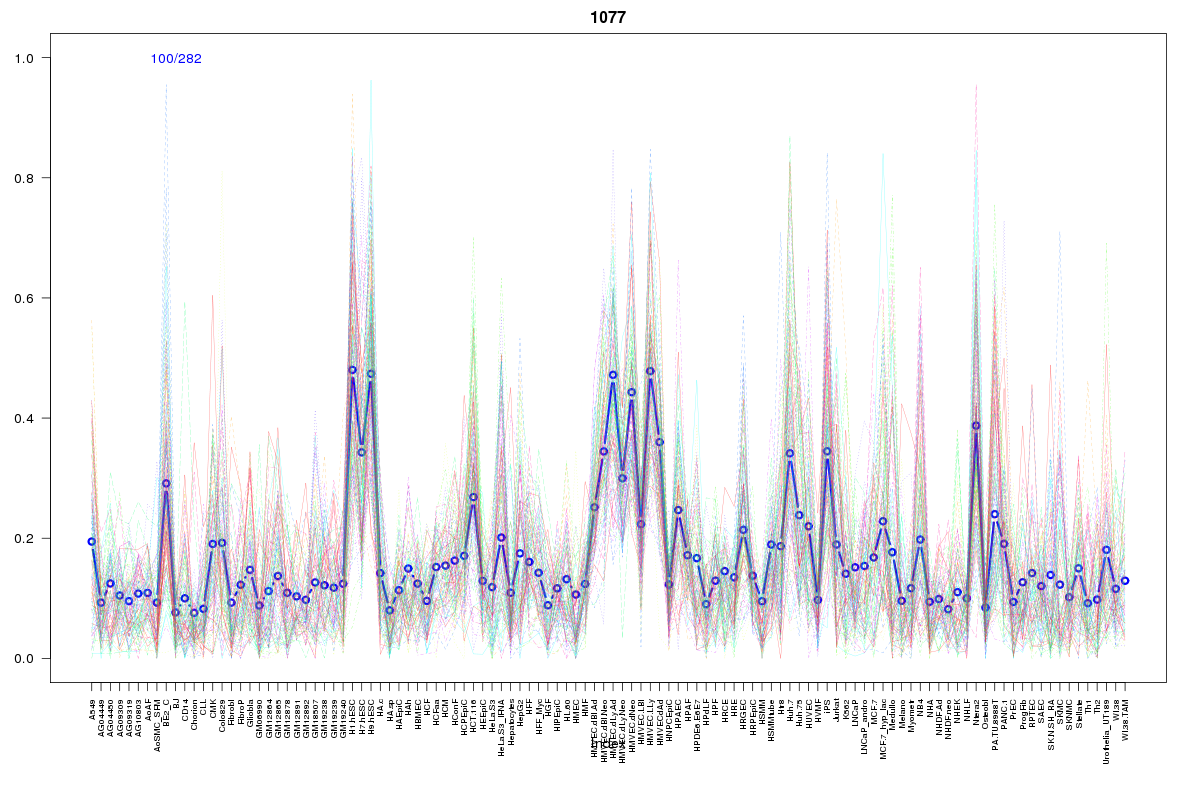 | 1077 | 1 |
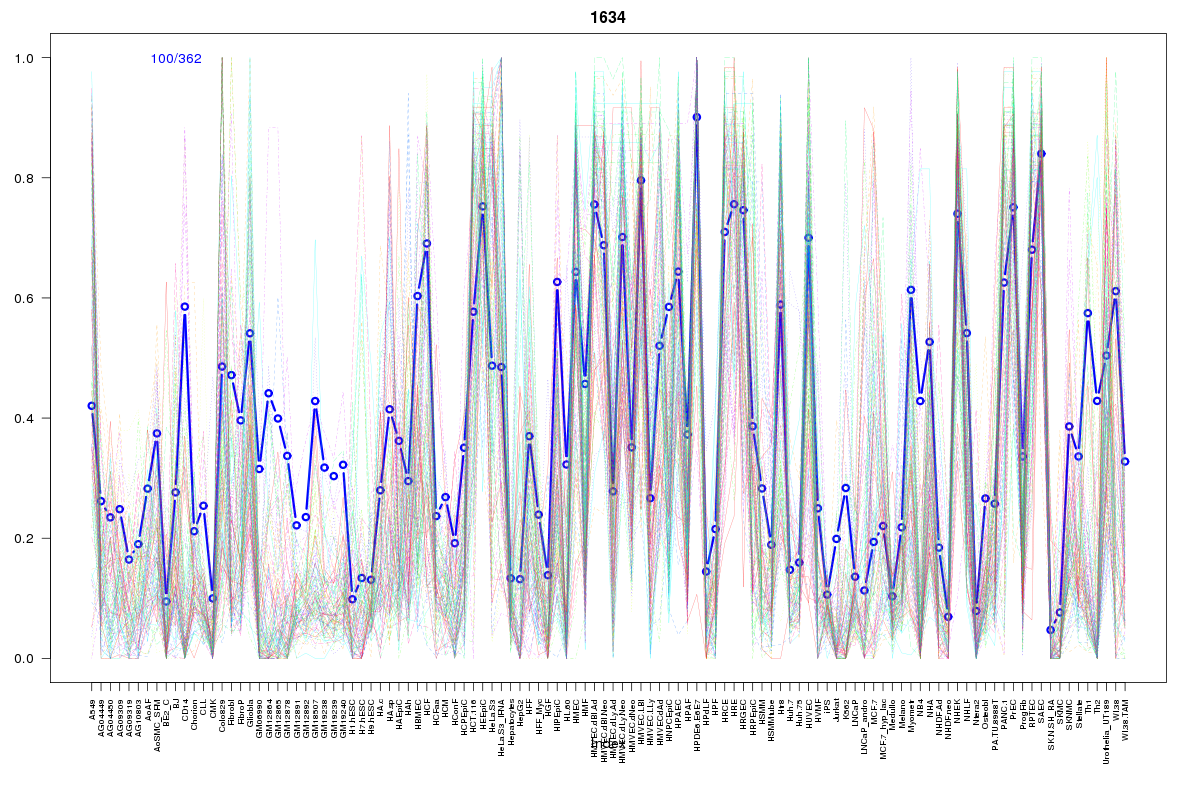 | 1634 | 1 |
 | 1858 | 1 |
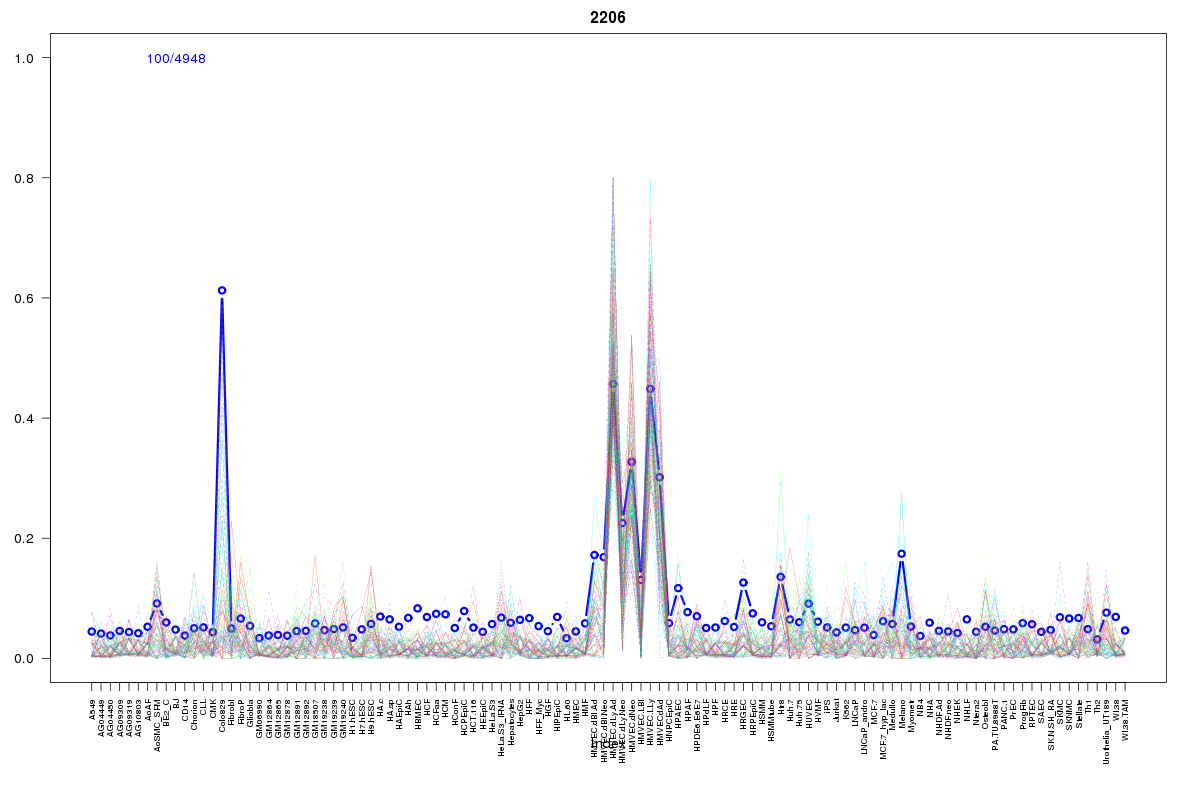 | 2206 | 1 |
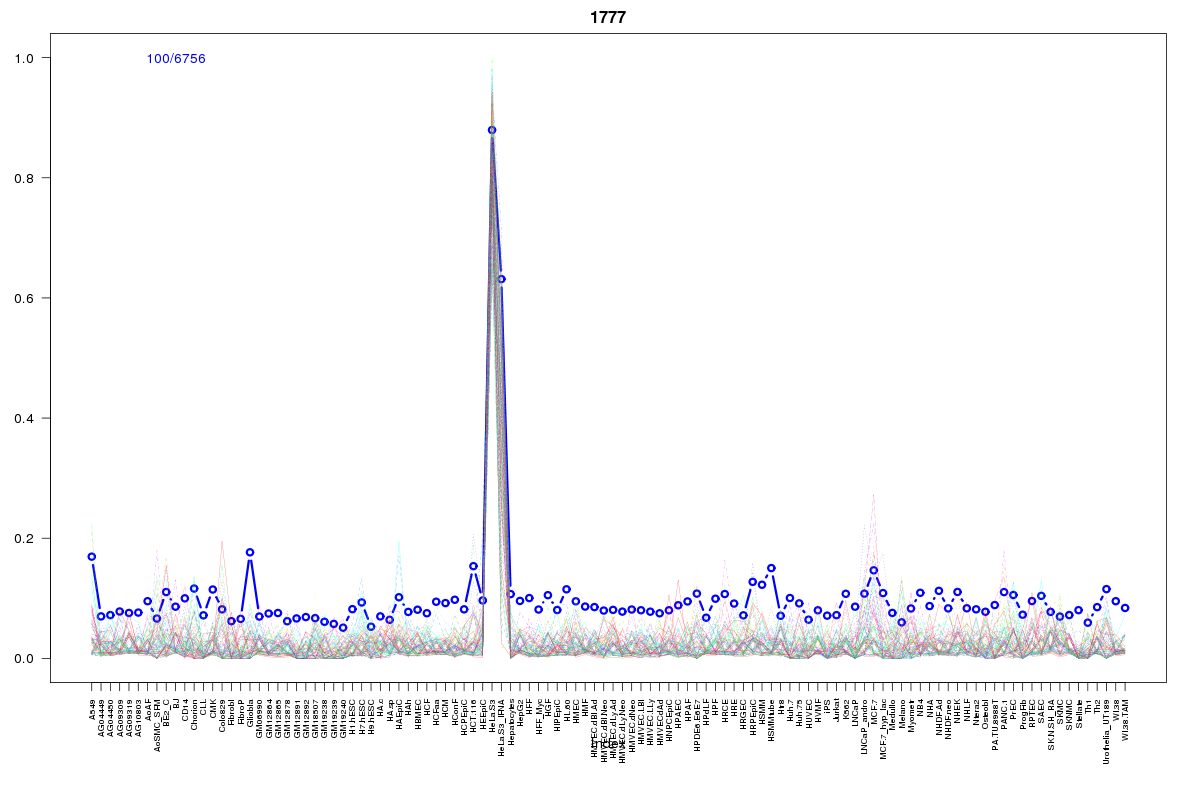 | 1777 | 1 |
 | 2186 | 1 |
 | 979 | 1 |
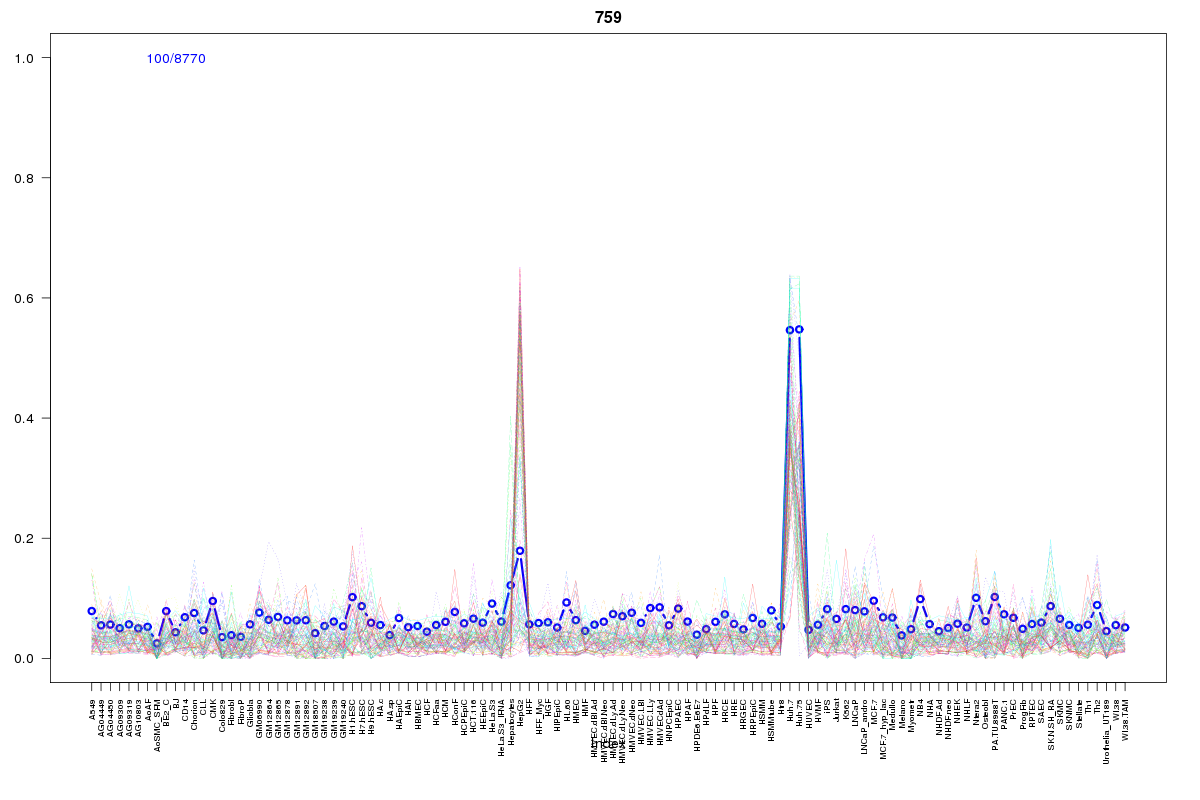 | 759 | 1 |
 | 2077 | 1 |
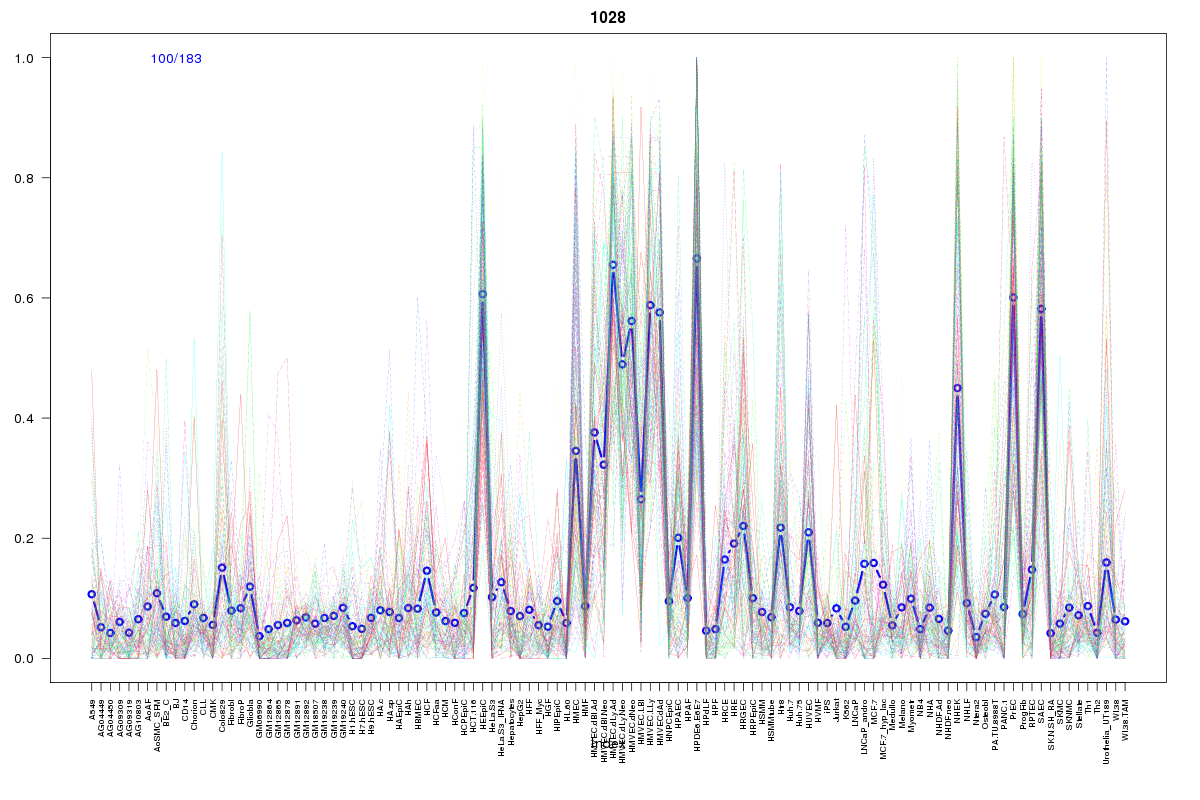 | 1028 | 1 |
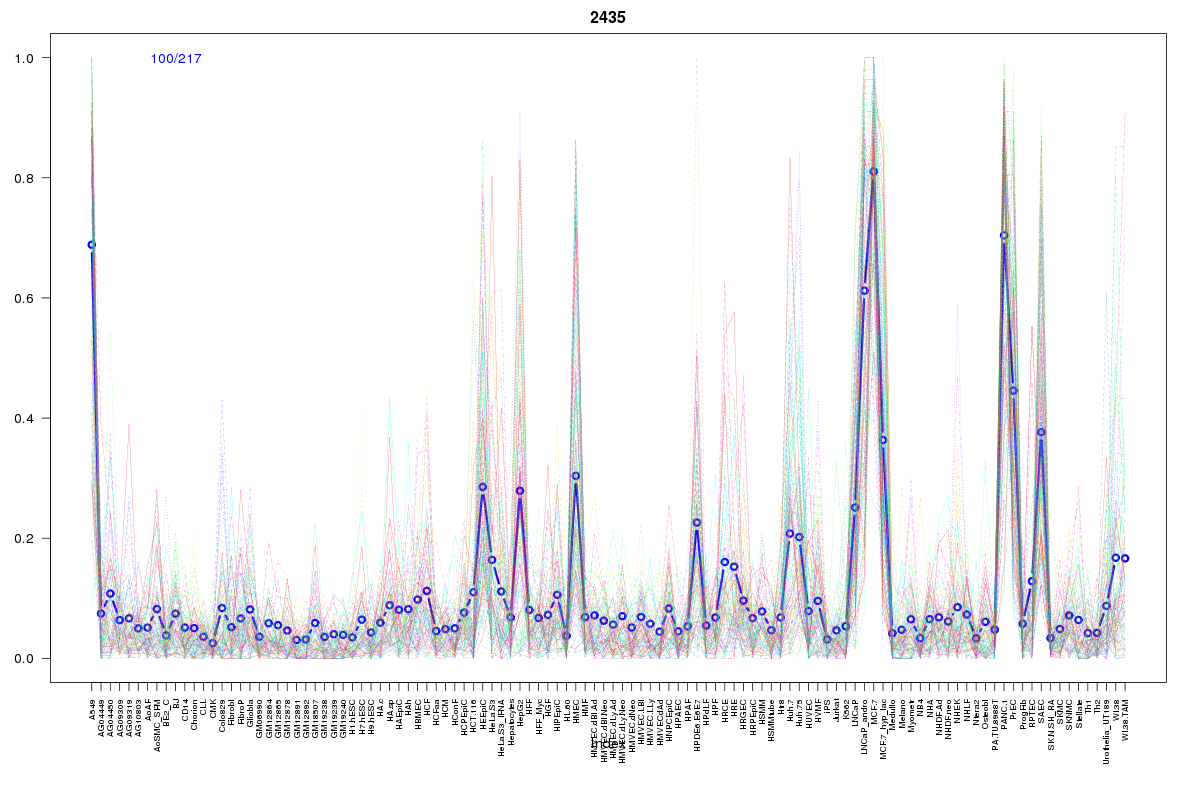 | 2435 | 1 |
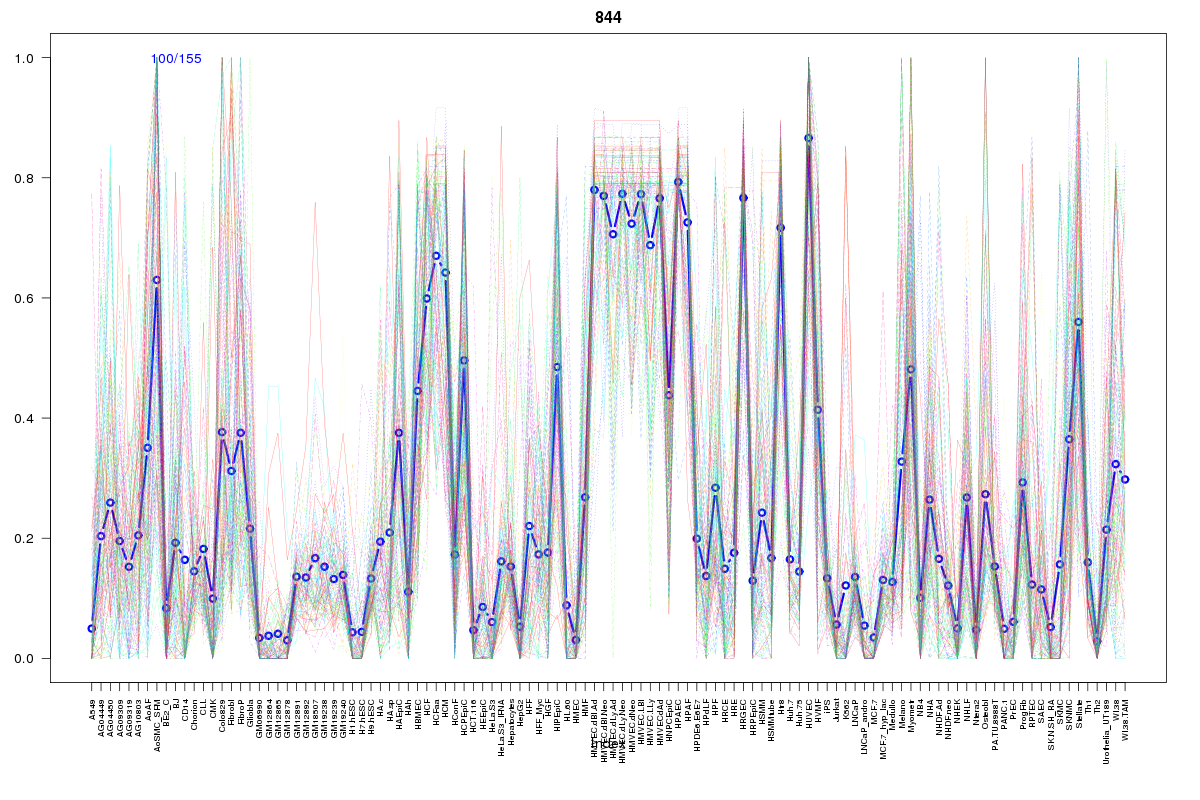 | 844 | 1 |
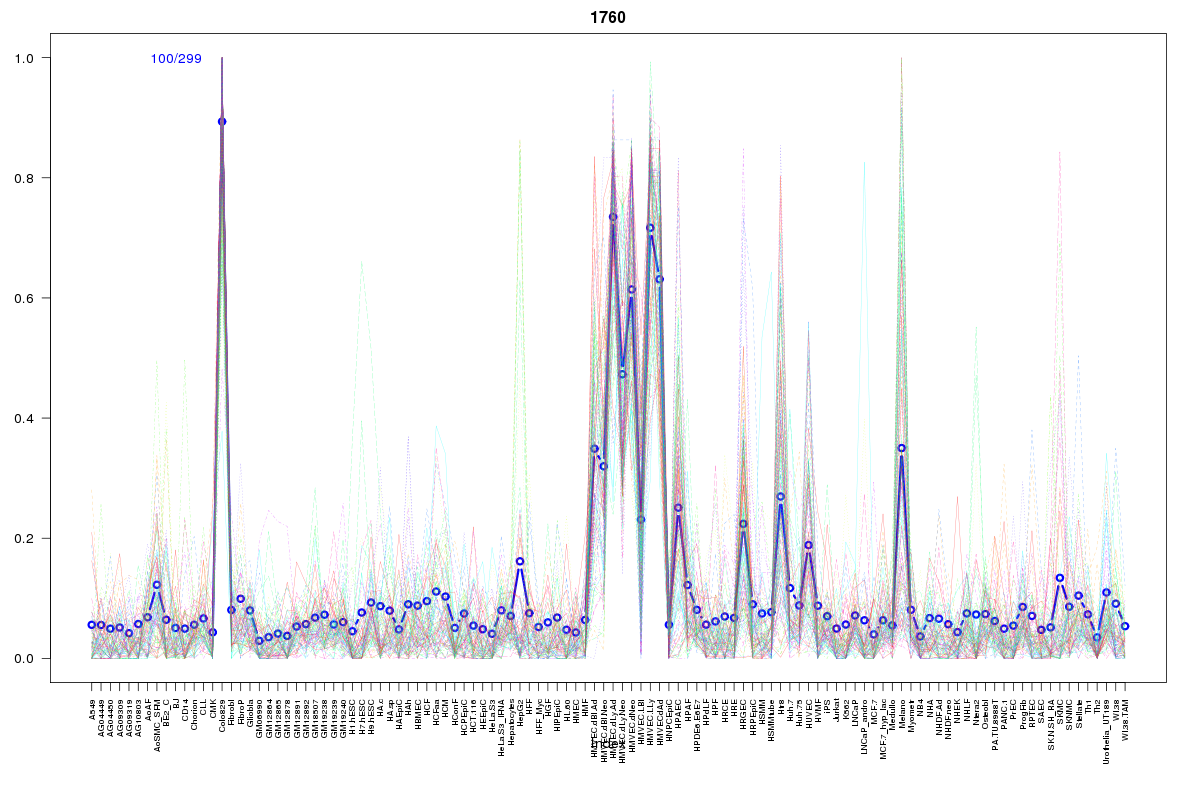 | 1760 | 1 |
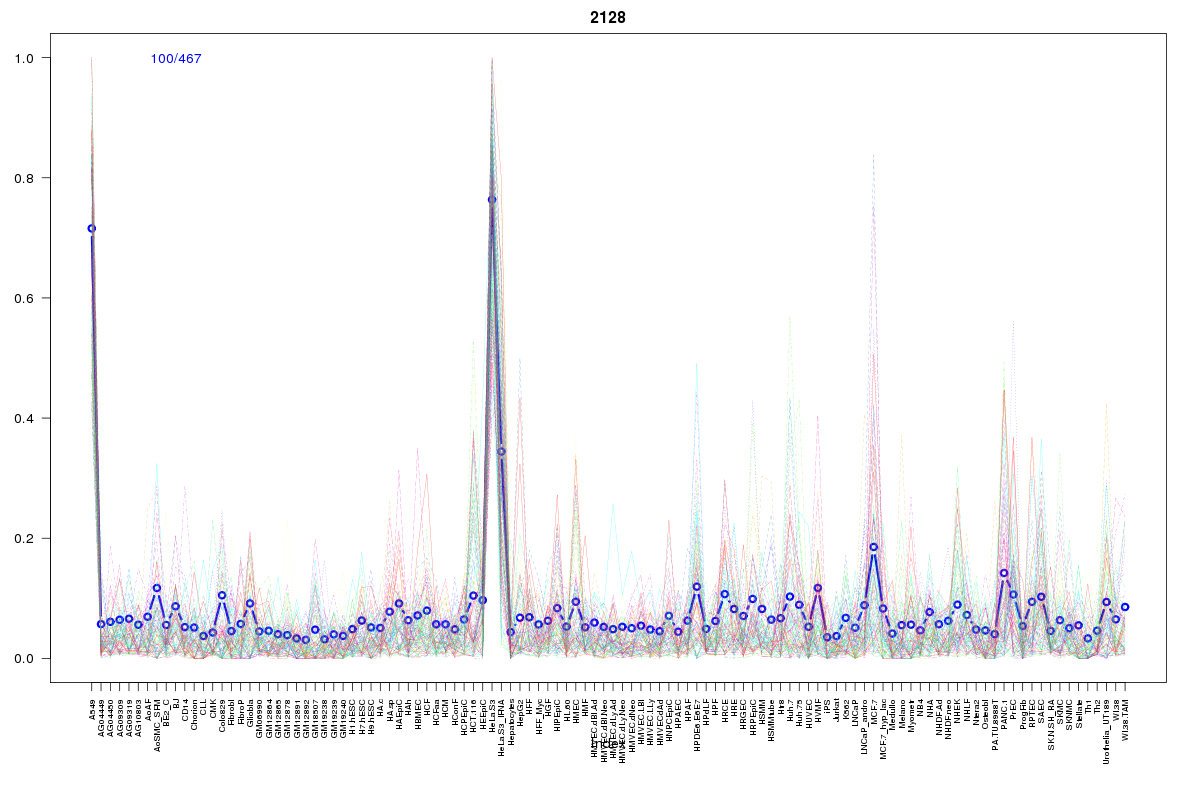 | 2128 | 1 |
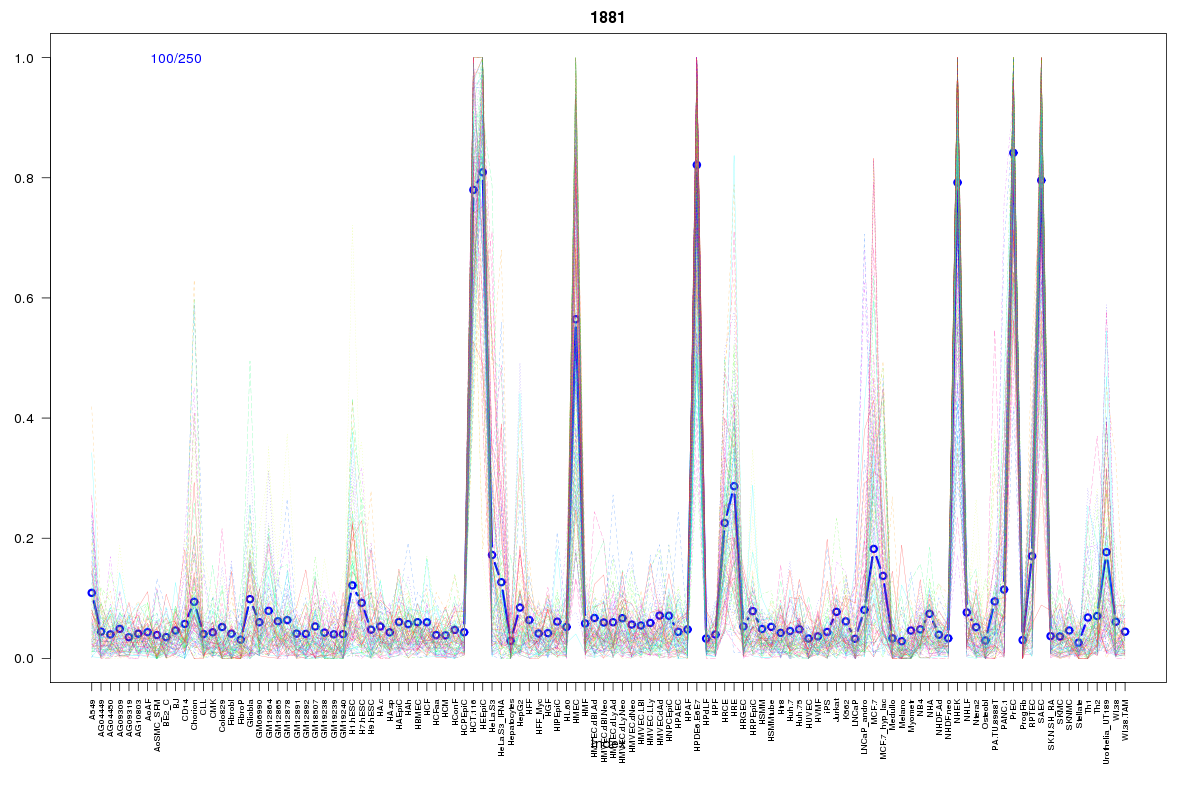 | 1881 | 1 |
 | 592 | 1 |
 | 1177 | 1 |
 | 2298 | 1 |
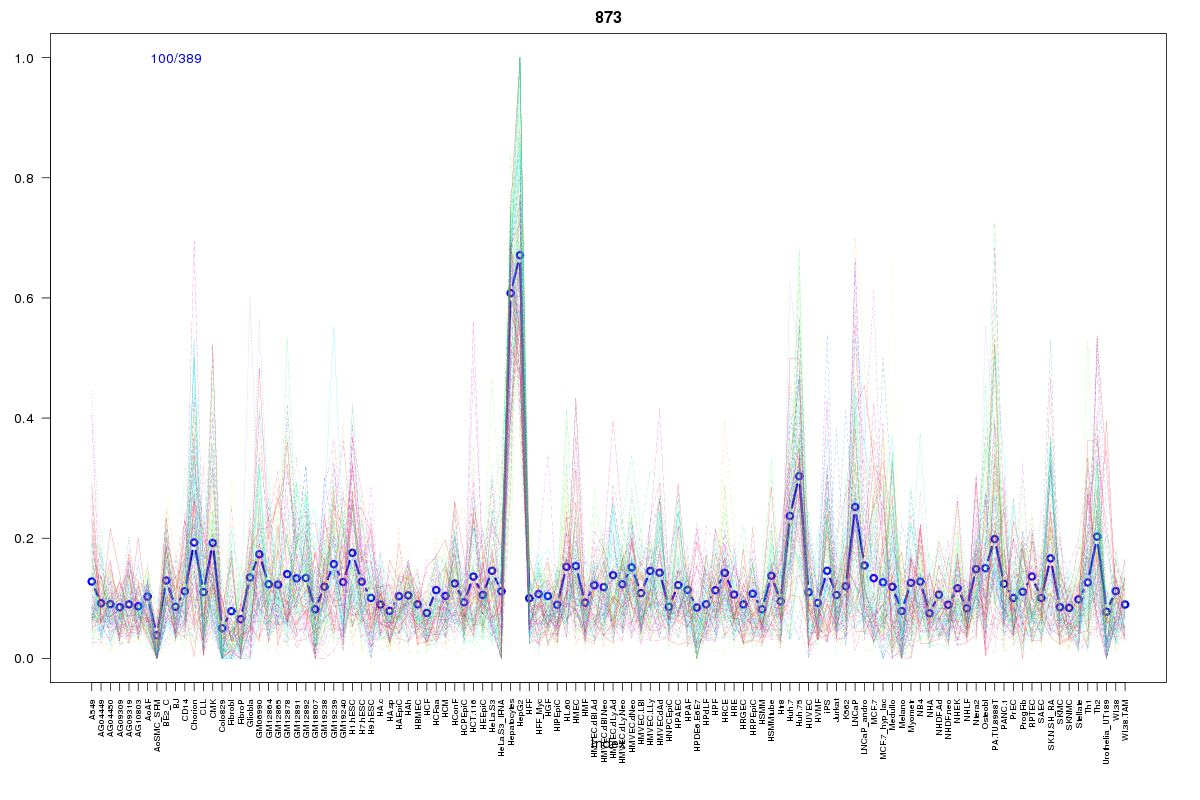 | 873 | 1 |
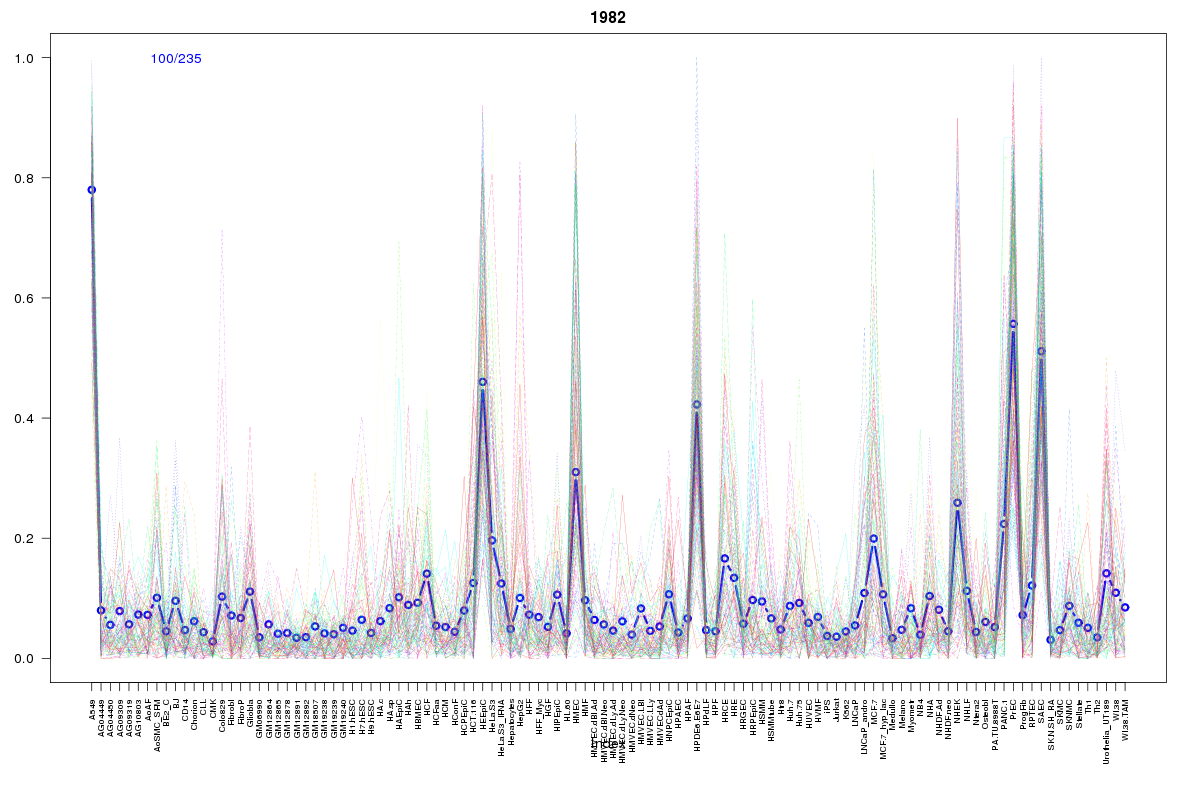 | 1982 | 1 |
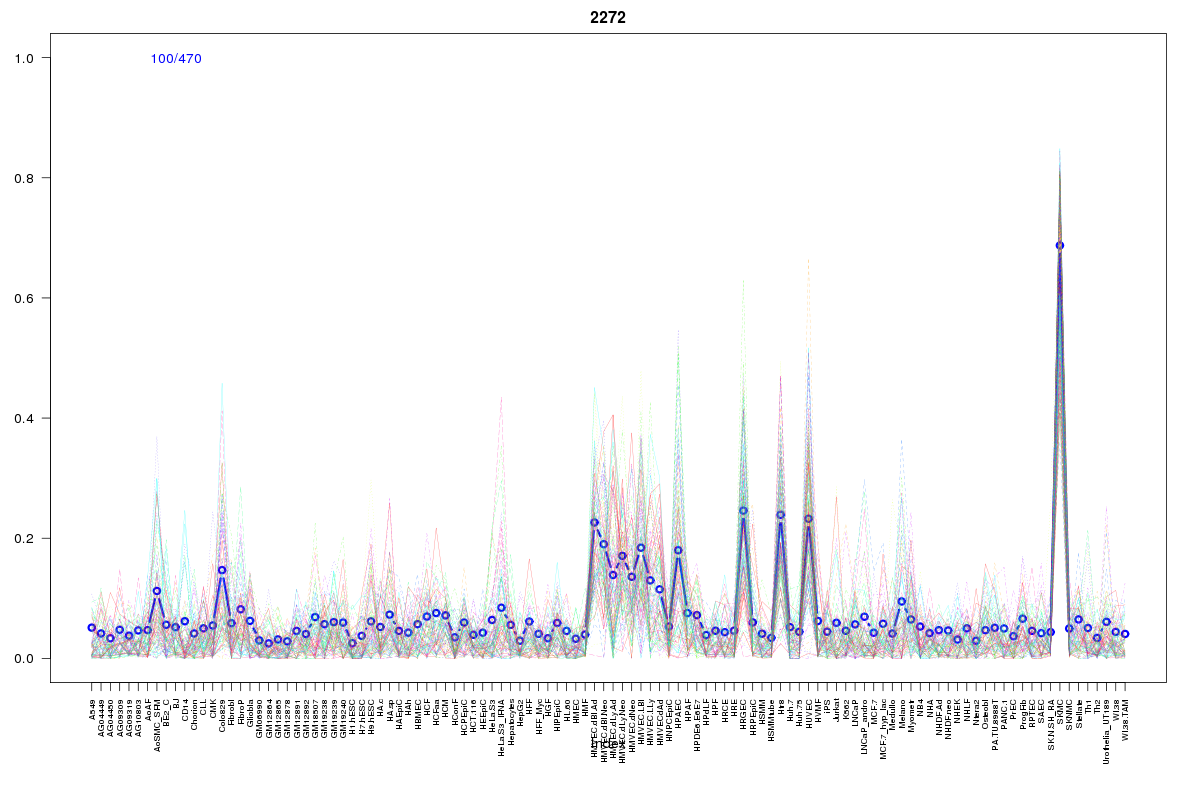 | 2272 | 1 |
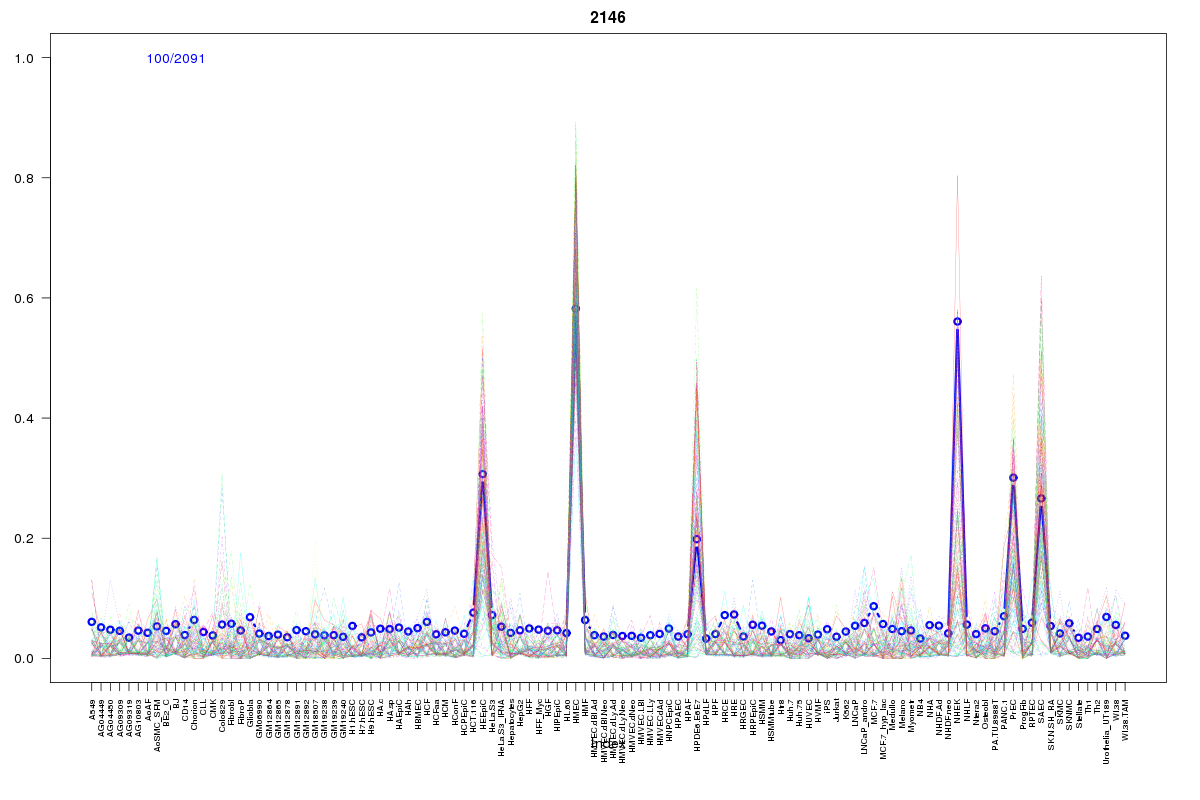 | 2146 | 1 |
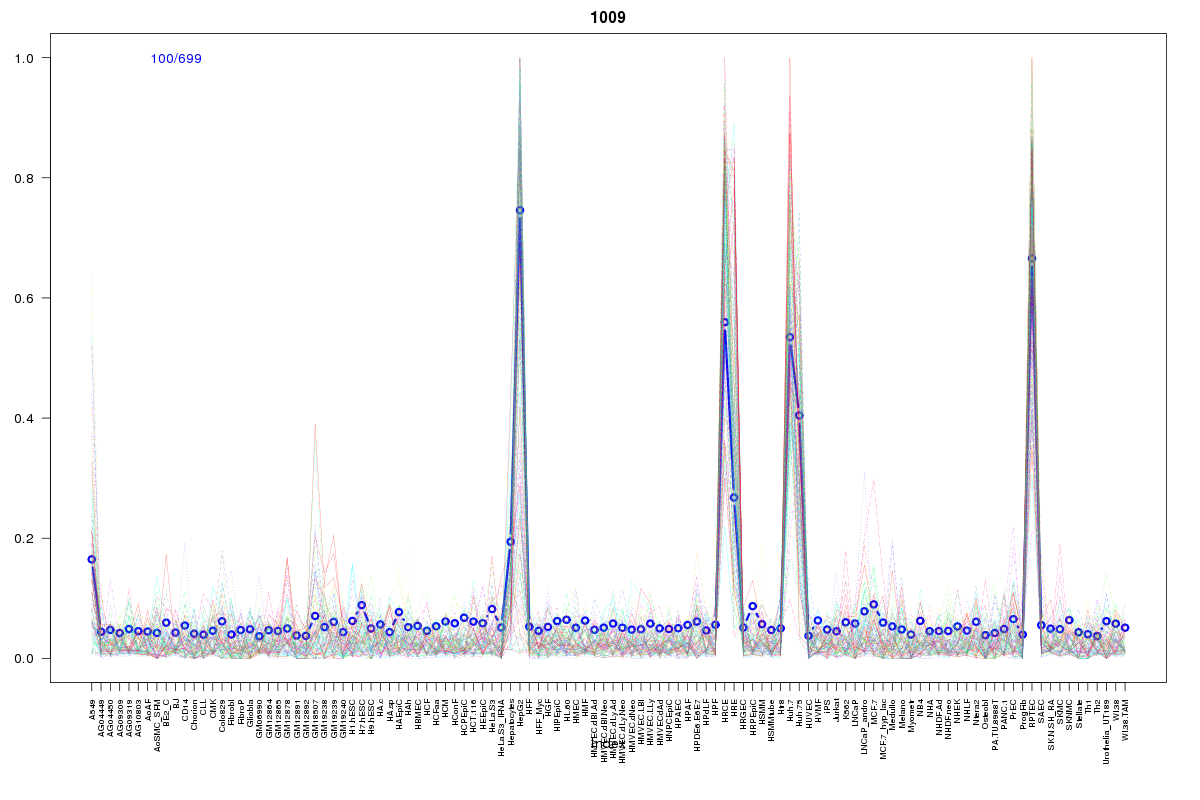 | 1009 | 1 |
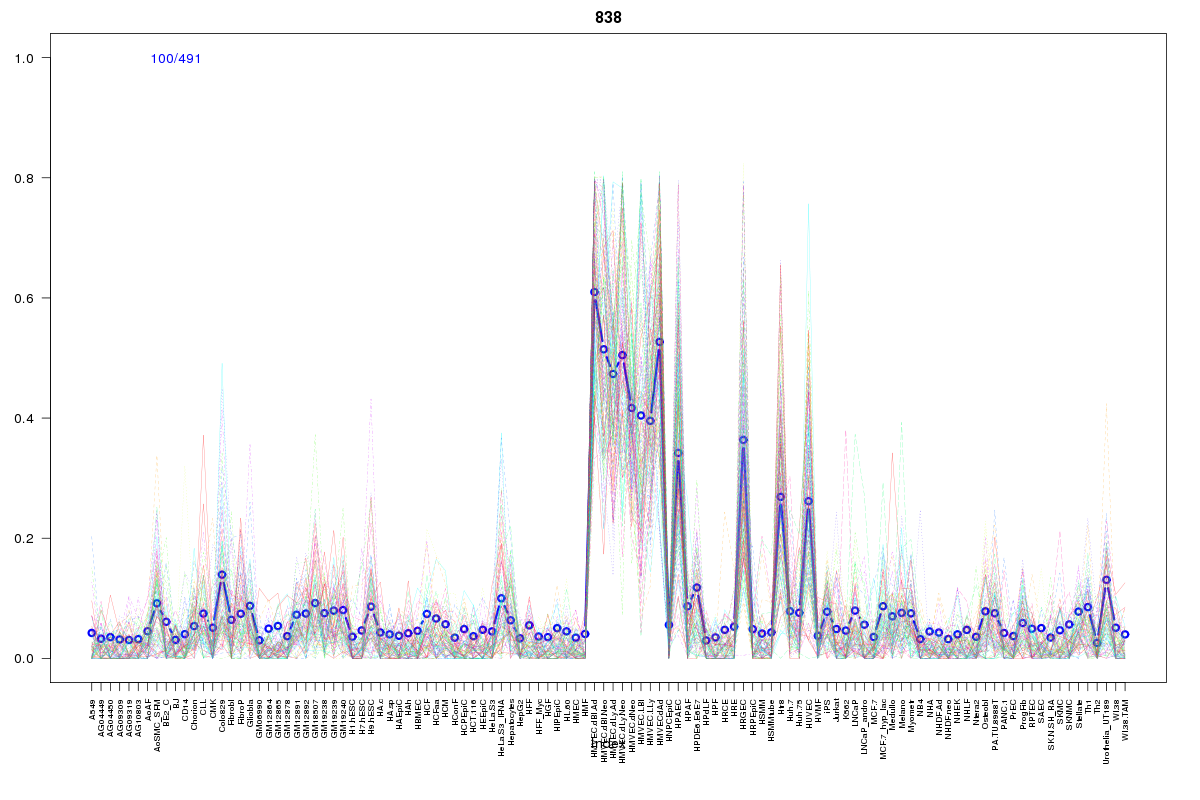 | 838 | 1 |
 | 2195 | 1 |
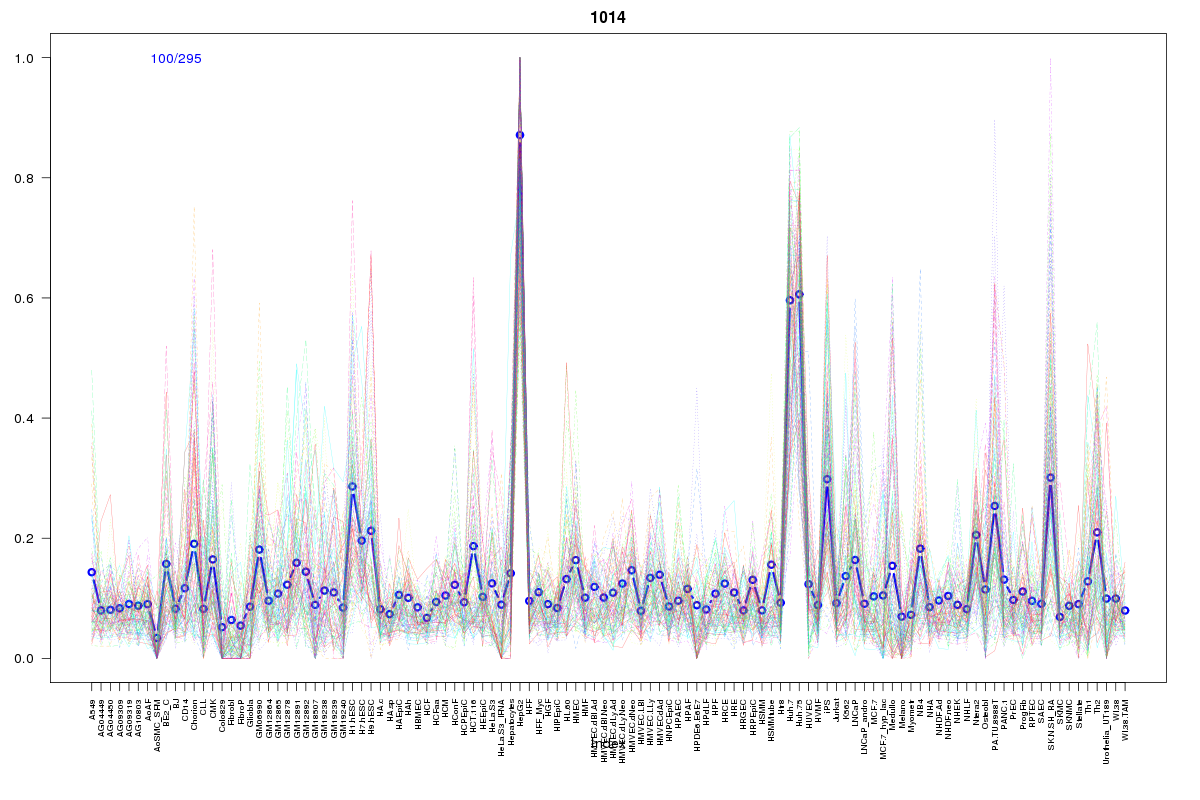 | 1014 | 1 |
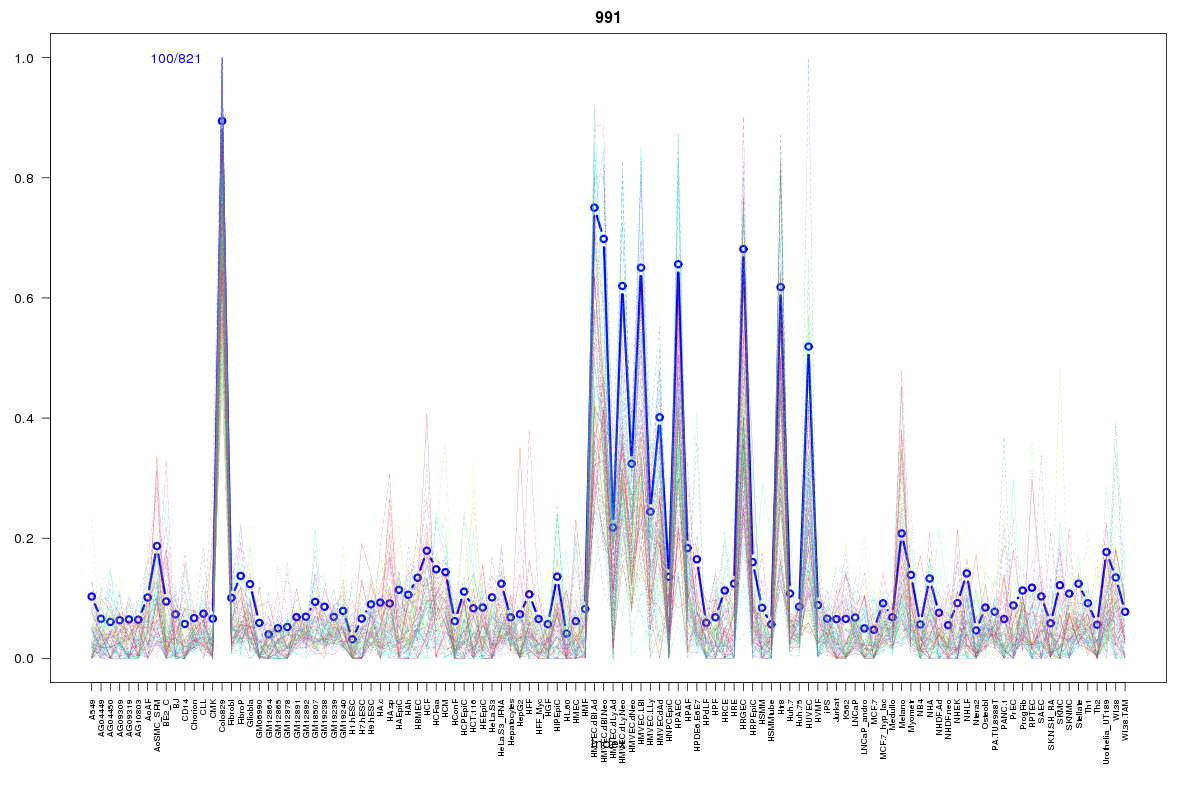 | 991 | 1 |
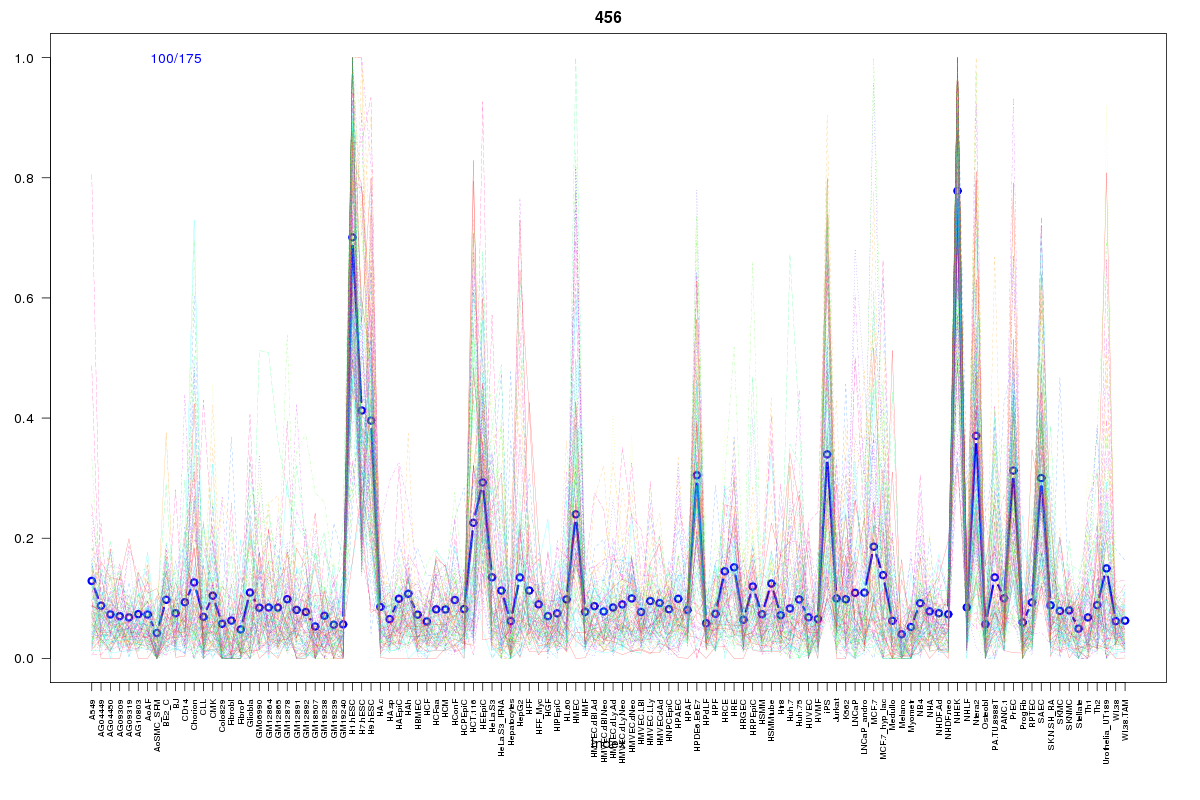 | 456 | 1 |
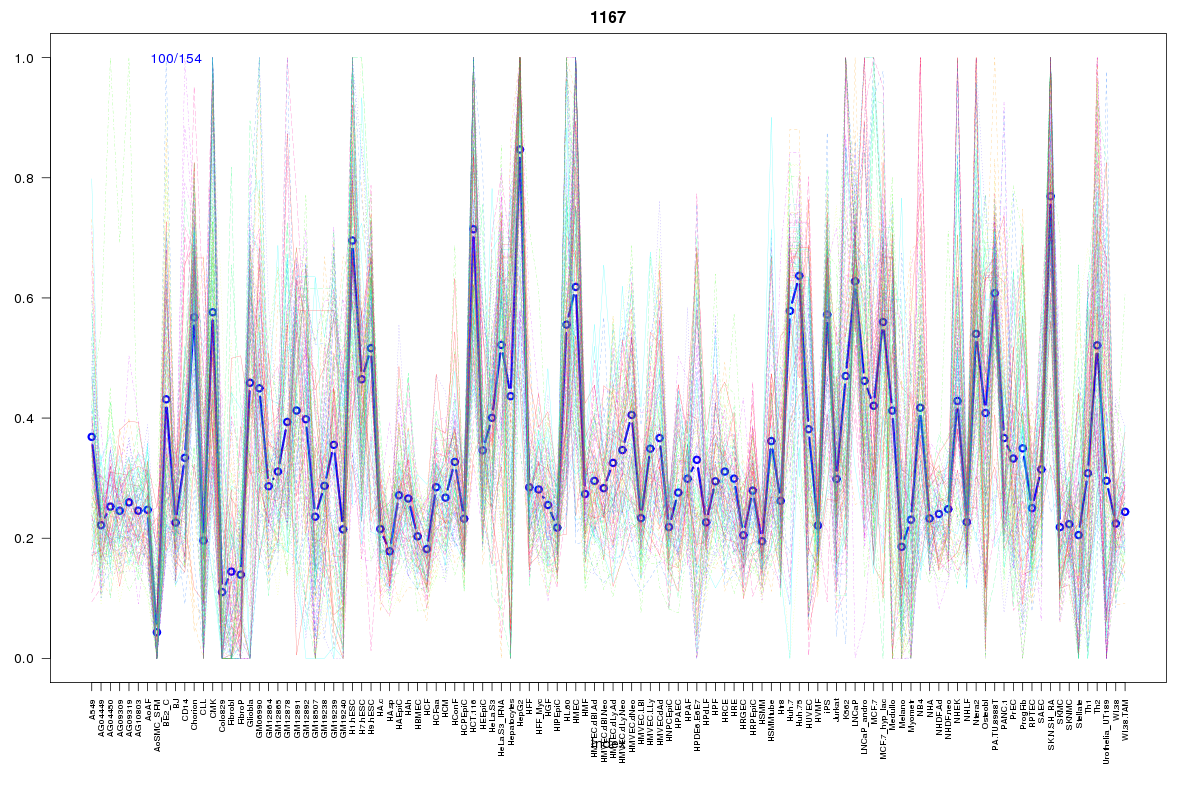 | 1167 | 1 |
 | 2369 | 1 |
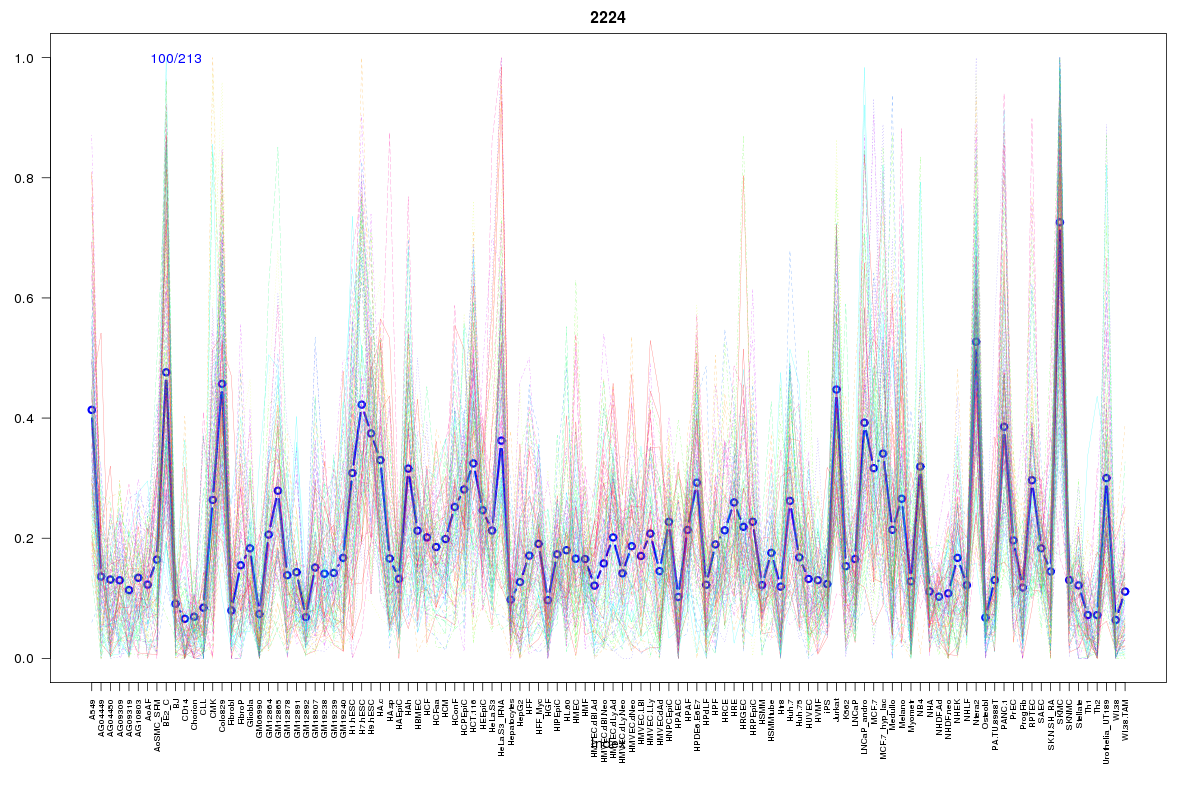 | 2224 | 1 |
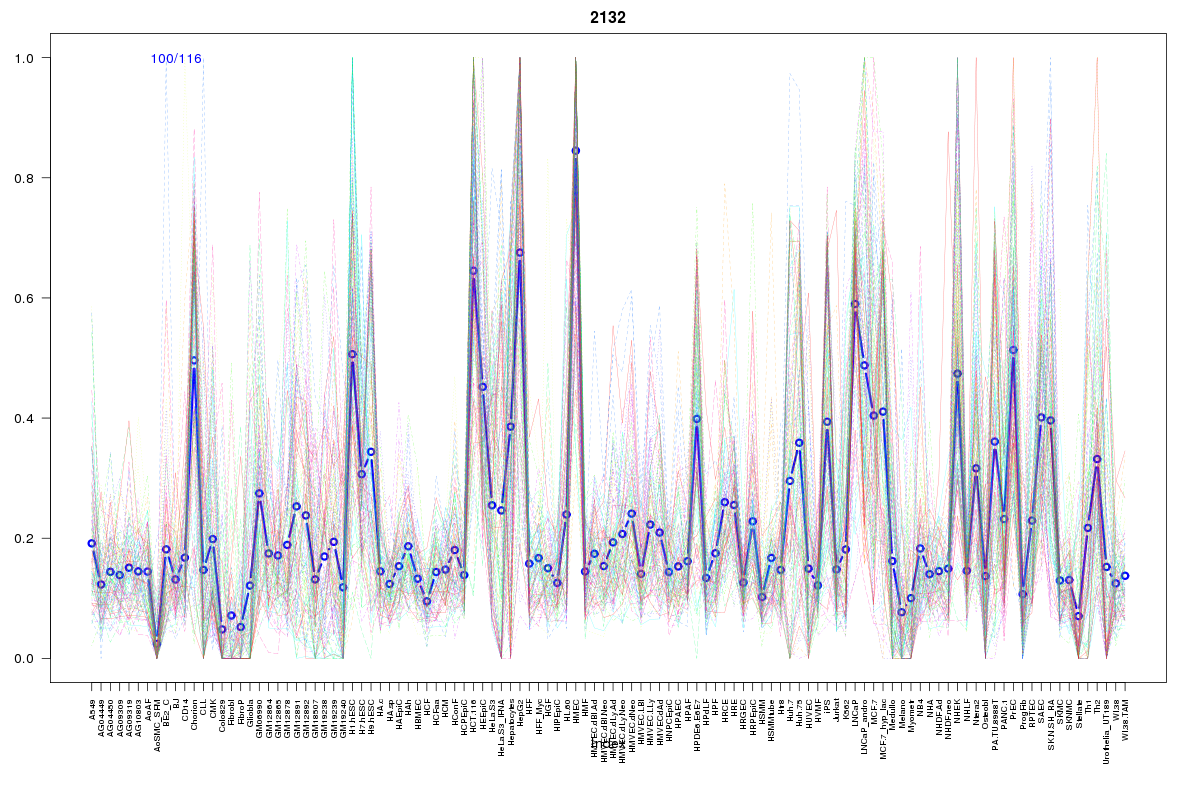 | 2132 | 1 |
 | 2055 | 1 |
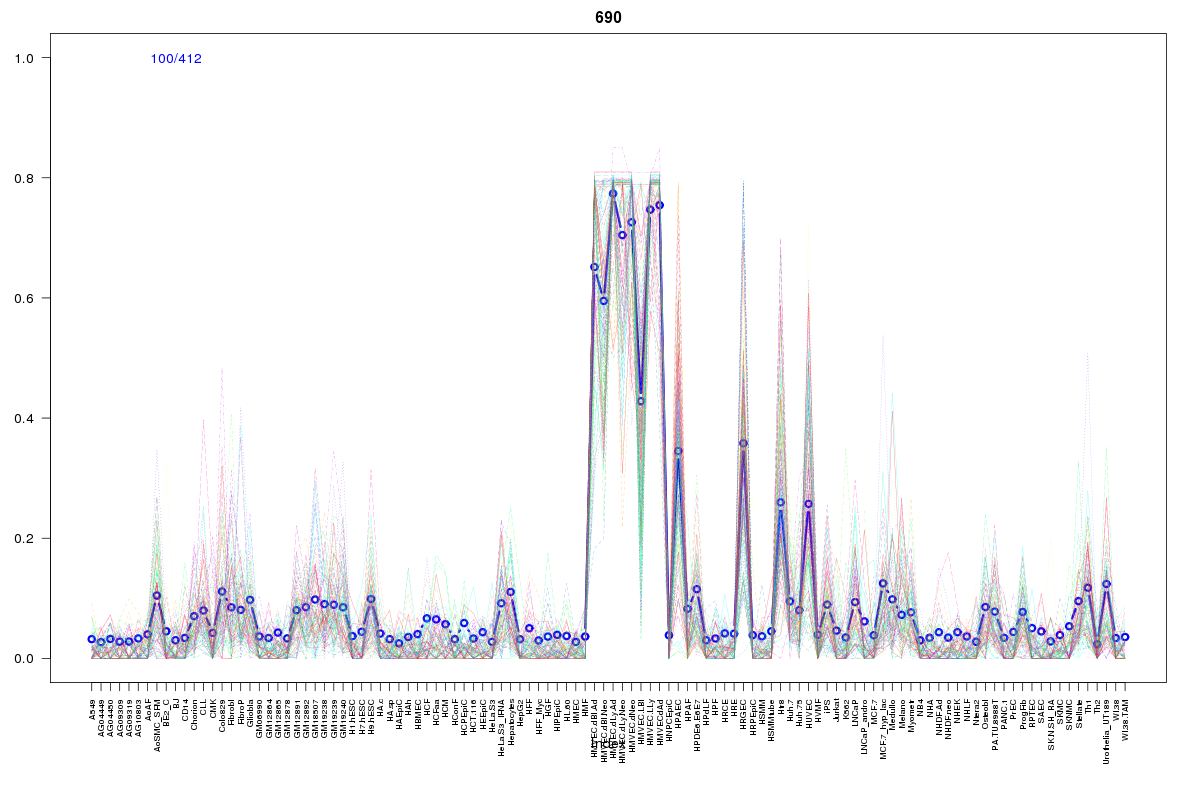 | 690 | 1 |
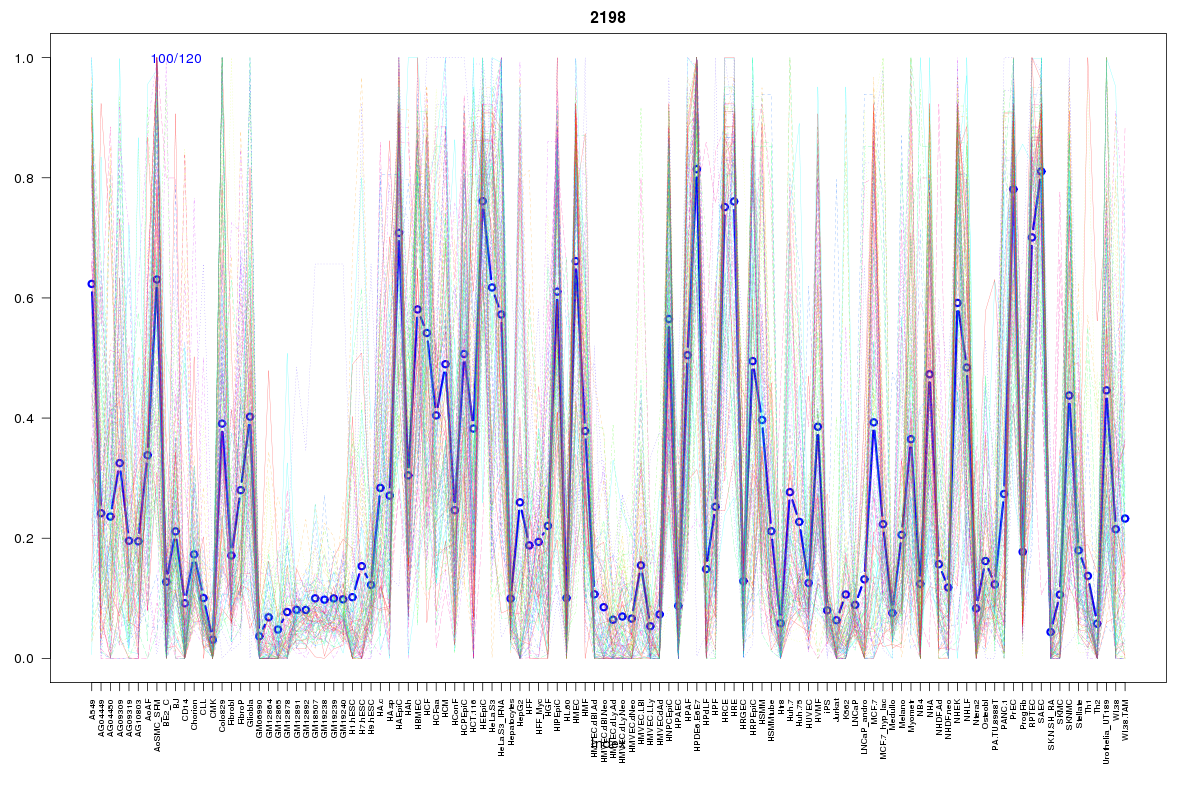 | 2198 | 1 |
 | 2250 | 1 |
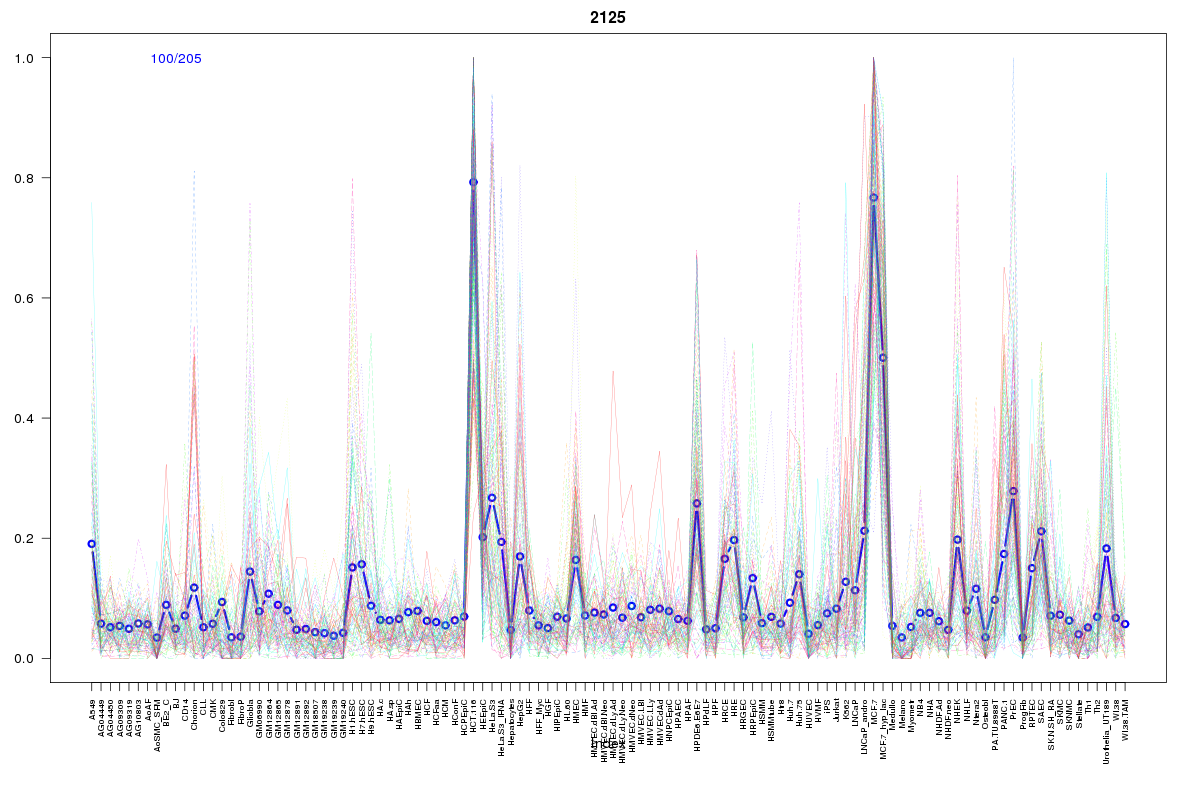 | 2125 | 1 |
Resources
BED file downloads
Connects to 79 DHS sitesTop 10 Correlated DHS Sites
p-values indiciate significant higher or lower correlationExternal Databases
UCSCEnsembl (ENSG00000129422)